Payroll Dec 2024: Back to Good is Bad?
A strong set of jobs numbers roils UST handicapping and will set off a fresh rain dance on FOMC expectations.
The wrath of good jobs hits the market.
The bullish payroll is a long way from the term “depression” tossed around in pre-election jawboning. The UST and equity markets are showing anxiety on the jobs number even as the tariff and trade risks are also higher rather than lower this week (see US-Canada: Tariffs Now More than a Negotiating Tactic 1-9-25).
Higher payrolls for Dec come naturally after solid JOLTS numbers in Nov released this past week on the 1-month lag (see JOLTS: A Strong Handoff 1-7-25) and wrap up a solid final month and calendar year of jobs performance under Biden with 4 years of favorable payroll numbers across the post-COVID cycle (see Payroll % Additions: Carter vs. Trump vs. Biden…just for fun 1-8-25).
The UST market is feeling some pain on the numbers as we go to print. Equity valuations are also showing some uneasiness in revisiting the FOMC scenarios in 2025 after the Dec 2024 FOMC meeting rattled the market with its revisions on median fed funds guidance (see Fed Day: Now That’s a Knife 12-18-24).
For the high-level numbers, U-3 dipped to 4.1% from 4.2% in the Household data while the structural underemployment U-6 dropped to 7.5% from 7.7%. The civilian labor force grew by +243K, the number of unemployed declined by -235K, and the number of employed rose by +478K.
The 256K in adds in the Establishment data was a strong headline but unimpressive in breadth with Goods a small negative in Manufacturing, Durables negative and Construction only slightly positive this month. In Services, which dominated at 90% of the net increase, we see Retail a very favorable variance while State and Local governments keep on hiring (they apparently did not get the memo how bad the economy is relative to the tax base!).
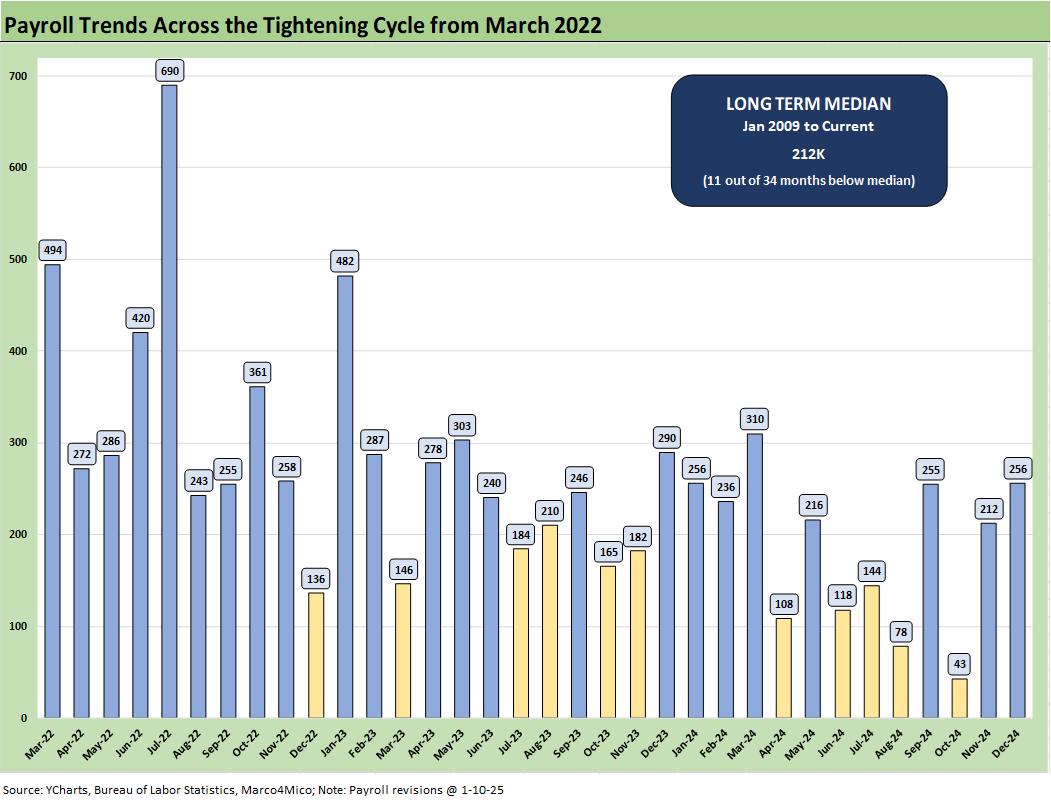
The above chart plots the monthly job adds from March 2022, which is when ZIRP ended and the tightening cycle kicked into gear. The+256K is well above the median adds of +212K seen since Jan 2009 although it comes with the asterisk of the strike add-backs and storm setbacks.
In the context of what was going on across the tightening cycle and the volatility of securities markets and incessant mis/disinformation around the health of the economy, we look out to a basic principle that “higher is better than lower.” All of the months across the tightening cycle being higher also brings a somewhat positive flavor to the employment picture (sarcasm intended). As recently as the fall, one candidate used the word “depression” after a Boeing strike and weather drove the payroll numbers lower.
Such illusory concepts as higher beats lower are not always front and center in a protracted election cycle that seemed to last 4 years. We saw an incessant embrace of ignoring facts and statistics even if actions at the state and local level evidence a very different set of local economy conclusions (see Employment: Real Numbers vs. Fictitious Dystopian Hellscapes 3-9-24, State Unemployment: A Sum-of-the-Parts BS Detector 6-30-24, State Level Economic Reality Check: Employment, GDP, Personal Income 9-28-24).
We bring up the political angles since the potential for extreme disinformation will remain as tariffs get rolled in when deportation gets underway, trade retaliation kicks into gear, and Federal employees run into a DOGE meat grinder. (Of course, you can always go to Facebook.) The state and local payroll have been a major source of job growth as local economies stay strong across so many states (see State Unemployment Rates: Reality Update 10-22-24).
The above chart updates the time series for the unemployment rate vs. job adds since Jan 2009 when the systemic crisis was in full swing. That was on the way to a lagging 10.0% unemployment rate and very slow recovery of payroll as the shock worked its way through the system in a ZIRP and QE world.
We separated some of the worst of the COVID impacts in the box within the chart to protect the visuals of the swings across the cycles from 2009. We would highlight the Mar 2009 plunge of -820K as the world was melting down. COVID of course is in a class by itself. We also highlight the 3.4% low for unemployment in April 2023.
The above chart updates the time series for the U-3 unemployment rate and U-6 structural underemployment rate across the years from 1994. The current U-3 rate of +4.1% ticked lower sequentially from 4.2%. The U-3 is up from +3.8% last year on a SAAR basis. That offers some easy data points on the softer payroll trends.
As a reminder, the U-6 metric is defined with the numerator as “total unemployed + persons marginally attached to the labor force + total employed part time for economic reasons.” The denominator is “civilian labor force + workers marginally attached to the labor force.”
The U-6 moved lower sequentially to 7.5% from 7.7%, and that is well above the 6% handles seen in spring of 2023 and higher than the 7.2% in Dec 2023 on a SAAR basis.
Overall, payrolls are steady for households with this mix of metrics, and recession signals are still quite low with low 4% unemployment rates. In the 1990s that would be considered full employment. A shock can always change the flavor, and the 2025 debate is over what will unfold with tariff and trade war risk. The rhetoric only got worse this past week (see US-Canada: Tariffs Now More than a Negotiating Tactic 1-9-25).
The above chart posts the “U-6 minus U-3” differential as a frame of reference. The current 3.4% differential is well below the post-1994 median of 4.0%. The March 2009 and Sept 2011 peaks in the 7% area show the cyclical pain and weak employment backdrops. COVID is a radical outlier that saw metrics swing around dramatically as detailed in other charts.
The Sept 2011 period was during a fresh dip into systemic fears on global sovereign and bank turmoil. Fears of credit contraction flared up again as investors worried about outflows and banks potentially facing counterparty confidence and risk aversion issues again. The post-crisis regulatory discipline was still in its early stages.
March 2009 marked the stock market lows and was a few months ahead of the recession bottom in June 2009. The auto sector was collapsing and even GE/GECC was under scrutiny.
The above chart updates the total payroll numbers against the unemployment rate from Jan 1972. The chart shows the dramatic swings across time during some ugly periods such as the late 1973 oil embargo on the way into a nasty stagflation bout in 1974 during a recession that ended in March 1975. That late 1973 to March 1975 stretch was the longest postwar recession until the financial crisis (see Business Cycles: The Recession Dating Game 10-10-22, Expansion Checklist: Recoveries Lined Up by Height 10-10-22, Misery Index: The Tracks of My Fears10-6-22).
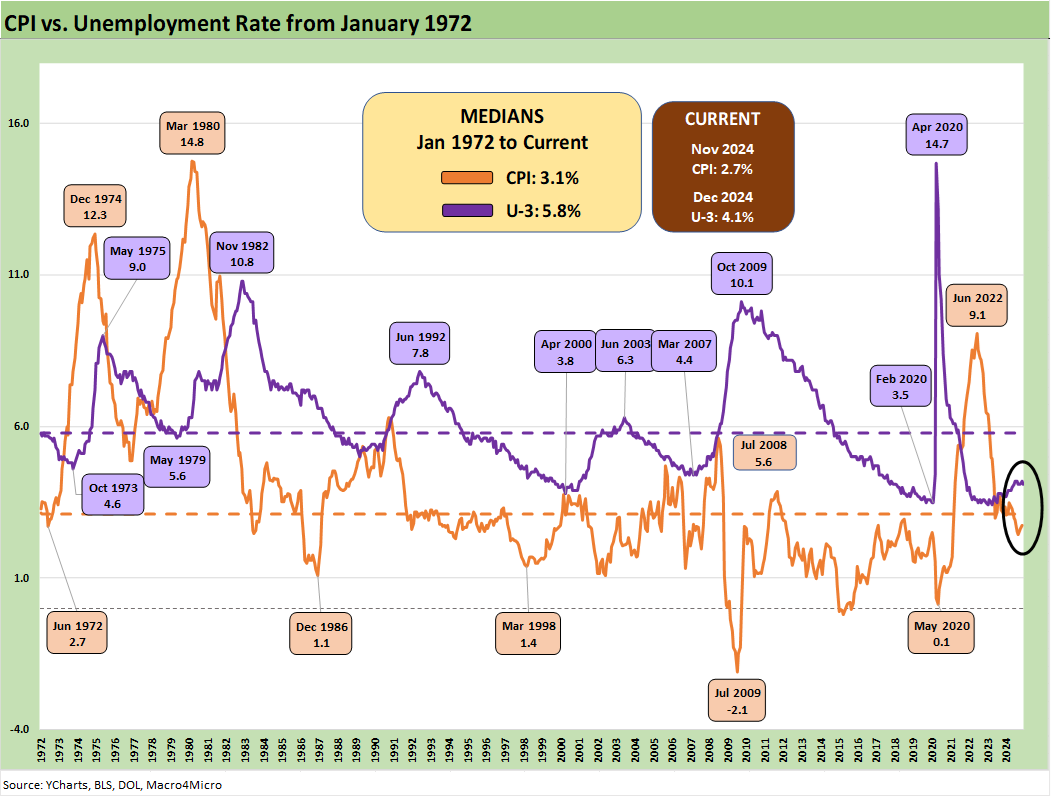
The median CPI metrics from 1972 (+5.8%) and from Jan 2009 (+5.2%) give some context to what today’s CPI looks like at 2.7% headline CPI for Nov 2024 (see CPI Nov 2024: Steady, Not Helpful 12-11-24). We get the Dec CPI reading next week. Services remains the stubborn point of resistance. The threats to labor supply-demand balances on the lower end of the hourly wage spectrum is unlikely to ease cost pressures on many major services industries that dominate the payroll mix.
The above chart plots Total Payroll vs. Job Openings from Jan 2009. The “counting heads” approach goes back to the old rule we always invoke of “Mo paychecks, Mo money, Mo spending” which of course should include many jobs that are “off the books” of monthly payroll reporting. Many “off the books” jobs will be in the crosshairs of Stephen Miller for deportation.
As of now, the recent JOLTS report came in bullish for labor demand at a level (8.1 million) well above the peak numbers of Trump 1.0 (7.5 million) during Nov 2018 (see JOLTS: A Strong Handoff 1-7-25). Strong labor demand with a shrinking labor force will need to flow into the low end of the wage structures. That raises inflation anxiety and labor cost pressures. This month saw +3.9% on average hourly wages. We would assume that is biased higher in 2025.
How those numbers and related PCE spending might get hit by mass deportation will be a topic for 2025. Supply-demand realities are immune to politics no matter how it is all “messaged” from political axe grinders (left or right). Many occupational line items from a wide swath of lower paying services will feel the imbalances and labore shortages that unfold. Construction will also feel labor dislocations.
That is subject to the very uncertain and inconsistent rhetoric on what the aim is and on the targeted deportations. The estimates from Team Trump range from 1 million “criminals” to around 12 million undocumented workers to numbers used in the campaign such as 20 million. The news this week reported unconfirmed plans for high profile employer raids in Washington DC on Day 1. Targeting employers implies that it is about more than criminals.
The above chart adds another angle from 1972 to current times as we plot CPI vs. the unemployment rate. The inflationary bounce from lows such as 1972, Dec 1986, March 1998, and the deflation of July 2009 offer some reminders of how inflation can move quickly. The role of energy in past swings in inflation have been notable but food had its moments as well.
The chart also offers a reminder that inflation spikes of the sort seen in 2022 are very rare. The manner in which payrolls and PCE pushed right through that relatively brief and concentrated bout of inflation (at least relative to what I saw as I came of working age across the 1974 to 1981 inflation/stagflation years.)
The catalysts to get there in those years ran the gamut from shooting wars (post-Vietnam inflation, Middle East Wars) to oil shocks (Arab oil embargo). There was also plenty of panic back then that the US was running out of natural gas. That proved to be ludicrous but was very much the conviction in the energy industry as natural gas pipelines entered into long-term “take-or-pay” contracts they came to regret later.
We hope not to add tariff spikes and “trade wars” to the list in 2025 and pray a shooting war does not pile on. We shall see.
Across the occupation lines and into the weeds…
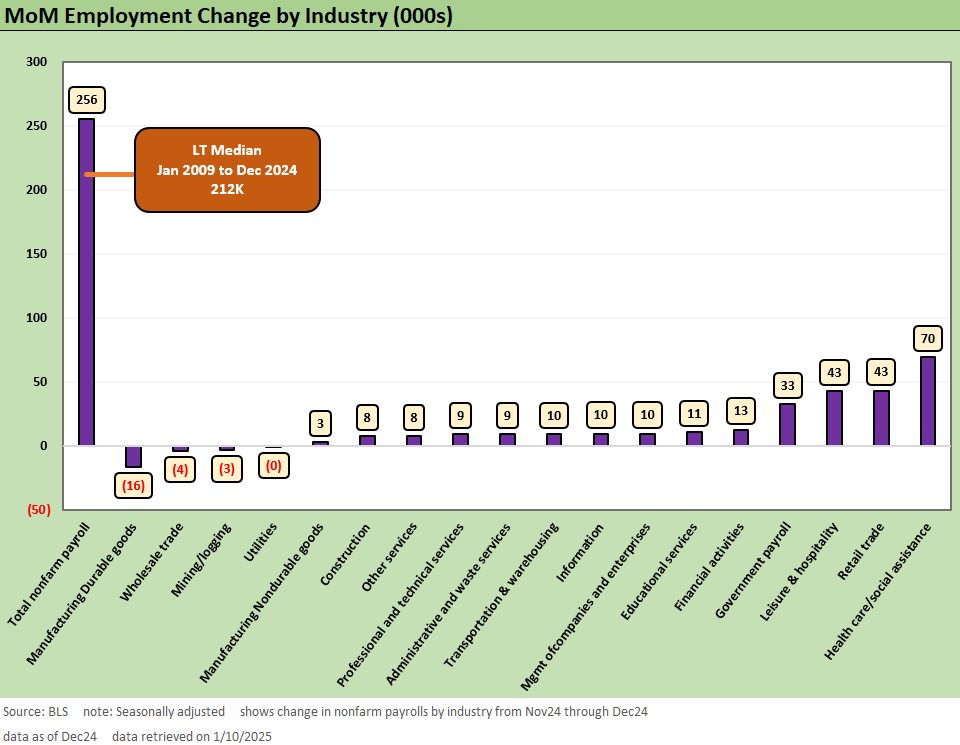
The above chart breaks out the sequential monthly payroll deltas by major industry to close out 2024. The strong jobs number today exceeds the long-term median. However, that strength is diminished looking at breadth with a majority of the month coming from Services. The top 3 above of Healthcare and Social Assistance, Retail Trade, and Leisure & Hospitality comprise over 60% of the payroll adds this month from just over 33% of the payroll base and all sit within Services.
The left side of the above chart shows continued struggles for Manufacturing in 2024 where another -16K jobs were shed in Dec with Mining and Logging similarly struggling in Dec. Nondurables Manufacturing saw minimal gains but at least curbed further declines.
Finally, Construction added a small number this month and is set to have a busy 2025 given not just the longer-term construction projects underway but now tragic hurricane and wildfire related rebuilding needed. The cost of those workers and subcontractor payrolls will be rising if supplier chain tariffs and deportation dislocations have a logical effect on cost structures.
Higher cost rebuilding at a slower pace strikes us as a suboptimal policy design even if psychically satisfying to a subset of the US population.
The above chart provides a step back to the final score for 2024 (at least until revisions next month). It comes as no surprise that Healthcare and Social assistance posted the lion’s share of the gross change across the year with just over 900K adds. The demographic basis for continued demand saw hiring pick up in a big way this year. There is a sharp step down to round out the Top 3 with Government #2 at +440K and Leisure & Hospitality #3 at +285K. The top 3 line items do not go under the heading of “multiplier effect” industries.
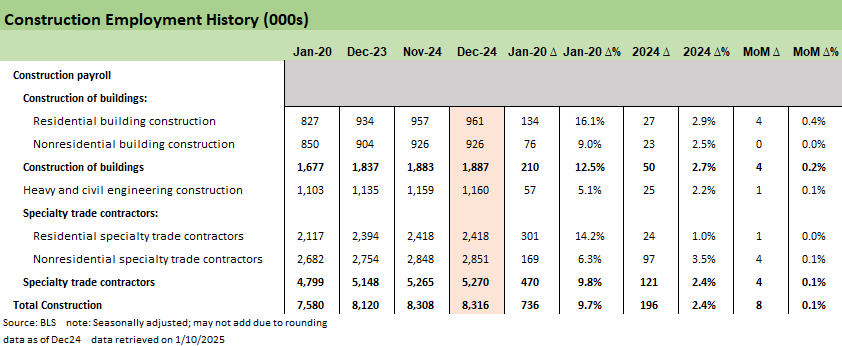
We also highlight the +196K of construction jobs this year that represent a large swath of real economic activity underway as an important indicator of the health of the economy. Multiplier effects across the board are plentiful through that industry given the sprawling activity surrounding construction work. The challenge there will be the cost of labor and supplies.
As highlighted throughout the year and in many past discussions, the manufacturing sector continues to struggle despite policy efforts to revive and stem the bleeding caused by years of offshoring. Durable Goods Manufacturing lost -88K jobs this year in a reversal of some minor growth in the post-COVID recovery period.
The above chart changes the frame from gross payrolls growth to percentage growth across 2024 for some further context. Not only was Healthcare and Social assistance massive in gross adds but also posted a very impressive 4.1% YoY growth figure. In payroll terms, that is a big number. Construction pops up to #2 with 2.4% and Government payrolls drops to the #3 spot with 1.9% growth on the year.
Overall payroll growth for the year at 1.4% is not that impressive overall but represents remarkable resilience after 3 years of a very strong post-COVID market. We also note that it is broadly in line with the payroll growth in expansion years post 2000 where yearly growth has reached 2% only 4 times and 3 times during the most recent administration. (2014, 2021, 2022, 2023).
The next chart above breaks out the broader array across key line items for public vs. private and key private sectors. We provide post-COVID, 2024, and month-over-month gross numbers and deltas for these groupings and more below.
For the year as a whole, private sector payrolls rose by 1.79 mn (+1.3%), while government payrolls added 440,000 jobs (+1.9%). December alone saw a net gain of 256K jobs, with private payrolls up by 223K and government payrolls up by 33K.
As we step back to place 2024 into the context of the post-COVID recovery, we see a lot more than just a bounce-back. The immediate post-pandemic rebound was driven by a sharp recovery in industries like leisure and hospitality and retail for the full year 2024. Notably, government hiring accelerated in 2024, reflecting increased staffing needs at the State and Local levels.
Manufacturing continued to face headwinds in Dec, down -13K jobs overall with -16K in Durables and +3K for Nondurables. Computer and Electronic products and Motor Vehicles and parts saw the largest declines though almost all the line items fared poorly in the month. Durables payrolls decreased overall by -88K for the year with only minor growth in Other transportation equipment (+3K) and Nonmetallic mineral products (+2K).
With tariffs such a focus for the incoming administration, it is worth remembering how hard it has been across multiple cycles to revive US manufacturing. Lower cost supplier chains have been the norm for decades. Unwinding that history and the functioning of that supplier chain is easier on a whiteboard and at the podium than in practice. The option is also to raise prices and even downsize if the supplier chains are not in place in the current capital budgeting year.
Manufacturing payrolls during the last Trump administration lagged the broader payroll growth despite the use of tariffs, and much higher tariffs are apparently supposed to be the policy cure. Tariffs can change the calculation at the margin but bringing a renewed manufacturing renaissance is a much larger task as unit costs rise from commodities and raw materials to intermediate components at the same time that hourly wages climb. The manufacturing sector got a big taste with semiconductor shortages.
In contrast with the monthly and yearly results for Durables manufacturing, the Nondurables exited 2024 pretty much flat at +1K jobs on the year. As covered in previous publications, the only bright spots in this area include Food Manufacturing, Chemicals, and the miscellaneous category.
The next chart covers the construction industry that has been a major winner in the post-COVID recovery, up +736K jobs (+9.7%) since Jan 2020. This year continued that trend at +2.4% and +196K jobs. Given the further demand tied to natural disasters late in the year, 2025 should see continued strength.
As covered earlier, Services gains this month were the major contributor to the overall jobs number at +231K on the month. When narrowing the scope to just private sector adds of +223K, we see where such a strong jobs number today eclipsed some underlying weakness in other areas. There may be a more nuanced discussion to be had about the relative quality of job adds this year or in the post-COVID recovery, but another 231K MoM, 1.69mn in 2024, and almost 6mn since Jan-20 is enormous.
The last chart covers the Government payrolls where broad hiring across the board has been this year’s theme. The overall +440K Government adds in 2024 (+1.9%) represents more than half of the growth in the last few years since COVID times.
The DOGE ambitions will lead to some serious pain at the Federal level, but the impressive hiring at the state and local level was relatively concentrated in 2024. We find the boom and hiring nationwide at the state and local level to be a trend that shreds much of the double talk from the state and local leaders who talk about how bad it is at the national level. The “same old, same old” with those types.
See also:
US-Canada: Tariffs Now More than a Negotiating Tactic 1-9-25
Payroll % Additions: Carter vs. Trump vs. Biden…just for fun 1-8-25
JOLTS: A Strong Handoff 1-7-25
Annual GDP Growth: Jimmy Carter v. Trump v. Biden…just for fun 1-6-25
Footnotes & Flashbacks: State of Yields 1-5-25
Mini Market Lookback: Mixed Start, Deep Breaths 1-5-25
Footnotes & Flashbacks: Credit Markets 2024 1-3-25
Footnotes & Flashbacks: Asset Returns for 2024 1-2-25
HY and IG Returns since 1997 Final Score for 2024 1-2-25
Spread Walk 2024 Final Score 1-2-25
Credit Returns: 2024 Monthly Return Quilt Final Score 1-2-25
Annual and Monthly Asset Return Quilt 2024 Final Score 1-2-25
HY and IG Returns since 1997: Four Bubbles and Too Many Funerals 12-31-24
Footnotes & Flashbacks: State of Yields 12-29-24
Mini Market Lookback: Last American Hero? Who wins? 12-29-24
Spread Walk: Pace vs. Direction 12-28-24
Annual and Monthly Asset Return Quilt 12-27-24
Credit Returns: 2024 Monthly Return Quilt 12-26-24
New Home Sales: Thanksgiving Delivered, What About Christmas? 12-23-24
Mini Market Lookback: Wild Finish to the Trading Year 12-21-24
Trump Tariffs 2025: Hey EU, Guess What? 12-20-24
PCE, Income & Outlays Nov 2024: No Surprise, Little Relief 12-20-24
Existing Home Sales Nov 2024: Mortgage Vice Tightens Again 12-19-24
GDP 3Q24: Final Number at +3.1% 12-19-24
Fed Day: Now That’s a Knife 12-18-24
Credit Crib Note: Iron Mountain 12-18-24
Housing Starts Nov 2024: YoY Fade in Single Family, Solid Sequentially 12-18-24
Industrial Production: Nov 2024 Capacity Utilization 12-17-24
Retail Sales Nov24: Gift of No Surprises 12-17-24
Inflation: The Grocery Price Thing vs. Energy 12-16-24
Toll Brothers: Rich Get Richer 12-12-24
CPI Nov 2024: Steady, Not Helpful 12-11-24
Mini Market Lookback: Decoupling at Bat, Entropy on Deck? 12-7-24
Credit Crib Note: Herc Rentals (HRI) 12-6-24


