
Mini Market Lookback: Policy Blitz Formation
The Day 1 action on tariffs is still more talk than walk, but the clock is ticking for answers. Deportation still lacks visibility on scale.


Mixing signals on policy planning or just lining up offside?
The markets saw a decent week for risk, credit spreads tighter, equities solid, and a quiet UST curve overall with policy “slicing and dicing” hard to do at this point with more speculation than detail.
The UST supply picture requires legislation and debt ceiling dynamics to be framed while tariffs are still more bluster than fact. The Big 4 trading partners are waiting to see what they will need to do in retaliation at the risk of a material, lasting breach by Trump with the #1 and #2 national trade partners. The EU bloc will have their usual bureaucratic, disciplined approach to proportional retaliation, but an attack on the sovereign rights of a NATO ally and EU member (Denmark) would break new ground.
The ability to throw as much noise into the process as possible and run the usual “maximum hostility and division game plan” is very much the order of the day (DEI, blanket Jan 6 pardons, CA fire relief only with voter ID, major late night independent Inspector General purges, “we will arrest you”, etc.).
So far, the stream of executive orders has managed to clutter up the economic specifics under the guise of a “review” on trade. The tone in tariffs appear aimed more at Canada and Mexico, and that also brings greater intrinsic inflation and profitability threats.
The markets are still in a waiting game and notably in credit. There is very little at this point to plot a path to a default cycle or material erosion in credit quality. As we learned in 1989, 2000, and 2007, the pain can come on fast, but this time the pain would need to be self-inflicted by policy. In those earlier cycles, the “bad assets” and reckless risk management was already in the market waiting.

The above chart updates the weekly returns of the 32 benchmarks and ETFs we track, and the score of 29-3 in favor of positive is clearly a good week. The 11 sectors in the S&P 500 delivered 10 positive and 1 negative (Energy). Earnings reports have been constructive with this coming week really ramping up a diverse mix after the earlier bank and financials wave was quite strong.
Tech strength during the past week is detailed in a separate chart below, but the top quartile above includes 4 of 8 with a heavy tech flavor given the Mag 7 influence in NASDAQ and the S&P 500. We see Communications Services (XLC) at #1 and the Tech ETF (XLK) at #4.
Industrials (XLI) and Russell 2000 (RUT) are in the top tier, and that is a vote of confidence during inauguration week – until the tariff details emerge that is. Health Care (XLV) has been erratic for numerous reasons including the RFK Jr X factor and questions around regulatory reform (pharma prices, insurance, etc.). The UST dynamics are setting the pace for EM equities (VWO) for now. The trade/tariff details will be a big part of the China equities story soon enough.
The bottom quartile has only 3 negatives, but 5 of the 8 were bond ETFs in a week where equity prices dominated the price action overall. E&P (XOP) and Energy (XLE) sat on the bottom of the rankings with the Base Metals ETF (DBB) also in the red. Base Metals and E&P could be in for some wild times ahead depending on the Trump policies on Canadian crudes and natural resources.
With respect to crude oil, we consider the Trump threats on Russia as empty and a feint in the end game of throwing Ukraine under a Soviet-era tank. The purge on the House GOP Intel Committee of a Ukraine supporter (Mike Turner of Ohio) to a replacement with an anti-Ukraine Rep (Rick Crawford of Arkansas) at Trump’s request is a sign of what lies ahead. Recent actions and this week’s threat of more sanctions on Russia could create turmoil in the oil markets, but the potential for more Russian oil in the global markets at some point in 2025 is a material policy handicapping exercise. We still see the Trump policy as pro-Russia and anti-Ukraine as the buzzard flies.
There will be no shortage of conspiracy theories on how to juggle Canadian supply and Russian supply looking out beyond some major geopolitical moving parts. For those of us who have been looking at oil market behavior from the early 1980s (mid-1980s crash, late 90s volatility, post-Iraq invasion after 2003, the shale crash of 2014-2016, Russian invasion of Ukraine in 2022, etc.), there has been no shortage of hits and misses on how to frame cartel behavior (OPEC) and capital budgeting decisions in the private sector.
The idea that the US upstream operators will simply “drill drill drill” and blow up the price of oil is getting a lot of pushback from handicappers. The idea that Canada will use oil as a weapon to hammer US inflation trends as a retaliatory measure is an active debate in the Canadian media (Alberta would resist). The counterintuitive strategy of wanting to push inflation lower via oil prices while slapping tariffs on a critically important mix of Canadian grades that refiners favor is not going under the heading of a smart economic strategy. That would be a directly negative move at the gas pump. It would also unfold very quickly, and political opponents would be skywriting who to blame.

The above chart updates the tech bellwethers we track each week with the Mag 7 + Taiwan Semi + Broadcom along with some relevant benchmarks and equal weight ETFs (notably RSP and QQEW). We line up the assets in descending order of returns for the trailing week.
We see only two lines in the red with Apple and Tesla with TSLA more about its wildly positive returns since the election and over the trailing 6 months. For its part, Apple has been getting more than its share of street second-guessing and has been the weakest bellwether performer over multiple time horizons back to the trailing 6 months. For the LTM period, Apple only outperformed Microsoft among the Mag 7 but lagged both the S&P 500 and the Equal Weight S&P 500 ETF (RSP).
A sign of good news for market breadth is that the S&P 500 and Equal Weight S&P 500 (RSP) have been running closely (in relative terms) over some short timelines. Cyclical optimism has had various stretches of outperformance vs. tech-centric benchmarks as we cover each week in our Footnotes publication on asset returns.

The above chart shows a very mild to minimal UST delta story for the week by recent standards.
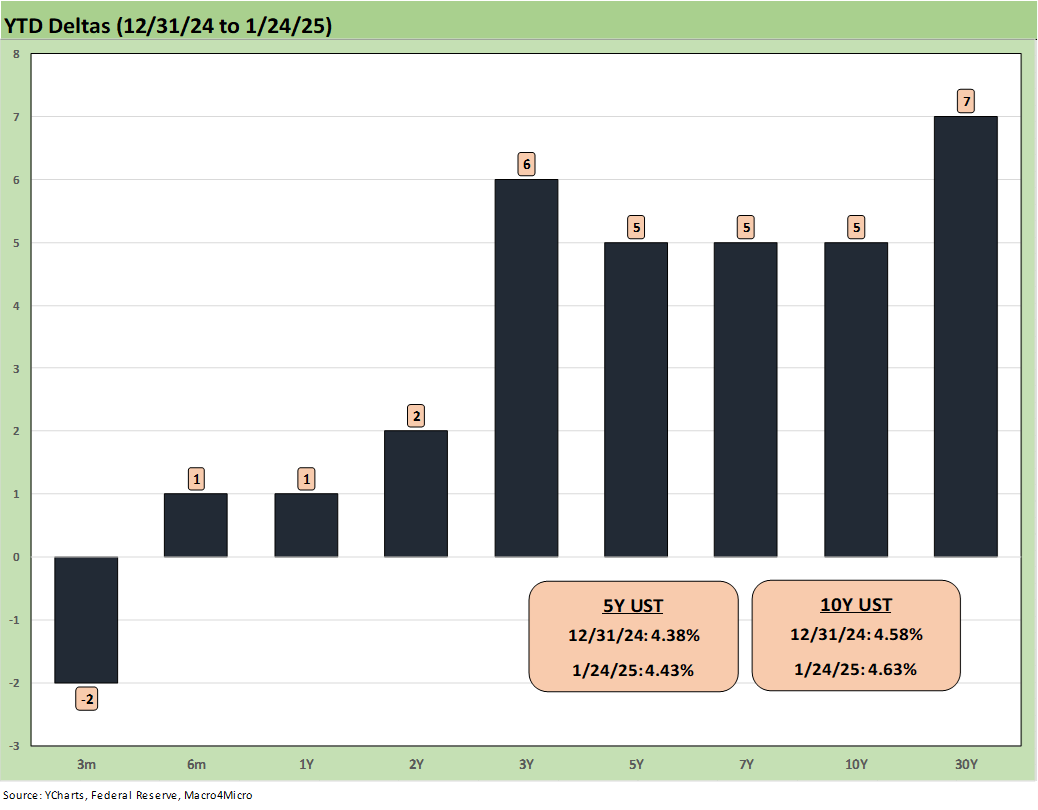
The above chart updates the YTD UST deltas. We see a modest bear steepener still in place but in single digit bps. The risk symmetry ahead could be for lower rates on the front end but higher on the long end. Trump’s virtual presentation to the Davos crowd this past week indicated he would “demand that interest rates drop immediately.” He sounded more like Bluto in Animal House (when the “Germans bombed Pearl Harbor”) than a leader versed in the dynamics of US and global interest rates. Let’s assume that he will go to war with the Fed and seek to fire Powell (who is less likely to back down than FBI heads). That is one legal obstacle.
The bigger obstacle is the reality that the markets set longer term rates, not the White House or the Fed. The Fed and White House can indirectly influence the 10Y UST (for one high priority example), but the market will be framing their view on rates based on expected deficits, economic factors (GDP, inflation, UST supply to fund soaring record deficits). Among the handful of bipartisan instincts still breathing in the US is the desire by asset managers to avoid letting their portfolio get smoked on a bad directional call on the UST curve or seeing interest-rate-sensitive stock holdings battered.
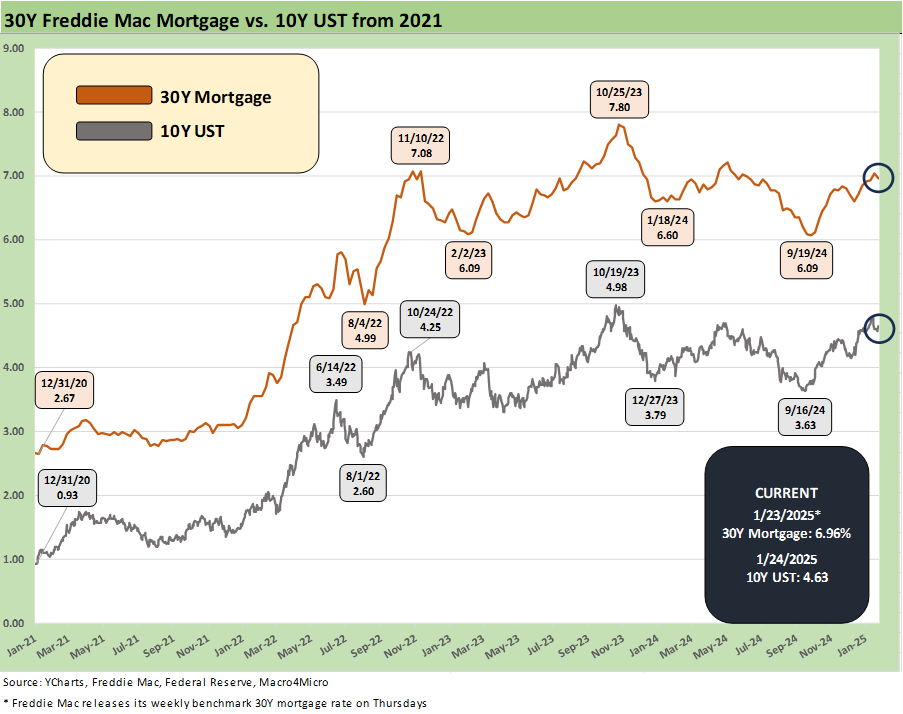
The above chart updates the running time series for the 10Y UST and the Freddie Mac 30Y mortgage benchmark (set Thursdays at noon). The 10Y is still hovering near 100 bps above the Sept 2024 lows. The mortgage survey this week saw the Freddie benchmark dip just below 7% again to 6.96%.

The above chart updates the HY index OAS since June 2024, and this week kept the compression going at -4 bps tighter to +260 bps. HY OAS briefly broke through the Nov 2024 lows at +259 bps midweek. The long-term median of +463 bps is a long way off.

The above chart updated the “HY OAS minus IG OAS” quality spread differential. HY vs. IG quality spreads narrowed again by -2 bps to +180 after dipping below the recent lows with a +178 bps print at midweek.

The above chart updates the “BB OAS minus BBB OAS” quality spread differential. We see the incremental risk premium for BB vs. BBB move -2 bps again this week to +59 bps vs. +61 bps last week. At midweek, the +57 bps was just above the July low of +55 bps.
See also:
Footnotes & Flashbacks: Credit Markets 1-20-25
Top 10 Fun Facts on Past Presidents and their Economies 1-20-25
Footnotes & Flashbacks: State of Yields 1-19-25
Footnotes & Flashbacks: Asset Returns 1-19-25
Mini Market Lookback: The Upside of Volatility 1-18-25
Industrial Production Dec 2024: Capacity Utilization 1-17-25
Retail Sales Dec 2024: A Steady Finish 1-16-25
CPI Dec 2024: Mixed = Relief These Days 1-15-25
KB Home 4Q24: Strong Finish Despite Mortgage Rates 1-14-25
United Rentals: Bigger Meal, Same Recipe 1-14-25
Mini Market Lookback: Sloppy Start 1-11-25
Payroll Dec 2024: Back to Good is Bad? 1-10-25
Payroll % Additions: Carter vs. Trump vs. Biden…just for fun 1-8-25
JOLTS: A Strong Handoff 1-7-25
Annual GDP Growth: Jimmy Carter v. Trump v. Biden…just for fun 1-6-25
Mini Market Lookback: Mixed Start, Deep Breaths 1-5-25
Tariff links:
US-Canada: Tariffs Now More than a Negotiating Tactic 1-9-25
Trade: Oct 2024 Flows, Tariff Countdown 12-5-24
Mexico: Tariffs as the Economic Alamo 11-26-24
Tariff: Target Updates – Canada 11-26-24
Tariffs: The EU Meets the New World…Again…Maybe 10-29-24
Trump, Trade, and Tariffs: Northern Exposure, Canada Risk 10-25-24
Trump at Economic Club of Chicago: Thoughts on Autos 10-17-24
Facts Matter: China Syndrome on Trade 9-10-24
Trade Flows: More Clarity Needed to Handicap Major Trade Risks 6-12-24
Trade Flows 2023: Trade Partners, Imports/Exports, and Deficits in a Troubled World 2-10-24
Trade Flows: Deficits, Tariffs, and China Risk 10-11-23