
Industrial Production Dec 2024: Capacity Utilization
The manufacturing sector is steady ahead of many radical changes in supplier chain economics soon to arrive.


We see the heavier balance of metrics showing stronger sequential capacity utilization in Dec 2024 with total manufacturing higher, durables higher, nondurables higher, mining higher, and utilities higher.
Within durables, the strongest move was in Aerospace as that sector climbs out of the doldrums at levels still well below long term averages.
Autos eased on the month and the same for Machinery, but Fabricated Metals and Electrical Equipment ticked higher in a mixed picture within the durable lines.
Nondurables overall were higher led by the two largest lines of Chemicals and Food/Beverages.

The above chart updates long-term manufacturing capacity utilization. The current 76.6% is below the long-term median. We also include some other timeline medians and the current level is only ahead of the post-crisis expansion median (July 2009 to Jan 2020) to just before the start of COVID.

The above chart updates the high-level buckets in the Total Industry mix. The net trends across the categories on a simple “up-down” basis for Dec 2024 is favorable on balance in sequential context. When framed vs. long-term averages, the industrial mix is weak. We include MoM and YoY delta columns on the right. At the top line category level, the MoM delta story is favorable but not the YoY trends.
The ability to sustain high profits and solid margins in manufacturing sectors will get tested by tariffs and supplier chain economics and what that means for breakeven volumes. The performance will get tested by retaliation (volume and demand) and how exports might be undermined.
The strong dollar will not help exports although the UST currency policy seems to be “make sure the USD is the reserve currency while we slam trade partners with tariffs.” That has driven the stronger dollar. Then the policy spin is to project less inflation due to the stronger dollar (i.e., imports cheaper in dollar terms to mitigate tariffs) in one set of comments. Then they turn around and discuss the weaker dollar potential in a separate set of discussions while pretending that no nation can counter with competitive devaluations. The old “all other things being equal” caveat is alive and well. It is a great tradition in economic debates.
Many economists can debate 3 sides of a two-sided coin based on their assumptions, but the currency topic has been especially strange.
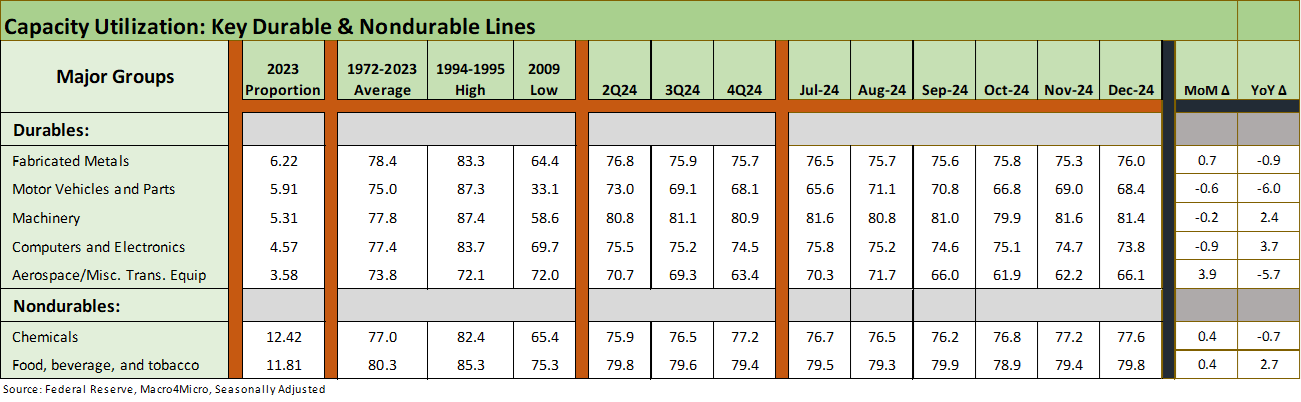
The above chart updates some of the largest durable and nondurable industry lines. We add columns on the right to detail the MoM and YoY deltas. The MoM deltas tell a mixed story by industry with aerospace volatile and one of the more erratic cap ute lines given Boeing’s myriad issues. The disruptions from strikes and other disruptions flow into the variances over time in areas such as autos and aerospace.

The above chart updates the long-term histories for expansions and recessions for frames of reference. The ability to generate profits and the relative scale of the profit margins gets tied back into pricing structure, volumes, product mix, and cost structures. In the new post-tariff and retaliation world, almost all of those moving parts will be up for grabs.

The above chart lines up the expansion and recession medians “by height” using manufacturing capacity utilization as the metric. We see the current cap ute level over on the left. The high rate of utilization in the 1970s tells a story of inefficient cost structures and high breakevens. The current cap ute rate benefits from a leaner cost structure that will be under scrutiny once the tariffs kick in.
See also:
Housing Starts Dec 2024: Good Numbers, Multifamily Ricochet 1-17-25
Retail Sales Dec 2024: A Steady Finish 1-16-25
KB Home 4Q24: Strong Finish Despite Mortgage Rates 1-14-25
United Rentals: Bigger Meal, Same Recipe 1-14-25
Footnotes & Flashback: Credit Markets 1-13-25
Footnotes & Flashbacks: State of Yields 1-12-25
Footnotes & Flashbacks: Asset Returns 1-12-25
Mini Market Lookback: Sloppy Start 1-11-25
Payroll Dec 2024: Back to Good is Bad? 1-10-25
US-Canada: Tariffs Now More than a Negotiating Tactic 1-9-25
Payroll % Additions: Carter vs. Trump vs. Biden…just for fun 1-8-25
JOLTS: A Strong Handoff 1-7-25
Annual GDP Growth: Jimmy Carter v. Trump v. Biden…just for fun 1-6-25
Mini Market Lookback: Mixed Start, Deep Breaths 1-5-25
Footnotes & Flashbacks: Credit Markets 2024 1-3-25
Footnotes & Flashbacks: Asset Returns for 2024 1-2-25
HY and IG Returns since 1997 Final Score for 2024 1-2-25
Spread Walk 2024 Final Score 1-2-25
Footnotes & Flashbacks: Asset Returns for 2024 1-2-25
Credit Returns: 2024 Monthly Return Quilt Final Score 1-2-25
Annual and Monthly Asset Return Quilt 2024 Final Score 1-2-25
HY and IG Returns since 1997: Four Bubbles and Too Many Funerals 12-31-24
Mini Market Lookback: Last American Hero? Who wins? 12-29-24
Spread Walk: Pace vs. Direction 12-28-24
Annual and Monthly Asset Return Quilt 12-27-24
Credit Returns: 2024 Monthly Return Quilt 12-26-24
New Home Sales: Thanksgiving Delivered, What About Christmas? 12-23-24
Mini Market Lookback: Wild Finish to the Trading Year 12-21-24
Trump Tariffs 2025: Hey EU, Guess What? 12-20-24
PCE, Income & Outlays Nov 2024: No Surprise, Little Relief 12-20-24
Existing Home Sales Nov 2024: Mortgage Vice Tightens Again 12-19-24
GDP 3Q24: Final Number at +3.1% 12-19-24
Fed Day: Now That’s a Knife 12-18-24
Credit Crib Note: Iron Mountain 12-18-24