
Footnotes & Flashbacks: State of Yields 1-26-25
We look at a mild week for the UST curve as the markets gear up for the FOMC meeting, PCE, and more tariff clarity.


Veruca Salt meets the leadership team. I want it NOW!!!!!!!
The highlight of the week may not have been Trump saying to the Davos crowd, “I’ll demand that interest rates drop immediately, and likewise, they should be dropping all over the world” but it was close. We are liking Veruca Salt for next Fed Chair.
In a world of net borrowers and need for a lot more lenders, that market will still set the market-clearing level of the UST curve. Meanwhile the law has determined how rates are set on the short end of the curve by the Fed.
The week saw low UST price action in relative terms after a wild 4Q24 period as the market awaits something resembling a debt ceiling, a budget, tariffs specifics, and some sense of the scale of deportation and what that might mean for various industry manpower shortages.
This coming week brings an FOMC meeting, PCE release (inflation, income, outlays) and the advance read on 4Q24 GDP with some more granular disclosure on consumption lines and running PCE inflation for 4Q24.
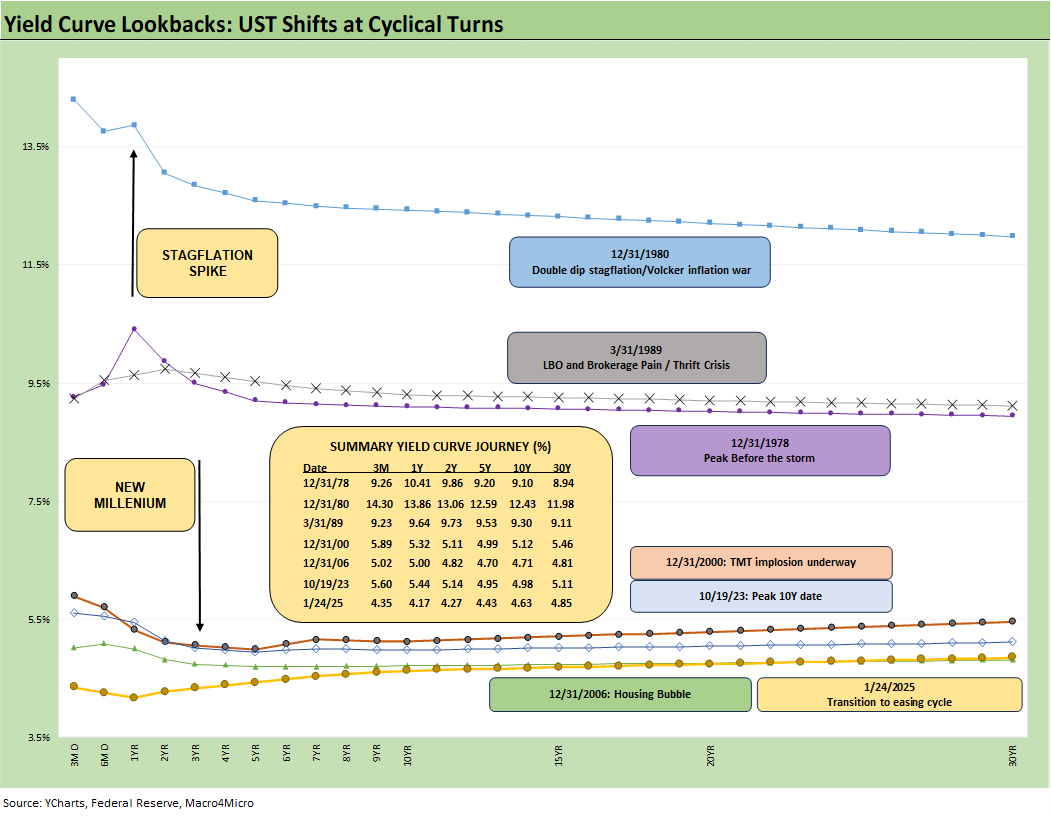
The above chart updates the UST curve migration we look at each week for some important frames of reference that are mostly from the pre-crisis, pre-ZIRP/QE years. We also include a 10-19-23 UST curve to mark the high on the 10Y UST at the post-crisis peak on rates. We include the yields in the box and plot the UST curve to hammer home how low UST rates actually are across history outside the ZIRP years. These pre-crisis UST curves end in 2006 and go back to the Carter inversion of 1978. Those periods are more rational to use as frames of reference as we move further into the post-inflation easing cycle outside “ZIRP world.”
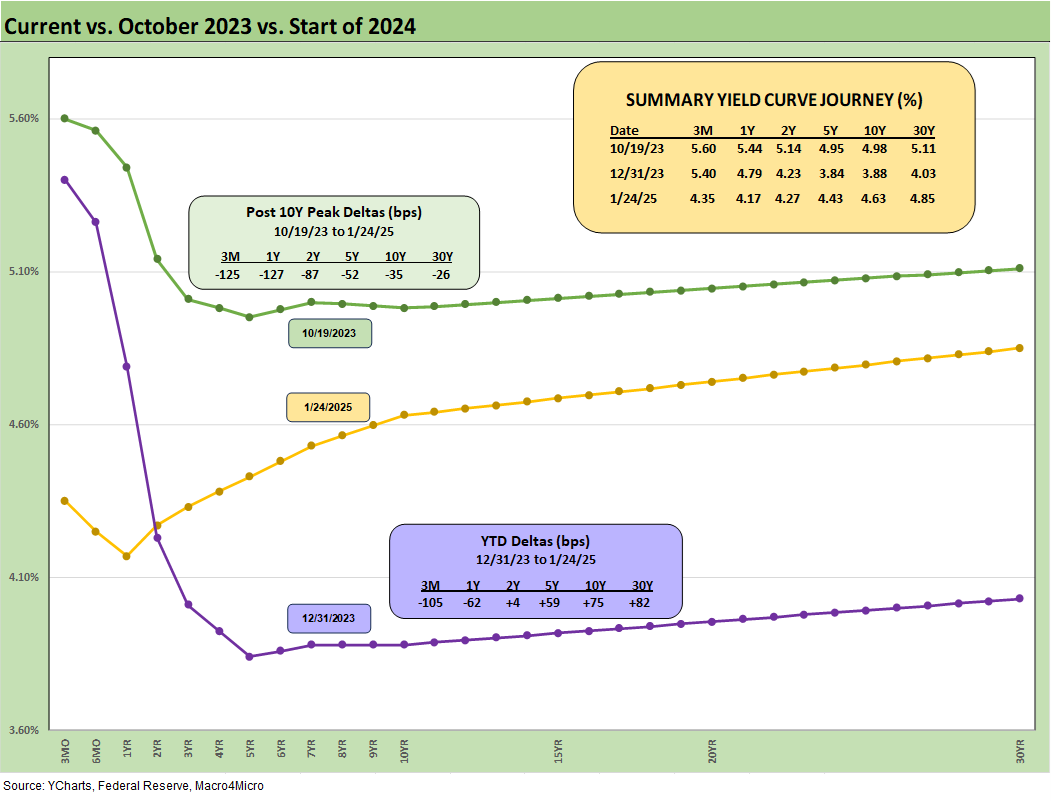
The above chart updates the UST deltas from the 10-19-23 peak and from the start of 2024. In the boxes within the chart, we include the UST deltas and yields for each date, and we plot the UST curves. The material UST bear steepener we see in 2024 was clearly not the consensus on the way into 2024 when 5-6 cuts and a bull flattening out past 2 years was the consensus.
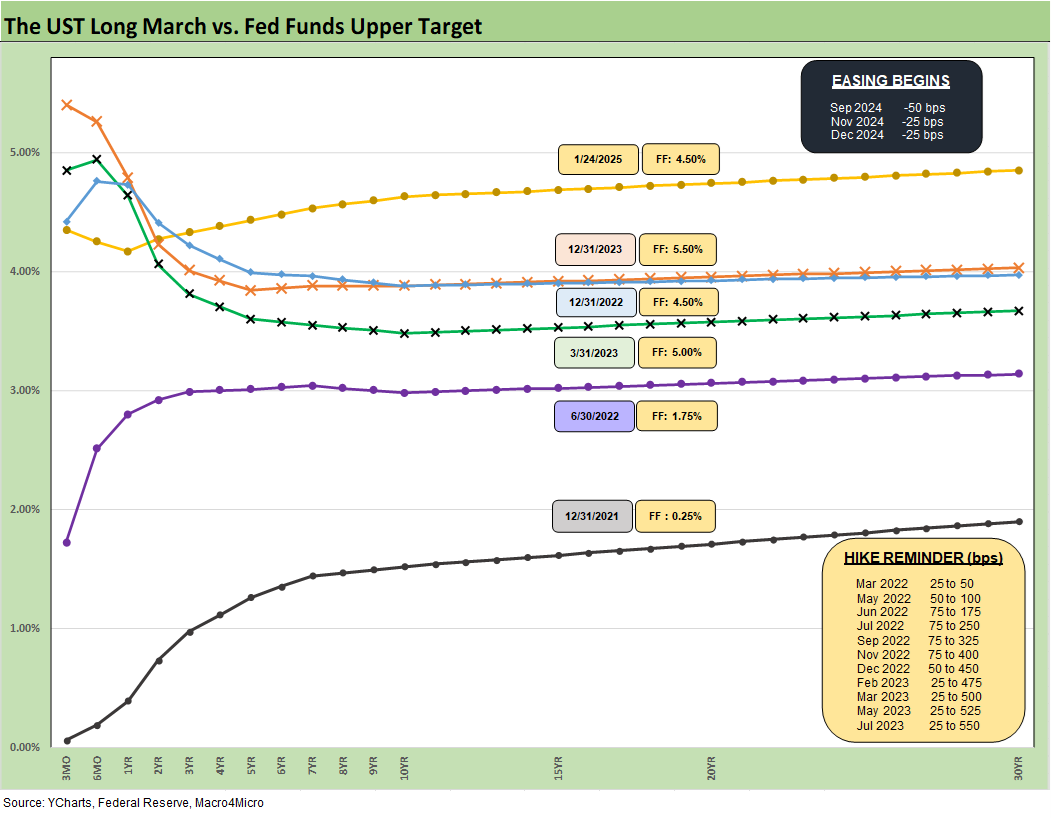
The above updates the UST migration across the tightening cycle. We see one material move lower across the period which happened in March 2023 with the regional bank crisis.
Our recurring theme in this chart is that the 10Y UST does not have to follow fed funds higher and lower. We saw the 10Y convergence of year end 2023 and 2022 with a 100 bps differential in fed funds, and we saw a UST steepener and 10Y UST move higher in an easing cycle in 2024.
There is more to the equation than the FOMC impulse to act in one direction or another, and that includes Trump making “demands” that interest rates decline. There is a full yield curve to consider, and the market sets the long end based on a wide range of variables and expectations.
The promises made for high growth, low inflation, high tariffs, and mass deportation are in one column. Over in the other column, we see record deficits, record UST supply, record high UST interest expense, tariff-driven pricing power for domestic operators in the US (steel, natural resources, etc.), and expected supply-demand imbalances for labor in some key sectors (agriculture, construction, food services, leisure, etc.). It is not about demand from the White House. It is about demand and supply in the markets.
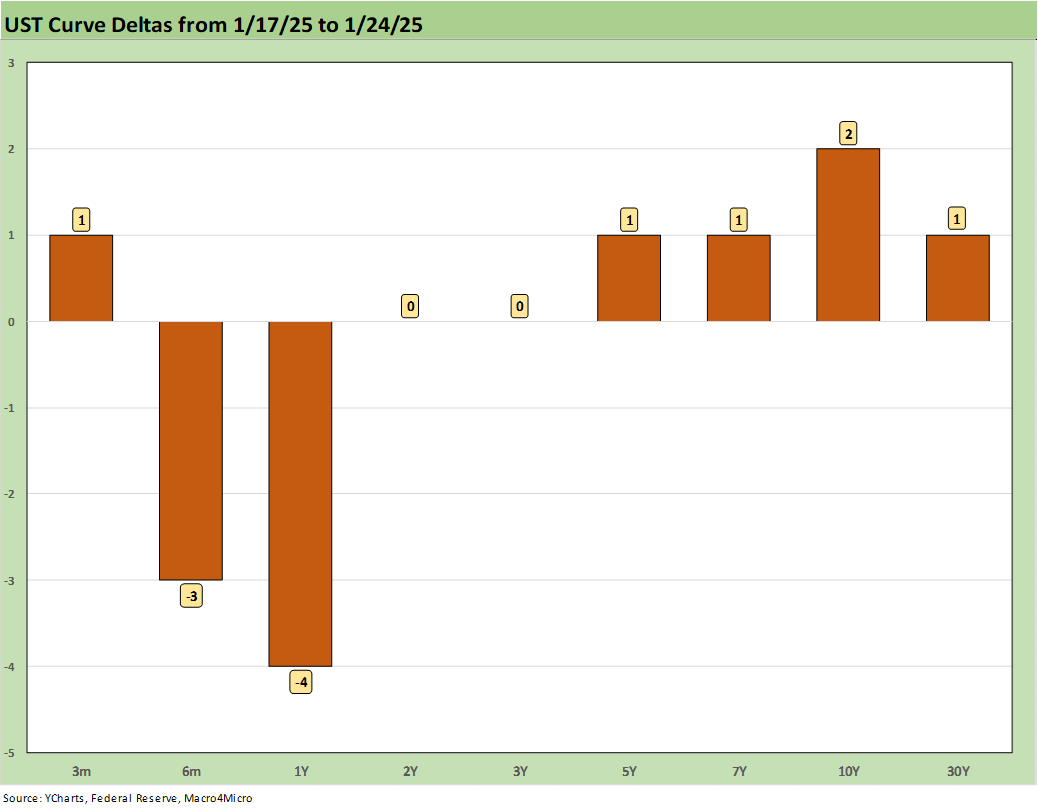
The above chart updates the UST deltas in a quiet week with minimal moves and some minimal ticks higher out the curve.
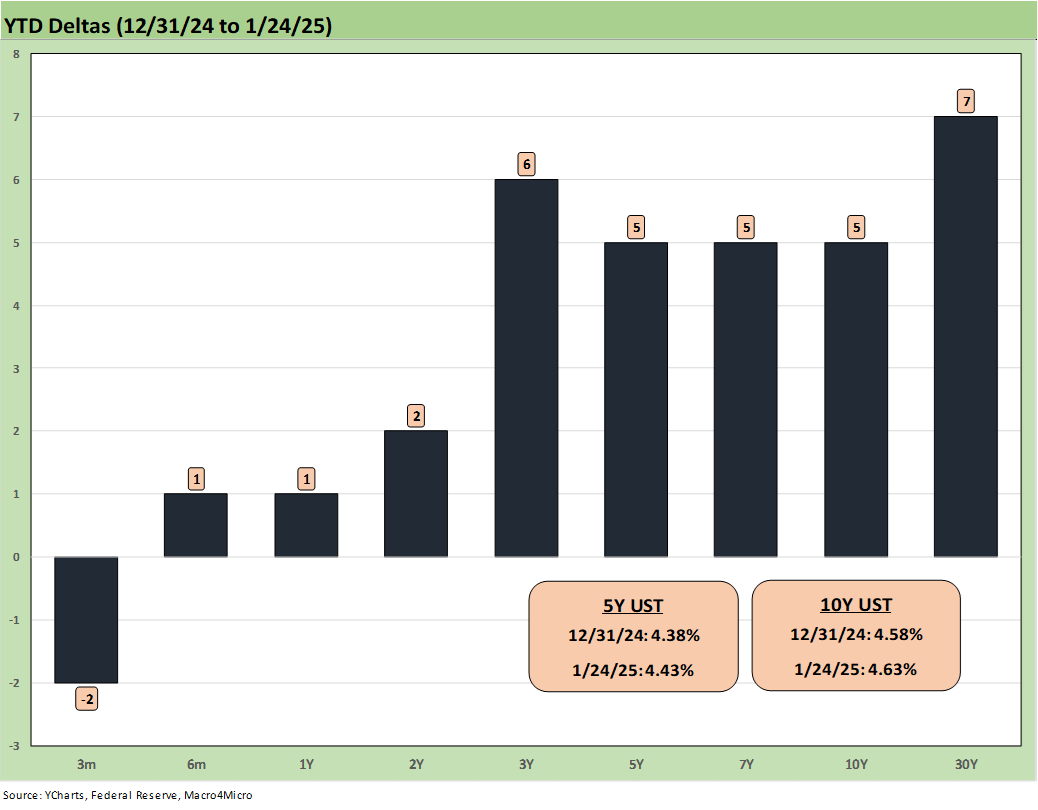
The above updates the YTD UST deltas since 12-31-24. The net movement along the UST curve YTD was minor and more like a mild day as the crow flies. There will be more volatile days ahead as the story unfolds and more data gets rolled into the market.
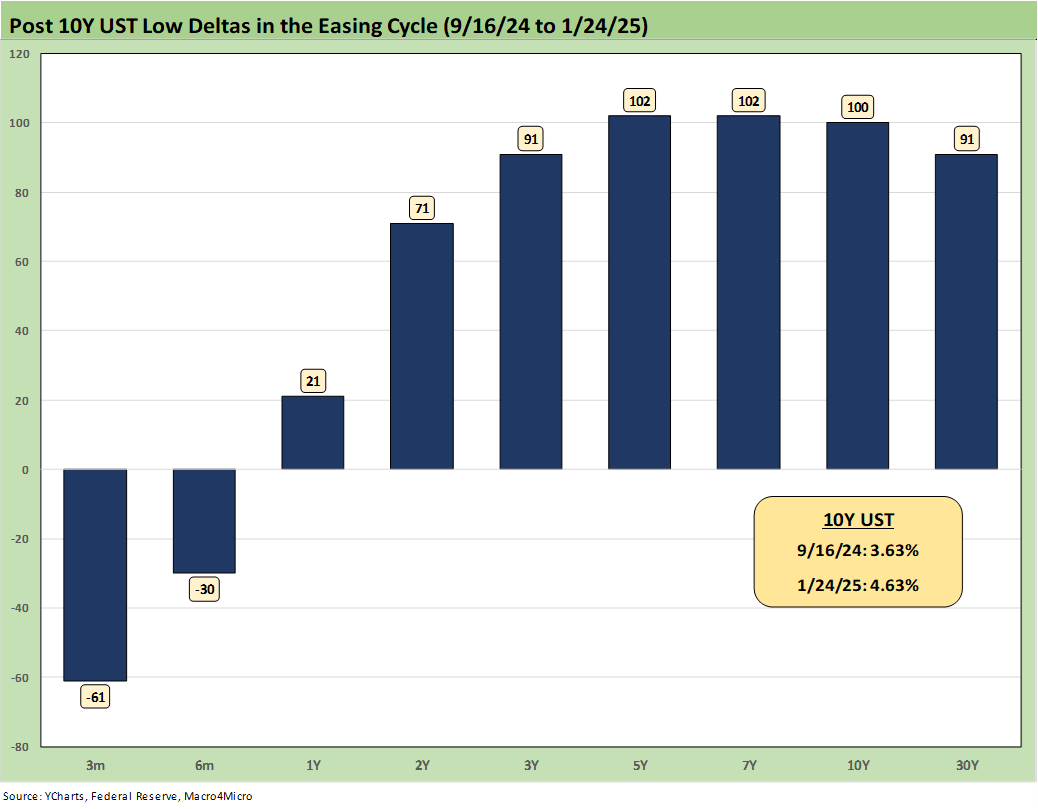
The UST deltas from the Sept 2024 low show a material rise and bear steepening in the few months since the easing cycle got underway. The factual economic aspects complicate the blame game since it is hard to say “I blame the prior guy for a strong economy” when you were claiming a depression was underway in Sept 2024 after the payroll report.
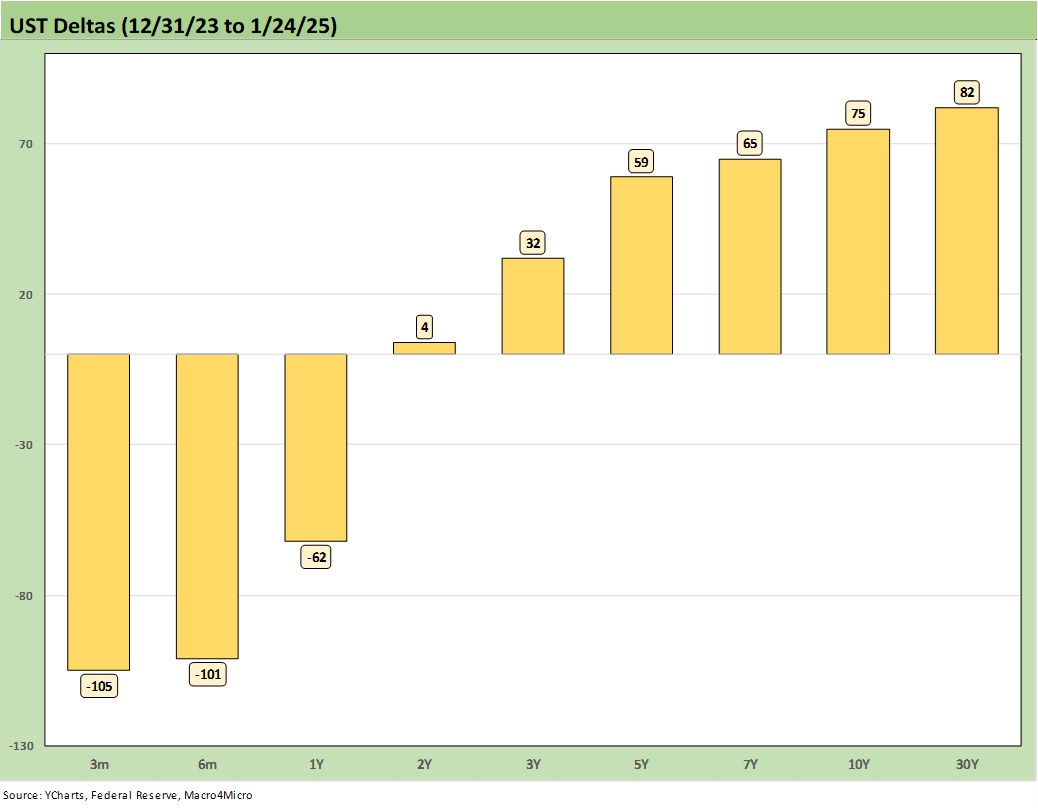
The above visual updates the UST deltas from the end of 2023. We see the benefits of the easing on the front end and the higher rates and steepening on the longer end beyond the 2Y UST.
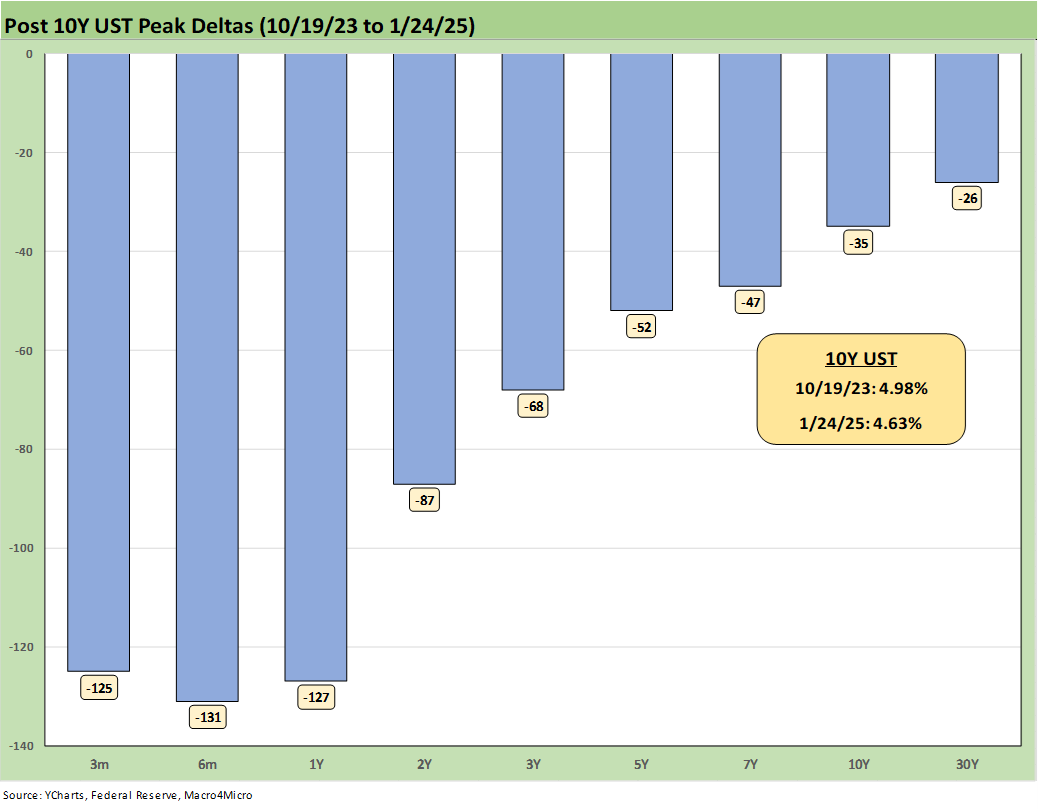
We will retire this chart at some point, but the above updates the running UST deltas from the 10-19-23 peak date on the 10Y UST. The Nov-Dec 2023 bull market rally in UST, credit spreads and equities was one for the ages (see Footnotes & Flashbacks: State of Yields 1-1-24, Footnotes & Flashbacks: Asset Returns 1-1-24). We are curious whether that 10Y UST and 30Y UST can whittle that post-10-19-23 UST delta back to zero. That is a realistic scenario under numerous moving parts as we await the sales pitch on the “frictionless wheel” of tariffs.
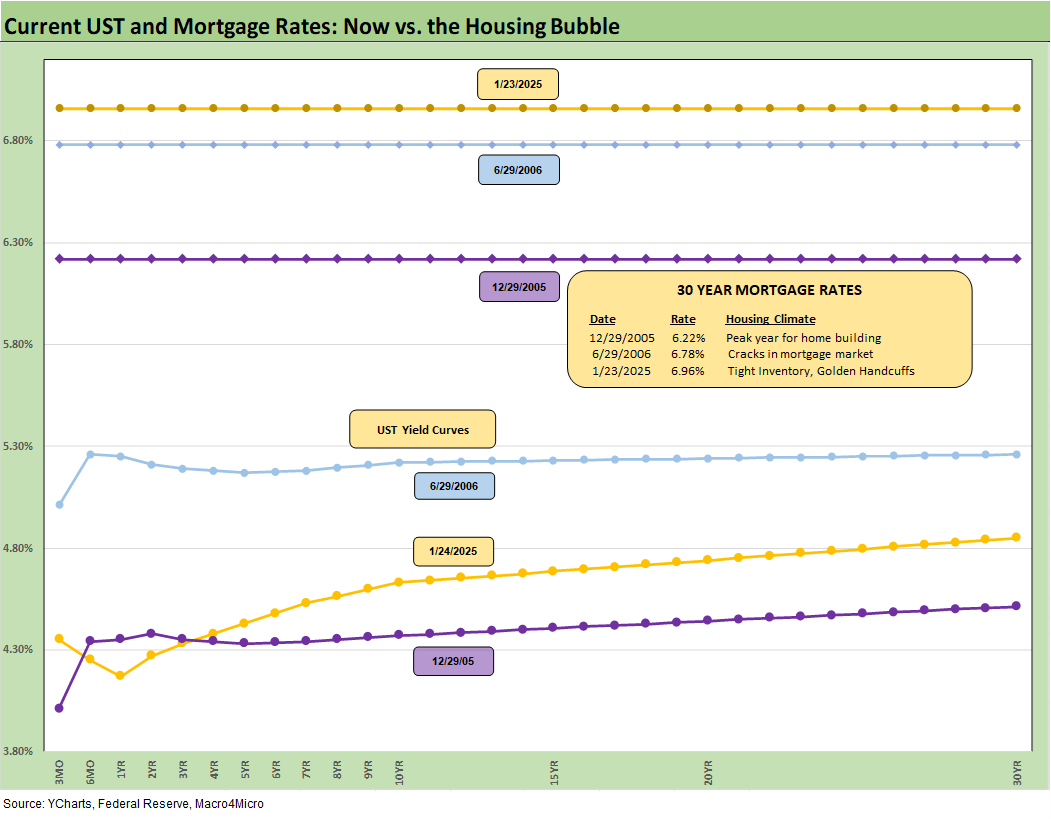
The above chart updates the Freddie Mac 30Y Mortgage benchmark (horizontal lines) and UST curves for the Friday close. We use two useful historical “macro comps” including the peak homebuilding year of 2005 (12-31-05) and mid-2006 period as the RMBS excess was starting to show signs of serious erosion.
The current Freddie Mac rate posts the highest mortgage rate on the chart despite a materially lower UST curve than June 2006. Mortgage spreads and the UST curve both will need to cooperate to get back to the 6.0% line. We have moved around in an almost 200 bps band since fall of 2023 on the 30Y mortgage rate (see Mini Market Lookback: Policy Blitz Formation 1-25-25).
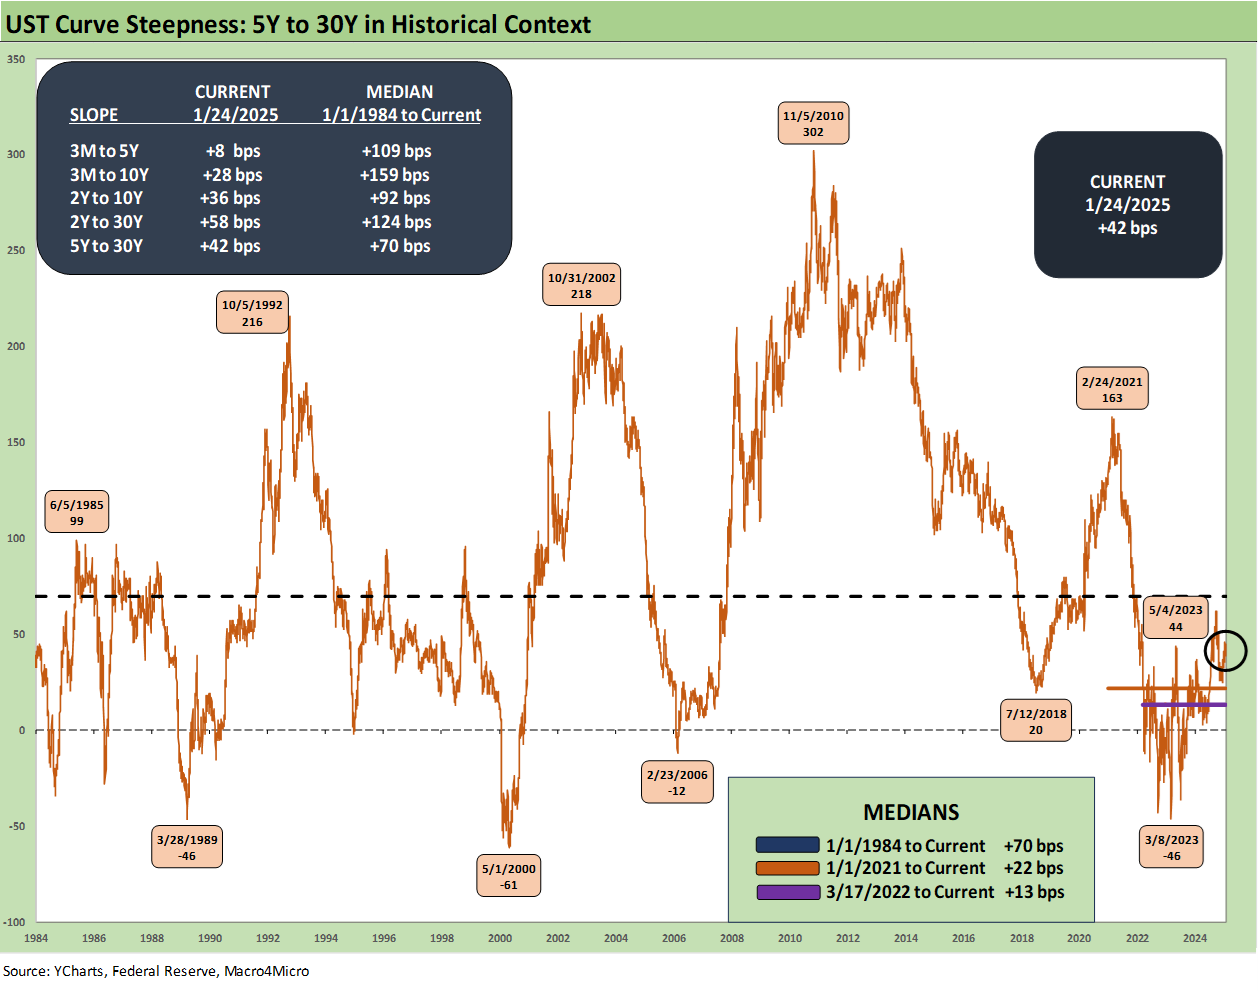
The above chart updates the 5Y to 30Y UST slope timeline for an updated look at the term premium in extension from 5Y relative to past cycles. The upward slope of +42 bps is getting closer to the long-term median of +70 bps after its peak inversion of -46 bps in March 2023.
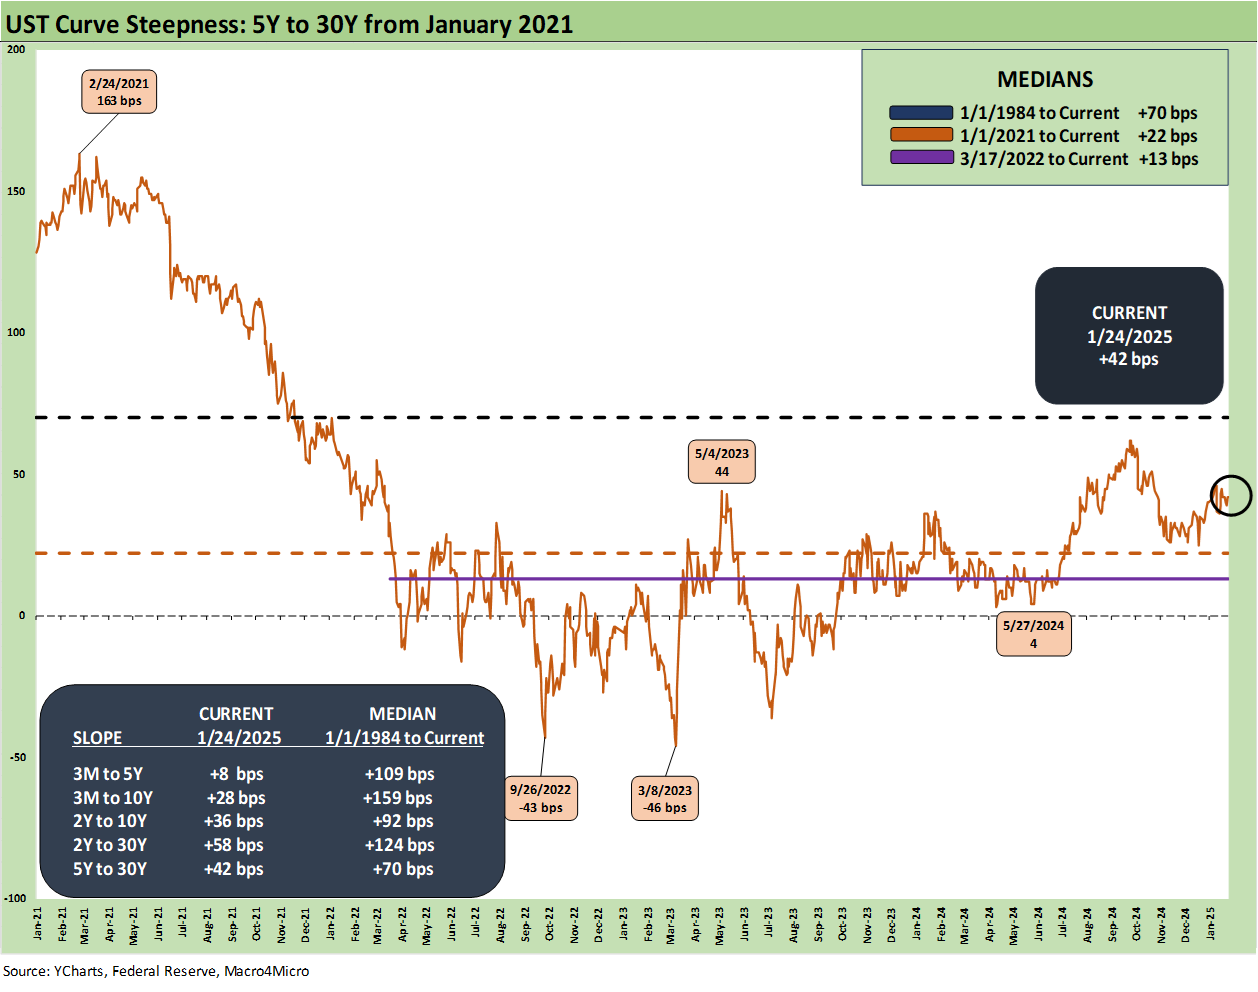
The above posts a shorter timeline for the 5Y to 30Y UST using the period from ZIRP to start 2021 on through the tightening cycle and then into the easing cycle. We see the peak slope of +163 bps in Feb 2021 on through the peak inversion of -46 bps in March 2023 (-43 bps in Sept 2022). In the end, the 5Y to 30Y is closer to its median than the other slopes detailed in the box.
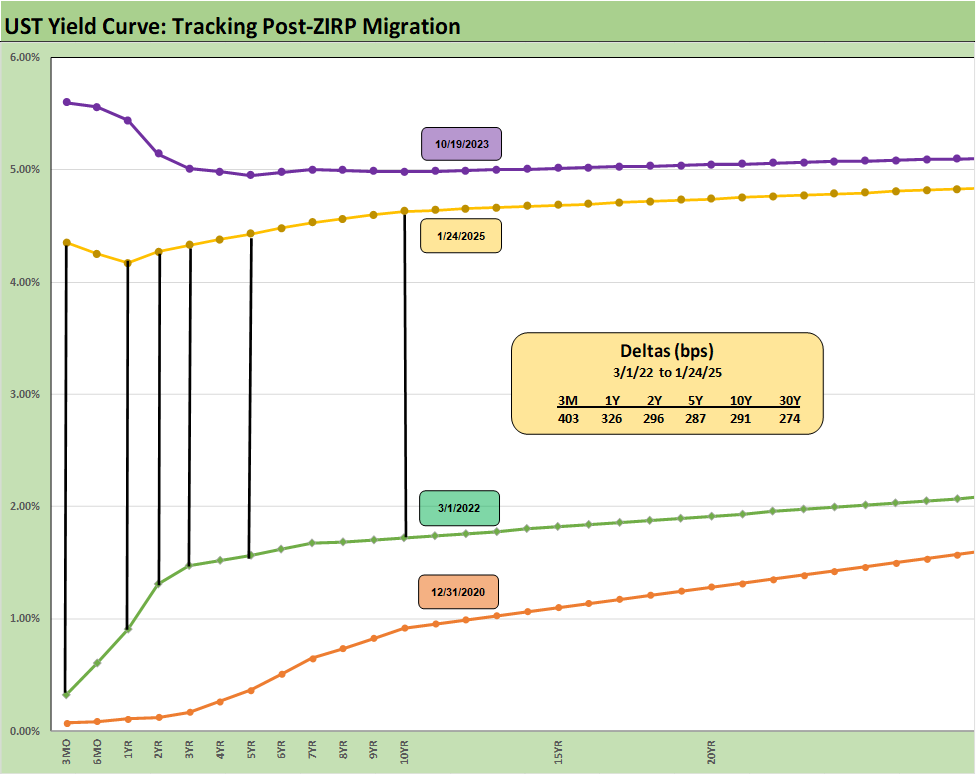
We wrap the UST delta chart from the March 2022 end of ZIRP on through the past Friday’s curve. We include the 10-19-23 UST curve when the 10Y UST peaked and the 12-31-20 UST curve as frames of reference.
See also:
Footnotes & Flashbacks: Asset Returns 1-26-25
Mini Market Lookback: Policy Blitz Formation 1-25-25
Existing Home Sales Dec 2024: Another “Worst Since” Milestone 1-24-25
Footnotes & Flashbacks: Credit Markets 1-20-25
Top 10 Fun Facts on Past Presidents and their Economies 1-20-25
Footnotes & Flashbacks: State of Yields 1-19-25
Footnotes & Flashbacks: Asset Returns 1-19-25
Mini Market Lookback: The Upside of Volatility 1-18-25
Industrial Production Dec 2024: Capacity Utilization 1-17-25
Retail Sales Dec 2024: A Steady Finish 1-16-25
CPI Dec 2024: Mixed = Relief These Days 1-15-25
KB Home 4Q24: Strong Finish Despite Mortgage Rates 1-14-25
United Rentals: Bigger Meal, Same Recipe 1-14-25
Mini Market Lookback: Sloppy Start 1-11-25
Payroll Dec 2024: Back to Good is Bad? 1-10-25
Payroll % Additions: Carter vs. Trump vs. Biden…just for fun 1-8-25
JOLTS: A Strong Handoff 1-7-25
Annual GDP Growth: Jimmy Carter v. Trump v. Biden…just for fun 1-6-25
Mini Market Lookback: Mixed Start, Deep Breaths 1-5-25
Tariff links:
US-Canada: Tariffs Now More than a Negotiating Tactic 1-9-25
Trade: Oct 2024 Flows, Tariff Countdown 12-5-24
Mexico: Tariffs as the Economic Alamo 11-26-24
Tariff: Target Updates – Canada 11-26-24
Tariffs: The EU Meets the New World…Again…Maybe 10-29-24
Trump, Trade, and Tariffs: Northern Exposure, Canada Risk 10-25-24
Trump at Economic Club of Chicago: Thoughts on Autos 10-17-24
Facts Matter: China Syndrome on Trade 9-10-24
Trade Flows: More Clarity Needed to Handicap Major Trade Risks 6-12-24
Trade Flows 2023: Trade Partners, Imports/Exports, and Deficits in a Troubled World 2-10-24
Trade Flows: Deficits, Tariffs, and China Risk 10-11-23