
JOLTS: A Strong Handoff
We look at Nov 2024 JOLTS numbers with the Dec payroll update teed up for Friday.


Smooth employment handoff is there for the taking…don’t drop it.
We see a solid 8.1 million Job Openings number down from the highs but remains well above the peak openings during the Trump 1.0 period of 7.5 million (Nov 2018).
Solid Job Openings attached to back-to-back 3% handle GDP quarters as economic growth obviously matters even in the AI age (see GDP 3Q24: Final Number at +3.1% 12-19-24, Annual GDP Growth: Jimmy Carter v. Trump v. Biden…just for fun 1-6-25).
The sequential uptick occurs even as the market awaits the reverberations of mass deportation and how that will flow into “Other Separations” with “mass deportation” not a usual category in the release.
The post-deportation openings in many services trades with lower pay scales could flow into the already sticky services inflation numbers that will get updated next week with the CPI release.
Layoffs and discharges were essentially flat in Nov vs. Oct while Hires and Quits both were down in a more guarded overall mix of numbers in the JOLTS release. Job Openings was the exception at the very high sustained run rate.
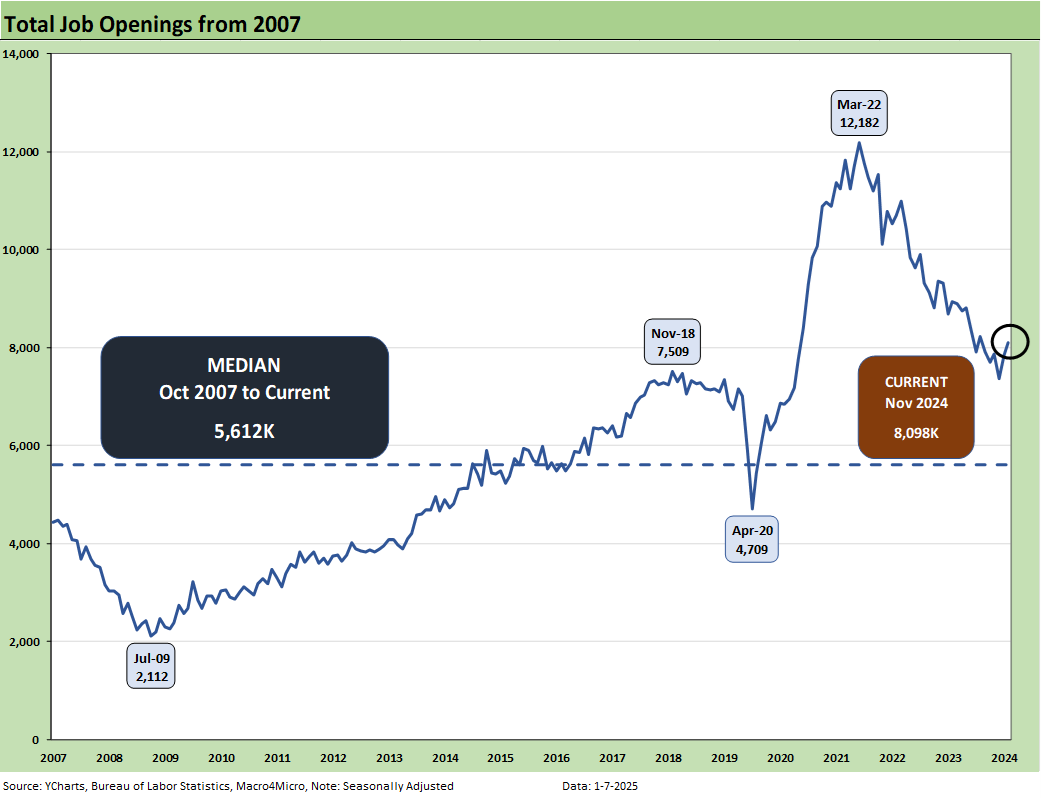
The Job Openings trend is clear enough as it climbed again and ticked back up above the 8 million threshold. We often see headlines that highlight the downdraft from the peak of 12.2 million in March 2022, but the commentary too often neglects to mention that jobs get filled and the openings go lower naturally.
It is a safe assumption that there would have been more openings for the taking without the inflation and tightening cycle, but the fact remains that openings remain well above the peak level of 7.5 million in Nov 2018 under Trump. That is a numerical fact.
From here, the dynamics of mass deportation and policy-created vacancies in the job ranks via mass deportation will make for an interesting period in interpreting the JOLTS trends. There is some moonwalking going on of late in deportation commentary in the upper ranks of Team Trump (“criminals only”), but the qualitative terms of “largest mass deportation in history” remains the mantra. The bid-offer range in magnitude has been 1+ million to 20 million along the way, so there is some room to maneuver.

The above chart plots Hires vs. Layoffs and includes the medians for each since 2007. We adjust the charts to remove the extreme COVID distortions that impair the visuals. Those are detailed in a box text chart further below. The Nov Hires total was very slightly above median while Layoffs/Discharges were very slightly above the median.

The Hires as a multiple of Layoffs/Discharges are flat to the long-term median around 3x. That is down from the peak of 5x in Nov 2021, in line with the Trump years and well above the late Bush period and most of the Obama years as hiring was working its way through the long trail back from the late 2008 systemic crisis.

The above updates the time series for Hires vs. Total Separations. Once the deportations begin in scale during 2025, these lines will be wild ones to watch as will every piece of the monthly JOLTS report. Using the catchphrase of “impaired comparability” in coming months would be quite an understatement as Trump fills in the policy details and releases the Kraken (Stephen Miller).

The above text box fills in some important COVID period statistics we exclude from the charts to make them more readable. Separations of over 16 million in March 2020 and almost 12 million in April 2020 rings the bell. The longer tail of multimillion hires includes over 8 million in May 2020 and over 7 million in June as part of a long climb back.

Hires minus Separations are now running below the long-term median but up sequentially from Oct, which posted less than 100K. That shows a leveling off in activity net of Separations. We would expect that this line would turn negative very quickly once the deportations shift into higher gear and the rate of hires lags.

The mix of Quits in the Separations numbers is shifting lower to 59.8% from the 73.1% peak in Apr 2022 but remains above the median. The classic “Quits rate” measure is Quits as a % of total employment. That metric declined sequentially to 1.9% from 2.1% in Oct on a SAAR basis. That is down from 2.2% in Nov 2023.
The theory is that such a trend shows less confidence in finding a job on the other side of the “quit.” That theory will be put to the test if deportation generates waves of openings. It will be a matter of pay scale tier and occupation.
See also:
Annual GDP Growth: Jimmy Carter v. Trump v. Biden…just for fun 1-6-25
Footnotes & Flashbacks: State of Yields 1-5-25
Mini Market Lookback: Mixed Start, Deep Breaths 1-5-25
Footnotes & Flashbacks: Credit Markets 2024 1-3-25
Footnotes & Flashbacks: Asset Returns for 2024 1-2-25
HY and IG Returns since 1997 Final Score for 2024 1-2-25
Spread Walk 2024 Final Score 1-2-25
Credit Returns: 2024 Monthly Return Quilt Final Score 1-2-25
Annual and Monthly Asset Return Quilt 2024 Final Score 1-2-25
HY and IG Returns since 1997: Four Bubbles and Too Many Funerals 12-31-24
Footnotes & Flashbacks: State of Yields 12-29-24
Mini Market Lookback: Last American Hero? Who wins? 12-29-24
Spread Walk: Pace vs. Direction 12-28-24
Annual and Monthly Asset Return Quilt 12-27-24
Credit Returns: 2024 Monthly Return Quilt 12-26-24
New Home Sales: Thanksgiving Delivered, What About Christmas? 12-23-24
Mini Market Lookback: Wild Finish to the Trading Year 12-21-24
Trump Tariffs 2025: Hey EU, Guess What? 12-20-24
PCE, Income & Outlays Nov 2024: No Surprise, Little Relief 12-20-24
Existing Home Sales Nov 2024: Mortgage Vice Tightens Again 12-19-24
GDP 3Q24: Final Number at +3.1% 12-19-24
Fed Day: Now That’s a Knife 12-18-24