
Mini Market Lookback: Sloppy Start
As good payroll news roiled the UST markets, we now await our next round of annexation plans.


A strong start from jobs reflects well on the health of the economy but it spills into a very divided set of results across equity, credit and duration. We get a fresh round of important data this coming week with CPI/PPI, Retail Sales, Industrial Production, and Housing Starts (see Payroll Dec 2024: Back to Good is Bad? 1-10-25). Next is a banner week for major bank earnings reports and some color on corporate and consumer credit quality that could be very useful.
New rounds of noise and nonsense colored the market dialogue this week with Canada, Panama, and Greenland annexation adding to the weirdness of the times as the market hunkers down for “Day 1” tariff and deportation decisions. Tariffs need to be factored into the forward view on inflation and margin pressure and consumer sentiment (and PCE) as many investors have taken the position of “call me when we get there” (see US-Canada: Tariffs Now More than a Negotiating Tactic 1-9-25).
The headline start to 2025 for the S&P 500 is “worst start since 2016” in a reference to a period when ZIRP had just ended, upstream E&P was in a freefall in high yield, and turmoil in China markets was a recent memory (summer and early fall of 2015). The year 2015 had just ended with negative excess returns in HY and IG with CCC tier names getting crushed in Dec 2015 and oil plunging again (see HY and IG Returns since 1997 Final Score for 2024 1-2-25, Annual and Monthly Asset Return Quilt 12-27-24).
The credit markets of early 2016 could not be more different from what we see today with a starkly different backdrop in HY credit markets hanging around multi-cycle spread lows in line with June 2007 and late 1997 (see Spread Walk: Pace vs. Direction 12-28-24, HY OAS Lows Memory Lane: 2024, 2007, and 1997 10-8-24).

The above details another bumpy week for large caps and small caps. The results show a continued weak start to the year for the S&P 500 with 8 of 11 index sectors posting negative returns but Energy having a good week, Healthcare positive, and Materials barely positive. Earnings forecasts for 2025 remain upbeat while many are still waiting to “solve for X” around the Trump game plan on tariffs, trade, his planned mega bill (now it is back to maybe two bills) covering tax cut extensions.
One of the worries around a “reconciliation” process is that Trump might seek to pump up tariff revenue in the numbers to execute on the extension of tax cuts and pay for border and deportation costs. That would entail “proving” the tariff revenue early and in size.
For the 1-week collection of the 32 benchmarks and ETFs we track each week, the score of 6-26 for positive vs. negative is a material move lower from the prior week’s 16-16. We see 2 negative return lines in the top quartile with all 7 bond ETFs in the red. The short duration UST 1Y-3Y ETF (SHY) made it into the top quartile with a negative return. The long duration UST 20+Y ETF (TLT) was down in the third quartile with -2.1% for the week.
The energy sector comprised 3 of the top 4 with E&P well ahead on the favorable oil price move. China had some favorable headlines for a change this week on commodities demand and that also pulled the Base Metals ETF (DBB) up into the top tier for the week. Midstream Energy (AMLP) is doing its usual income-driven cruise control with bullish infrastructure expectations and less exposure to pure commodity price volatility.
Health Care (XLV) had a rebound week despite RFK Jr still lurking in the shadows threatening to send large numbers of citizens to the morgue and pharma stocks to the emergency room.
We also see Transports (XTN) land in the top tier as Delta printed good numbers and posted a +9% stock day on Friday. Transport and freight and logistics broadly could be in for a wild and uncertain ride in 2025. We look forward to some guidance in 4Q24 earnings season on how companies are dealing with inventory planning and capex cycles ahead of Trump’s version of reality on tariffs (his “seller pays” pitch vs. “buyer pays” fact). The theories around preventive inventory building might get more visibility in earnings calls.
From here, the Trump 2.0 legislation handicapping is critical to how private sector capital budgets and pricing strategies will play out, so it is no small matter. The GOP control of the White House and Congress will bring a major bill (or bills) that will cut across taxes, the border, immigration/deportation, defense, and a range of major issues with material deficit impacts. The process is hardly new. We had it with Biden to start his term (post-COVID stimulus, climate, failure on Build Back Better), we had it in Trump 1.0 (Dec 2017 massive tax cut), and we saw a clear field in Obama 1.0 (ACA, Dodd-Frank).
Meanwhile, Trump believes he can do anything he wants on tariffs even without legislation as he has already demonstrated just by invoking national security. The headlines have already included potential plans to declare a national emergency which in turn opens up unlimited avenues for economic policy actions (whether lawyers agree on the topic or not).
In other words, the market is waiting for more facts and more specific action steps to assess valuation risks, inflation potential, industry-level effects on supplier chains and unit costs, budget realities and UST supply among other variables.

The above chart updates the tech bellwethers framed against some assorted benchmarks. They are listed in descending order of returns for the week. Only Meta and Alphabet made it into positive range this week. We detail 13 lines with 9 companies (Mag 7 + Broadcom + Taiwan Semi).
Tech always gets swept up in the “What’s my discount rate” derby in framing long-term forward valuation exercises. The theory is that rising rates should also pull back multiples. That debate will continue. The perversion of the UST curve fixation in equities is that some investors end up rooting for less favorable macro variables in the broader economy. Tariffs and trade clashes as policy priorities could deliver a weaker economy and higher inflation. That is too 1970s retro an outcome for many of us.
For YTD, we see 9 of the 13 in the red with Taiwan Semi and Meta leading the pack in the midst of a rough start to the year. The comparison of the S&P 500 to the “worst start since 2016” should also highlight that 2016 finished the year with very strong numbers and notably as oil pulled itself out of the depths. Small caps finished 2016 at over +21% and Midcaps at almost 21%, but that was a very different year coming off a slew of negative numbers in 2015 that included the Russell 2000 and Midcaps. NASDAQ was a decent performer vs. the pack in 2015 at +7.1%.
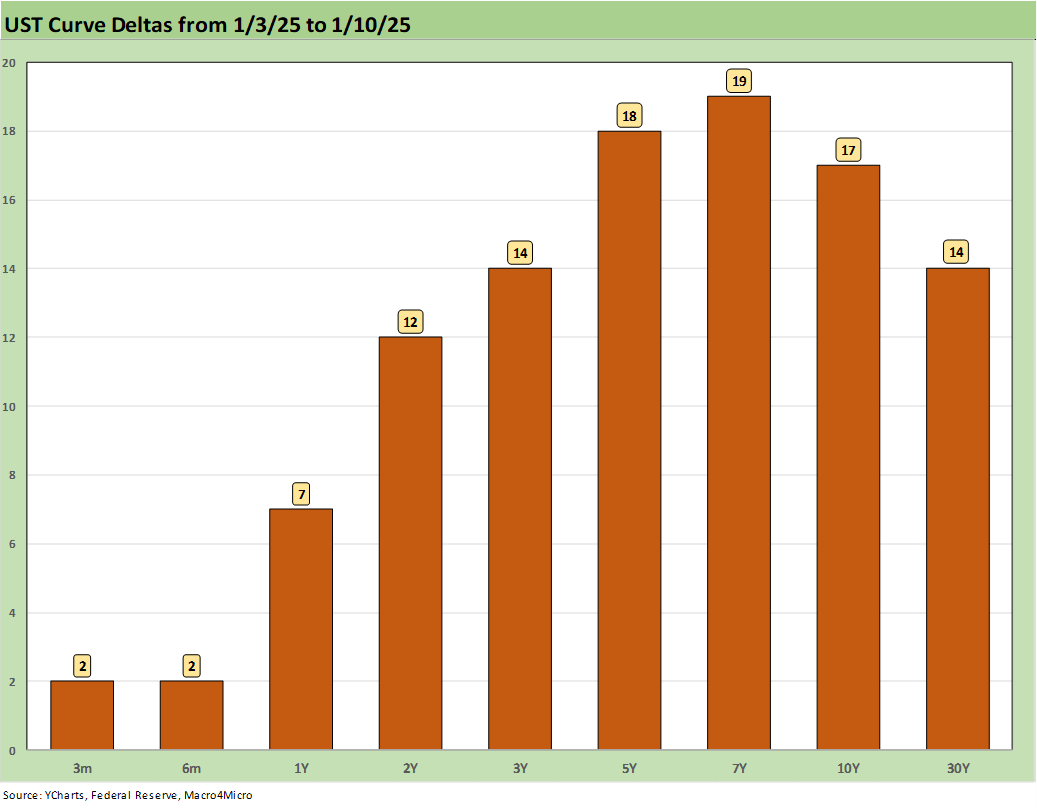
The above chart breaks out the UST deltas as the payroll surprise sent UST higher and continues the bear steepener trend beyond 2Y UST we have discussed across the 2024 setbacks for the duration bulls. We will update the curve collection in our weekly Footnotes publication on the State of Yields later this weekend (see Footnotes & Flashbacks: State of Yields 1-5-25).

The above chart plots the Freddie Mac 30Y mortgage rates vs. the 10Y UST. Freddie Mac gets set on Thursday at noon, so it missed the Friday payroll fun that hit the 10Y UST. While the Freddie Mac ticked higher to 6.93% on Thursday, the Mortgage News Daily composite moved above 7.2% with a different mix of mortgages.
We have some earnings reports coming this week (KB Home), so we can get some more color on the state of orders and demand expectations. For KBH, with its strong California presence, we could also get color on the rebuilding thoughts in light of the tragic and shocking fires across LA.

The above HY OAS chart underscores the HY bond market is not too worried about much at this point given the credit tier concentration and the industry and issuer mix in the HY bond universe.
The +281 bps HY index OAS was flat on the week despite all the curve noise. A strong jobs number should make HY bond owners with less duration exposure unfazed as they await the bigger risk variable determination ahead in Trump policies.
The distinctions across the term “credit markets” and “credit risk” will need to be more nuanced in 2025 given the explosive growth in private credit and growth of loan-only issuers in the private, small and midcap sectors. There are secular changes underway in the shifting asset allocation strategies on where to extract the best value for credit risk and total return for taking credit risk. That includes taking into account risk appetites, income needs, liquidity requirements, and the ability to staff and track portfolio exposures.
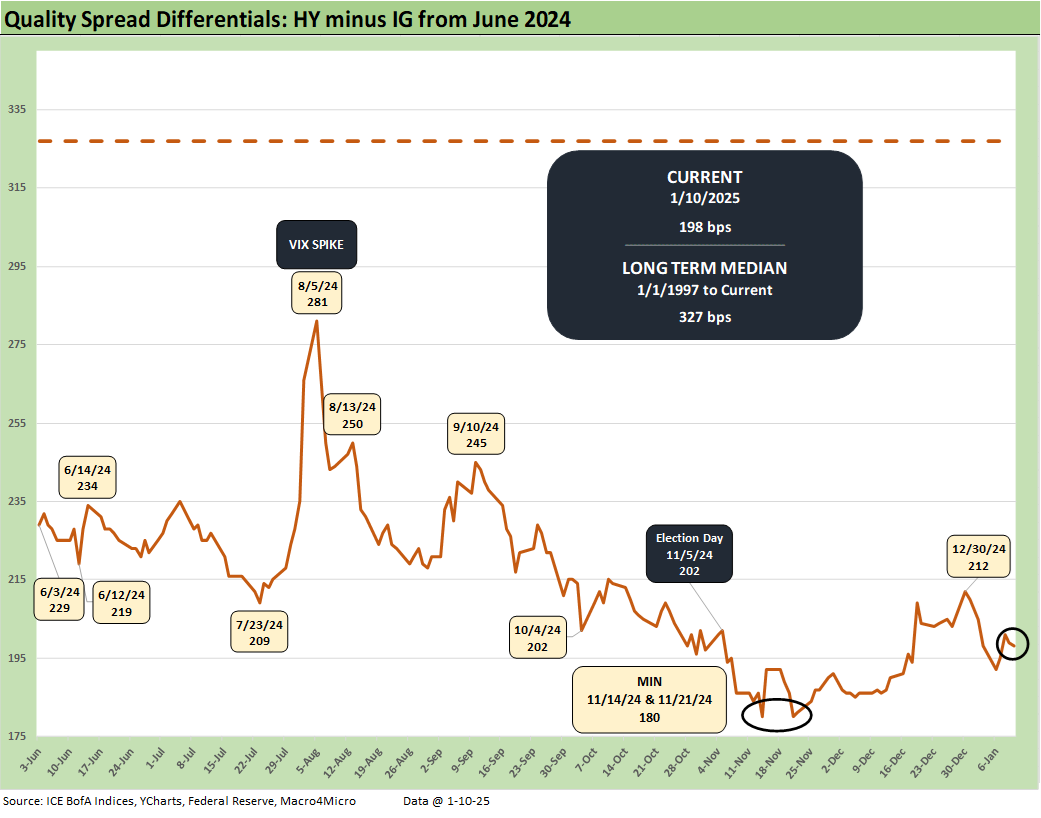
The “HY OAS minus IG OAS” quality spread differential was also flat at +198 bps for the week and holding in below the +200 bps line as we discuss in our Footnotes publication on Credit Markets each week (Footnotes & Flashbacks: Credit Markets 2024 1-3-25). We will post that updated credit markets commentary later. The differential remains a long way from the +327 bps median.

The “BB OAS minus BBB OAS” differential rounds out a boring week for HY spreads but at least it moved a little with the quality spreads -2 bps tighter to +72 bps as it hovers modestly above the Nov 2024 cyclical lows in the mid to upper 50 handle range seen in July and Nov 2024.
See also:
Payroll Dec 2024: Back to Good is Bad? 1-10-25
US-Canada: Tariffs Now More than a Negotiating Tactic 1-9-25
Payroll % Additions: Carter vs. Trump vs. Biden…just for fun 1-8-25
JOLTS: A Strong Handoff 1-7-25
Annual GDP Growth: Jimmy Carter v. Trump v. Biden…just for fun 1-6-25
Footnotes & Flashbacks: State of Yields 1-5-25
Mini Market Lookback: Mixed Start, Deep Breaths 1-5-25
Footnotes & Flashbacks: Credit Markets 2024 1-3-25
Footnotes & Flashbacks: Asset Returns for 2024 1-2-25
HY and IG Returns since 1997 Final Score for 2024 1-2-25
Spread Walk 2024 Final Score 1-2-25
Credit Returns: 2024 Monthly Return Quilt Final Score 1-2-25
Annual and Monthly Asset Return Quilt 2024 Final Score 1-2-25
HY and IG Returns since 1997: Four Bubbles and Too Many Funerals 12-31-24
Footnotes & Flashbacks: State of Yields 12-29-24
Mini Market Lookback: Last American Hero? Who wins? 12-29-24
Spread Walk: Pace vs. Direction 12-28-24
Annual and Monthly Asset Return Quilt 12-27-24
Credit Returns: 2024 Monthly Return Quilt 12-26-24
New Home Sales: Thanksgiving Delivered, What About Christmas? 12-23-24
Mini Market Lookback: Wild Finish to the Trading Year 12-21-24
Trump Tariffs 2025: Hey EU, Guess What? 12-20-24
PCE, Income & Outlays Nov 2024: No Surprise, Little Relief 12-20-24
Existing Home Sales Nov 2024: Mortgage Vice Tightens Again 12-19-24
GDP 3Q24: Final Number at +3.1% 12-19-24
Fed Day: Now That’s a Knife 12-18-24
Credit Crib Note: Iron Mountain 12-18-24
Housing Starts Nov 2024: YoY Fade in Single Family, Solid Sequentially 12-18-24
Industrial Production: Nov 2024 Capacity Utilization 12-17-24
Retail Sales Nov24: Gift of No Surprises 12-17-24
Inflation: The Grocery Price Thing vs. Energy 12-16-24
Toll Brothers: Rich Get Richer 12-12-24
CPI Nov 2024: Steady, Not Helpful 12-11-24
Mini Market Lookback: Decoupling at Bat, Entropy on Deck? 12-7-24
Credit Crib Note: Herc Rentals (HRI) 12-6-24