
Footnotes & Flashbacks: Asset Returns 1-26-25
We update running asset returns after Week 1 of Trump 2.0 as tariffs and deportation are still badly in need of details.


Policy releases continue to rain down…
A very favorable balance of positive returns were seen this past week. We see the debt benchmarks we track all positive for the trailing 1-month timeline from all negative 2 weeks ago. The equity benchmarks we watch swung from all-negative for the trailing 1-month 2 weeks ago to 4 of 6 positive with this update.
With a “flood the zone” political headline strategy likely to remain at the level of a high-volume scream, this week brings the release of the 4Q24 GDP advance estimate, an FOMC meeting, and the PCE release (inflation, income, outlays).
The Mag 7 and tech-centric assets posted respectable numbers with some breadth in the results as small caps and industrials were solid after the bank and finance peak reporting period.
The earning season now rolls into a broader array of industry groups with 4 of the Mag 7 also reporting this week (ex-NVDA, ex-Alphabet. ex-Amazon). Critical bellwether names and subsectors such as CAT, GM, Boeing, Lockheed (plus RTX, LHX, NOC), various freight/logistics operators (including UPS), some major homebuilders (Pulte, NVR) are among key names for guidance watchers.
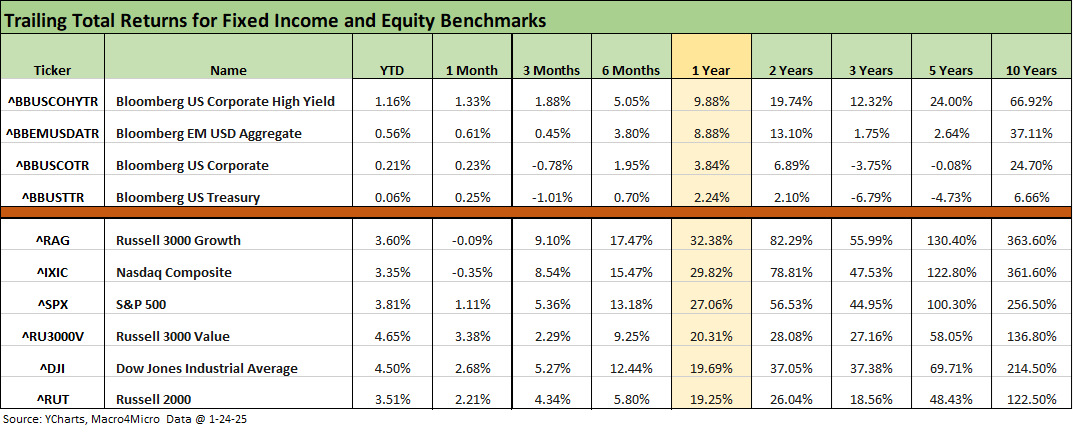
The above chart updates the high-level benchmarks we like to track each week across a range of timelines. The mix of positive returns shifted higher again this week for YTD and trailing 1-month.
Equity returns for YTD as detailed above posted 3% and 4% handles while 2 weeks ago the shorter YTD and the trailing 1-month period were both all negative in equities. For debt, the YTD and 1-month are both all positive above. Two weeks ago, the YTD start to 2025 saw all negative while the trailing 1-month period posted 3 of 4 in negative range with HY barely positive.
After a rough stretch in Dec 2024 for the UST curve, the UST volatility of Jan 2025 has been easier on total returns. The 10Y UST and bear steepener since the Sept 2024 lows included a near 100 bps unfavorable delta that has weighed on bond returns (see Mini Market Lookback: Policy Blitz Formation 1-25-25). We will look at those numbers in more detail in our Footnotes publication on the State of Yields that will be posted later today.
The rolling return visual
In the next section, we get into the details of the 32 ETFs and benchmarks for a mix of the trailing periods. Below we offer a condensed 4-chart view for an easy visual on how the mix of positive vs. negative returns shape up. This is a useful exercise we do each week looking for signals across industry groups and asset classes. We also have a YTD version that we include in the broader commentary on the time horizons further below.
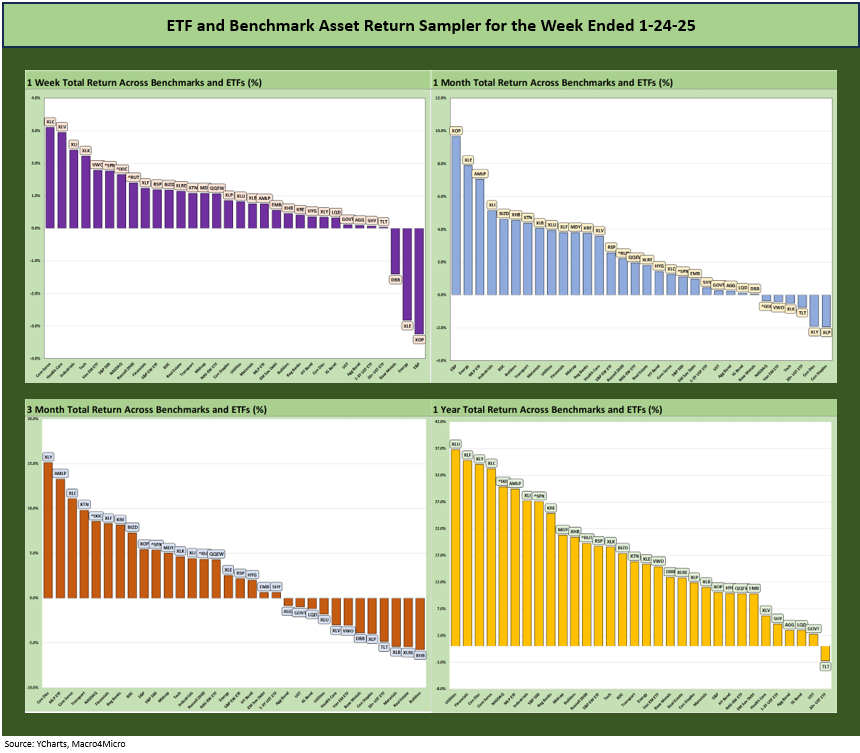
The above chart shows clearly positive symmetry for 1-week, 1-month, and LTM with a modestly favorable 3 months that included a rough Dec 2024 (see Footnotes & Flashbacks: Asset Returns for 2024 1-2-25).
As we cover in the various year end reviews (see Annual and Monthly Asset Return Quilt 12-27-24, Credit Returns: 2024 Monthly Return Quilt 12-26-24), the markets are coming off two banner years in equities and steady relief in inflation metrics since the mid-2022 peak and brief period of recession fears in the fall of 2022 (see Unemployment, Recessions, and the Potter Stewart Rule 10-7-22). Credit markets remain down in the June 2007 range for spreads (Spread Walk: Pace vs. Direction 12-28-24).
The Magnificent 7 heavy ETFs…
Some of the benchmarks and industry ETFs we include have issuer concentration elements that leave them wagged by a few names. When looking across some of the bellwether industry and subsector ETFs in the rankings, it is good to keep in mind which narrow ETFs (vs. broad market benchmarks) get wagged more by the “Magnificent 7” including Consumer Discretionary (XLY) with Amazon and Tesla, Tech (XLK) with Microsoft, Apple, and NVIDIA, and Communications Services (XLC) with Alphabet and Meta.
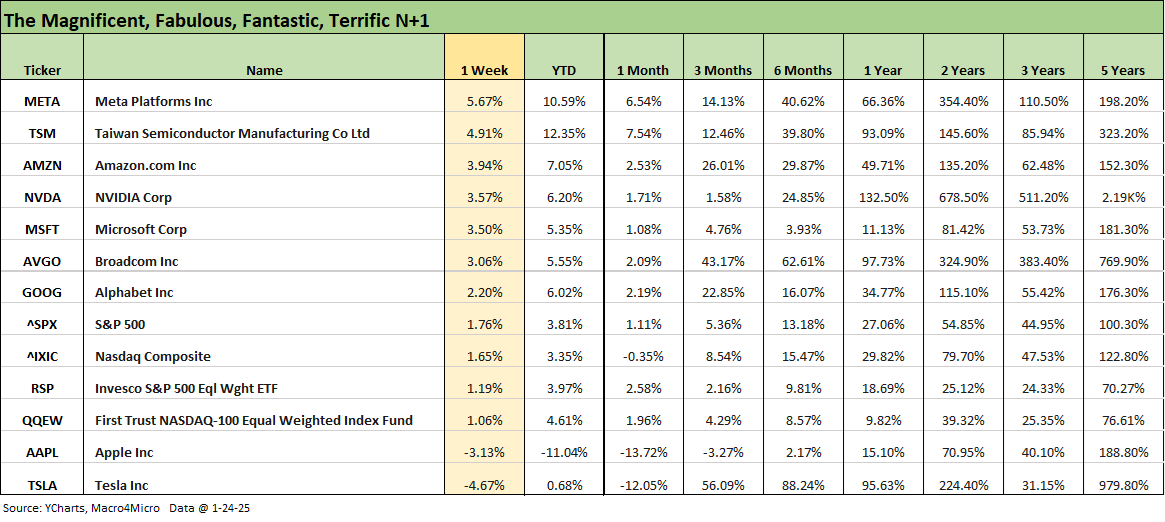
We looked at the details of the tech bellwethers in our earlier Mini Lookback (see Mini Market Lookback: Policy Blitz Formation 1-25-25). In terms of the correlation with the UST action, the Mag 7 growth stories get swept up in the inevitable discount rate debates on valuation and how that ties into longer term rates, but the main event is still revenue and earnings growth. We will see 5 of the 7 report this week as noted earlier.
We see an increasing focus on the tech bellwether capex plans that are now reaching mind-boggling numbers. An interesting angle for the credit and equity markets alike will be what these massive-market-cap bellwethers do with their balance sheets to drive spending faster and front-load funding. That is for another day.
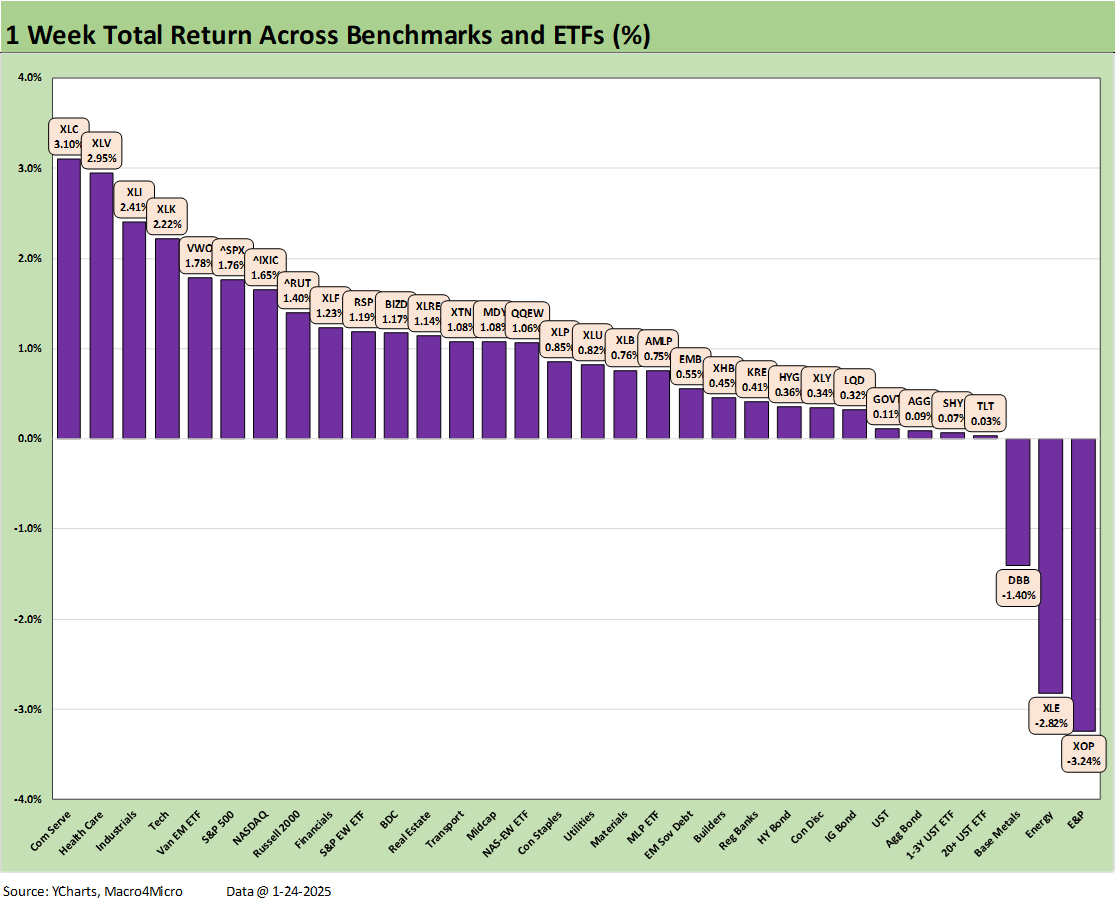
We looked at the 1-week numbers in some detail in Mini Market Lookback: Policy Blitz Formation (1-25-25), and the score of 29-3 underscores a very good week after a 32-0 shutout last week following a more mixed start to the year.
The real action starts when the tariff game plan and specific details get out on the playing field. Looking back at 2018-2019, there were more than a few economist and Trump supporters who felt he undid all the good of his record tax cuts in Dec 2017 by getting caught up in tariffs in 2018-2019. The theory goes that if he had just done the tax cut and went on a 3-year MAGA rally and skipped the tariffs he would have been President in 2020 (as opposed to losing by 7 million votes). He would never have been an insurrectionist election denier and would have been the Presidents’ Hall of Fame. Under that scenario, he would have missed all the Lysol dramas and less-then-inspiring scientific commentary in his almost daily COVID press conferences. He just could not help himself.
There may be a few fearful supporters now (just quieter now) who might feel the same way today in terms of what it might all mean in midterms. Some of his supporters might not remember that the USMCA plan that he is criticizing so vehemently right now was, in fact, Trump’s plan. I was following it closely and the take-it-or-leave-it nature of the process makes it hard to blame anyone else. That is why he changed the name from NAFTA to USMCA. He owns it.
There is a very high risk of the USMCA deal getting scrapped entirely in the current year. Alternatively, there is a scheduled 2026 review process built into the deal. That is a story for another day (see tariff and trade links at the bottom). The Congressional Research Service did a recent update on the USMCA.
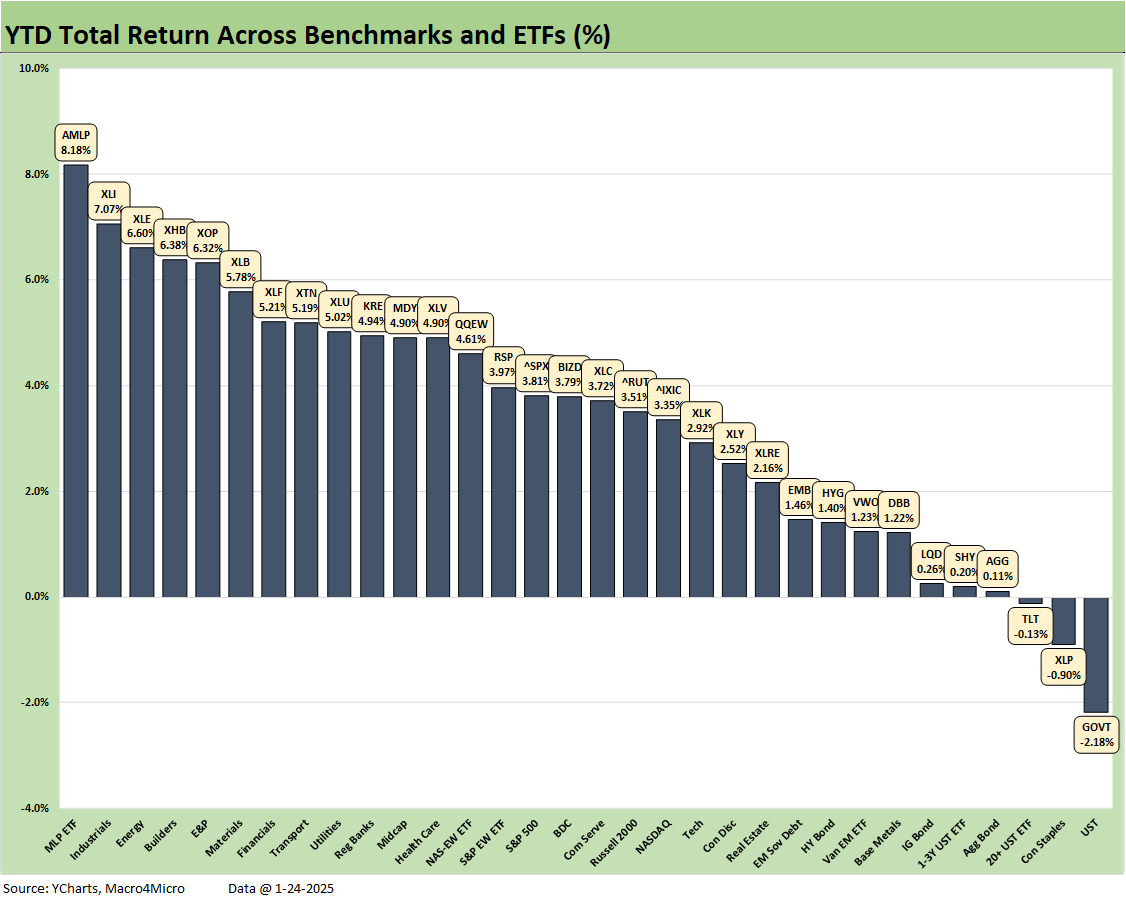
The YTD numbers have been solid with the recent rally posting a YTD score of 29-3 with Duration the loser (TLT, GOVT) and lower yielding income stocks such as Consumer Staples (XLP) still struggling. For the LTM period detailed further below, the GOVT and TLT ETFs hold the bottom two slots. The Consumer Staples ETF (XLP) was in the lower half of the third quartile LTM and third to last among equity ETFs (vs. bond ETFs).
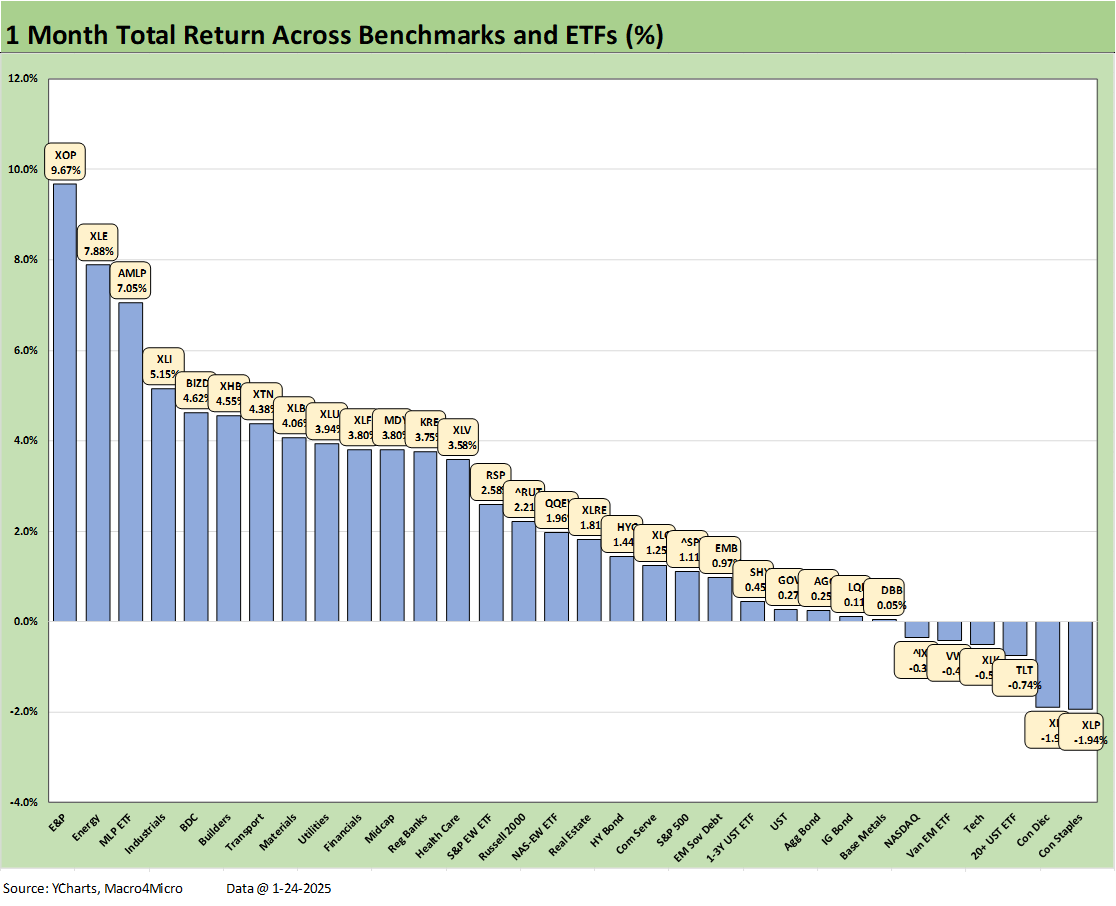
The trailing 1-month score was 26-6 with energy holding down the top 3 slots. The top quartile shows some diversity and notably with no tech-centric names. We see Industrials (XLI) at #4, the income-heavy BDCs (BIZD) at #5, Homebuilders making a small comeback after the beatdown of 4Q24, and Transports (XTN) riding good airline performance.
We see Materials (XLB) rounding out the bottom of the top quartile. XLB is climbing out of the pit that it has been mired in for the trailing 3 months. For the trailing 3 months, XLB ranks third to last just ahead of Real Estate (XLRE) and Homebuilders (XHB). The migration of the UST curve will hold the key for those 3 lines.
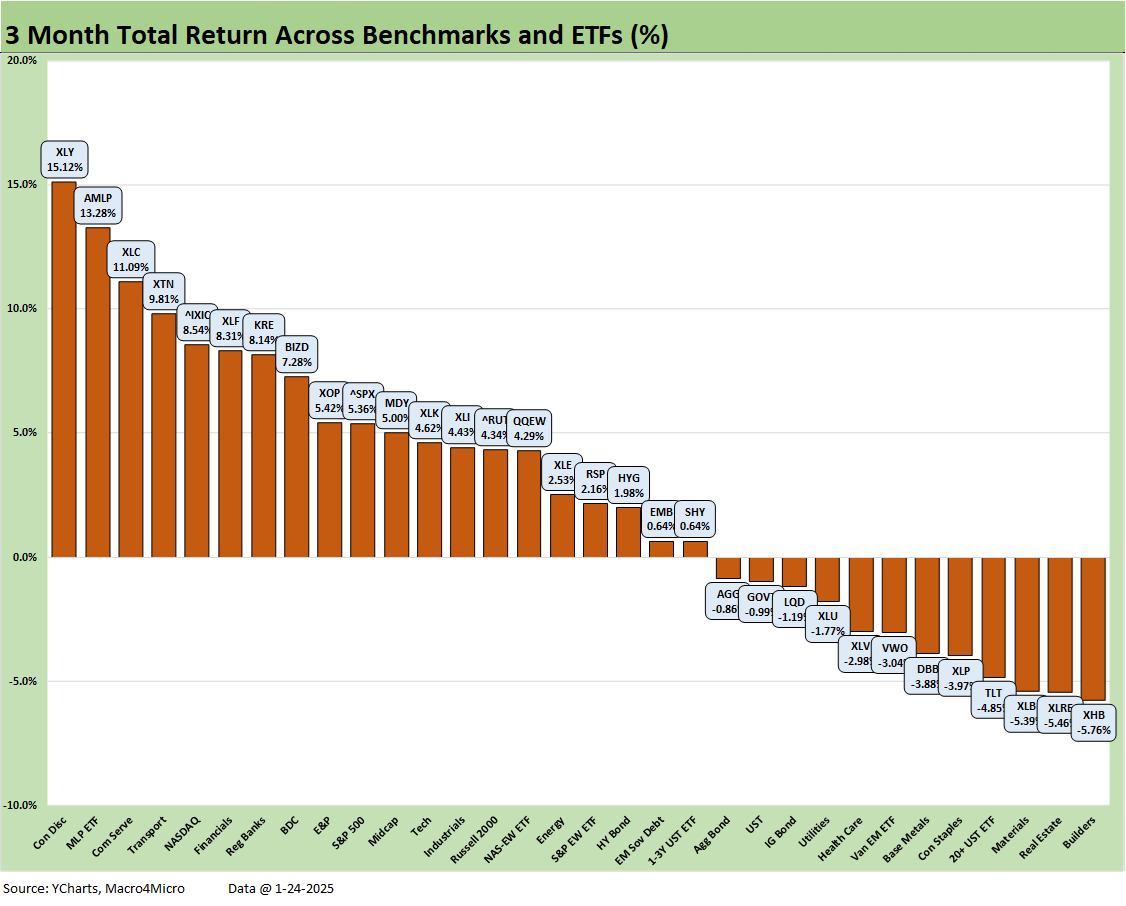
The 3-month score weighs in at 20-12 as UST and a curve steepening took its toll on rate- sensitive sectors such as Homebuilders (XHB), Real Estate (XLRE), high quality income stocks such as Consumer Staples (XLP), Utilities (XLU), and bond ETFs. We also see Base Metals (DBB) and EM Equities (VWO) feeling the effects of China nerves.
Bond ETFs were 4 of the negative lines (TLT, LQD, GOVT, AGG) with HY (HYG), EM Sovereign bonds (EMB), and short UST ETF (SHY) at the bottom of the positive returns.
The top tier for 3 months was big on Mag 7 heavy ETFs (XLY, XLC) and NASDAQ. We see top quartile placements for financials (XLF, KRE) along with high dividend payers (AMLP, BIZD) with Transports (XTN) riding the major airlines and some cyclical optimism
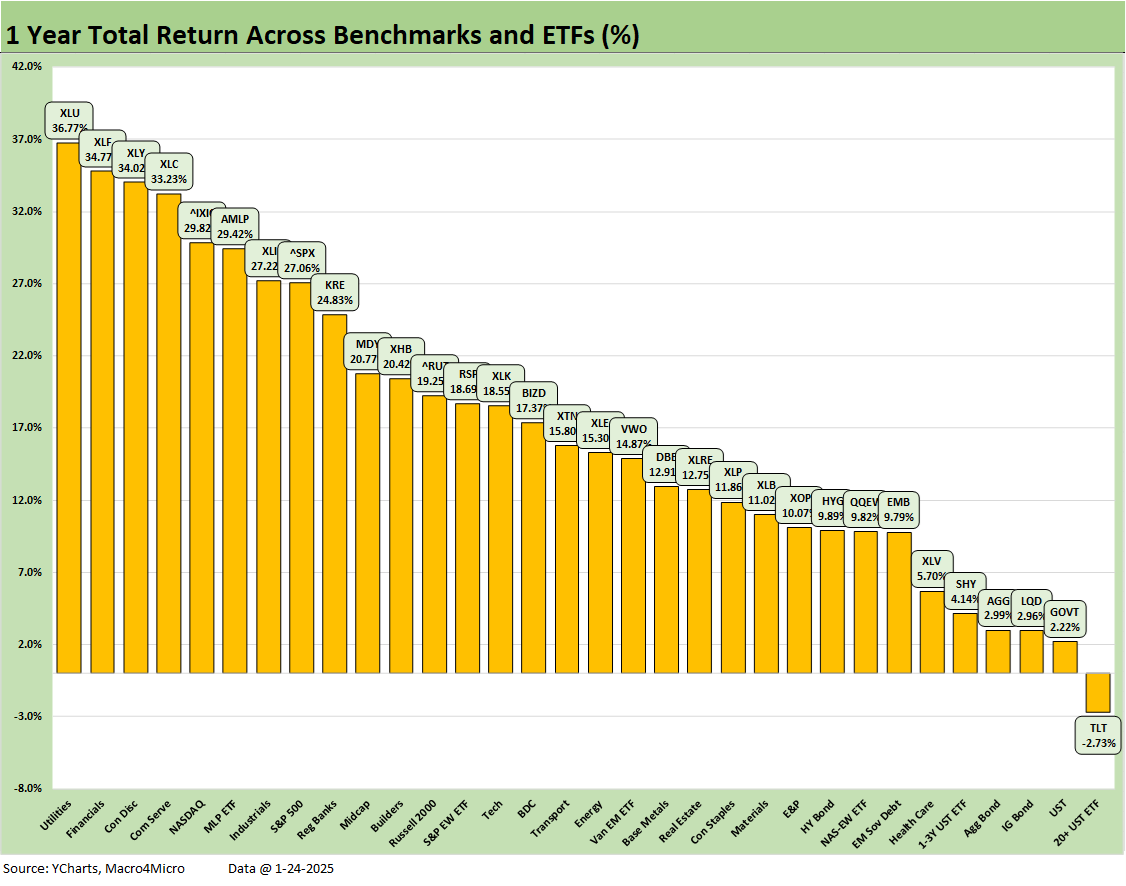
.The trailing 1-year score of 31-1 has been steady with the long duration UST 20+Y ETF (TLT) still the only line in the red with the big rally months of Nov-Dec 2023 now out of the LTM numbers. We see the bottom 5 comprised of bond funds with the two higher risk bond ETFs (HYG, EMB) a few notches above.
The top quartile shows some attractive diversification with Utilities at #1 (XLU) followed by Financials (XLF) at #2. Then comes the Mag 7 influence with Consumer Discretionary (XLY) at #3 and Communication Services (XLC) at #4 followed by NASDAQ #5 with the Mag 7 heavy S&P 500 at #8. Midstream Energy (AMLP) and Industrials (XLI) squeezed in between NASDAQ and the S&P 500. That is a good lineup, for where the market stands right now. The policy ingredients could complicate that set of macro variables.
See also:
Mini Market Lookback: Policy Blitz Formation 1-25-25
Existing Home Sales Dec 2024: Another “Worst Since” Milestone 1-24-25
Footnotes & Flashbacks: Credit Markets 1-20-25
Top 10 Fun Facts on Past Presidents and their Economies 1-20-25
Footnotes & Flashbacks: State of Yields 1-19-25
Footnotes & Flashbacks: Asset Returns 1-19-25
Mini Market Lookback: The Upside of Volatility 1-18-25
Industrial Production Dec 2024: Capacity Utilization 1-17-25
Retail Sales Dec 2024: A Steady Finish 1-16-25
CPI Dec 2024: Mixed = Relief These Days 1-15-25
KB Home 4Q24: Strong Finish Despite Mortgage Rates 1-14-25
United Rentals: Bigger Meal, Same Recipe 1-14-25
Mini Market Lookback: Sloppy Start 1-11-25
Payroll Dec 2024: Back to Good is Bad? 1-10-25
Payroll % Additions: Carter vs. Trump vs. Biden…just for fun 1-8-25
JOLTS: A Strong Handoff 1-7-25
Annual GDP Growth: Jimmy Carter v. Trump v. Biden…just for fun 1-6-25
Mini Market Lookback: Mixed Start, Deep Breaths 1-5-25
Tariff links:
US-Canada: Tariffs Now More than a Negotiating Tactic 1-9-25
Trade: Oct 2024 Flows, Tariff Countdown 12-5-24
Mexico: Tariffs as the Economic Alamo 11-26-24
Tariff: Target Updates – Canada 11-26-24
Tariffs: The EU Meets the New World…Again…Maybe 10-29-24
Trump, Trade, and Tariffs: Northern Exposure, Canada Risk 10-25-24
Trump at Economic Club of Chicago: Thoughts on Autos 10-17-24
Facts Matter: China Syndrome on Trade 9-10-24
Trade Flows: More Clarity Needed to Handicap Major Trade Risks 6-12-24
Trade Flows 2023: Trade Partners, Imports/Exports, and Deficits in a Troubled World 2-10-24
Trade Flows: Deficits, Tariffs, and China Risk 10-11-23