
Inflation Timelines: Cyclical Histories, Key CPI Buckets
We look back across the cycles for some additional historical perspective on the major inflation lines vs. today.


We look at some long-term trend lines for a cross-section of important CPI line items since the early 1970s for a range of CPI metrics.
Headline vs. Core CPI and the related differentials are part of an old debate on what matters, but we break out the stand-alone history of energy and food inflation for frames of reference.
With Shelter being such a critical variable at over 1/3 of the total CPI index, we look back at CPI ex-shelter across the cycles index in a market where the shelter index is overstated and confuses the true economic impact from shelter inflation.
Services ex-Energy vs. Commodities ex-Energy (BLS speak for “Goods”) tells a story for how Goods are stacking up against Services with the worry being high Services inflation is hard to curb in an expanding services economy.
In this commentary, we wanted to frame some slices and dices of the CPI history across some major CPI index components. The purpose is to offer historical inputs on inflation – a topic that has dominated market headlines since 2022. Inflation as the key variable has been reinforced by recent UST action and market performance. Inflation also will be an overriding part of the political discourse in 2024, so knowing more beats knowing less. That is, unless you work in Washington when repeating yourself over and over (regardless of facts) is the main practice. The latter approach is certainly less time-consuming.
When we first started posting articles last fall, the desire to dive into the inflation topic was first on the list. As someone who was studying economics in college during the second half of the stagflation years, the memory lane effect was anything but nostalgic. I arrived in NYC in June 1980 after I graduated to a 22% Misery Index (the record high) that same month. The 1980-1982 double dip recession was well underway.
The CPI component lookbacks…
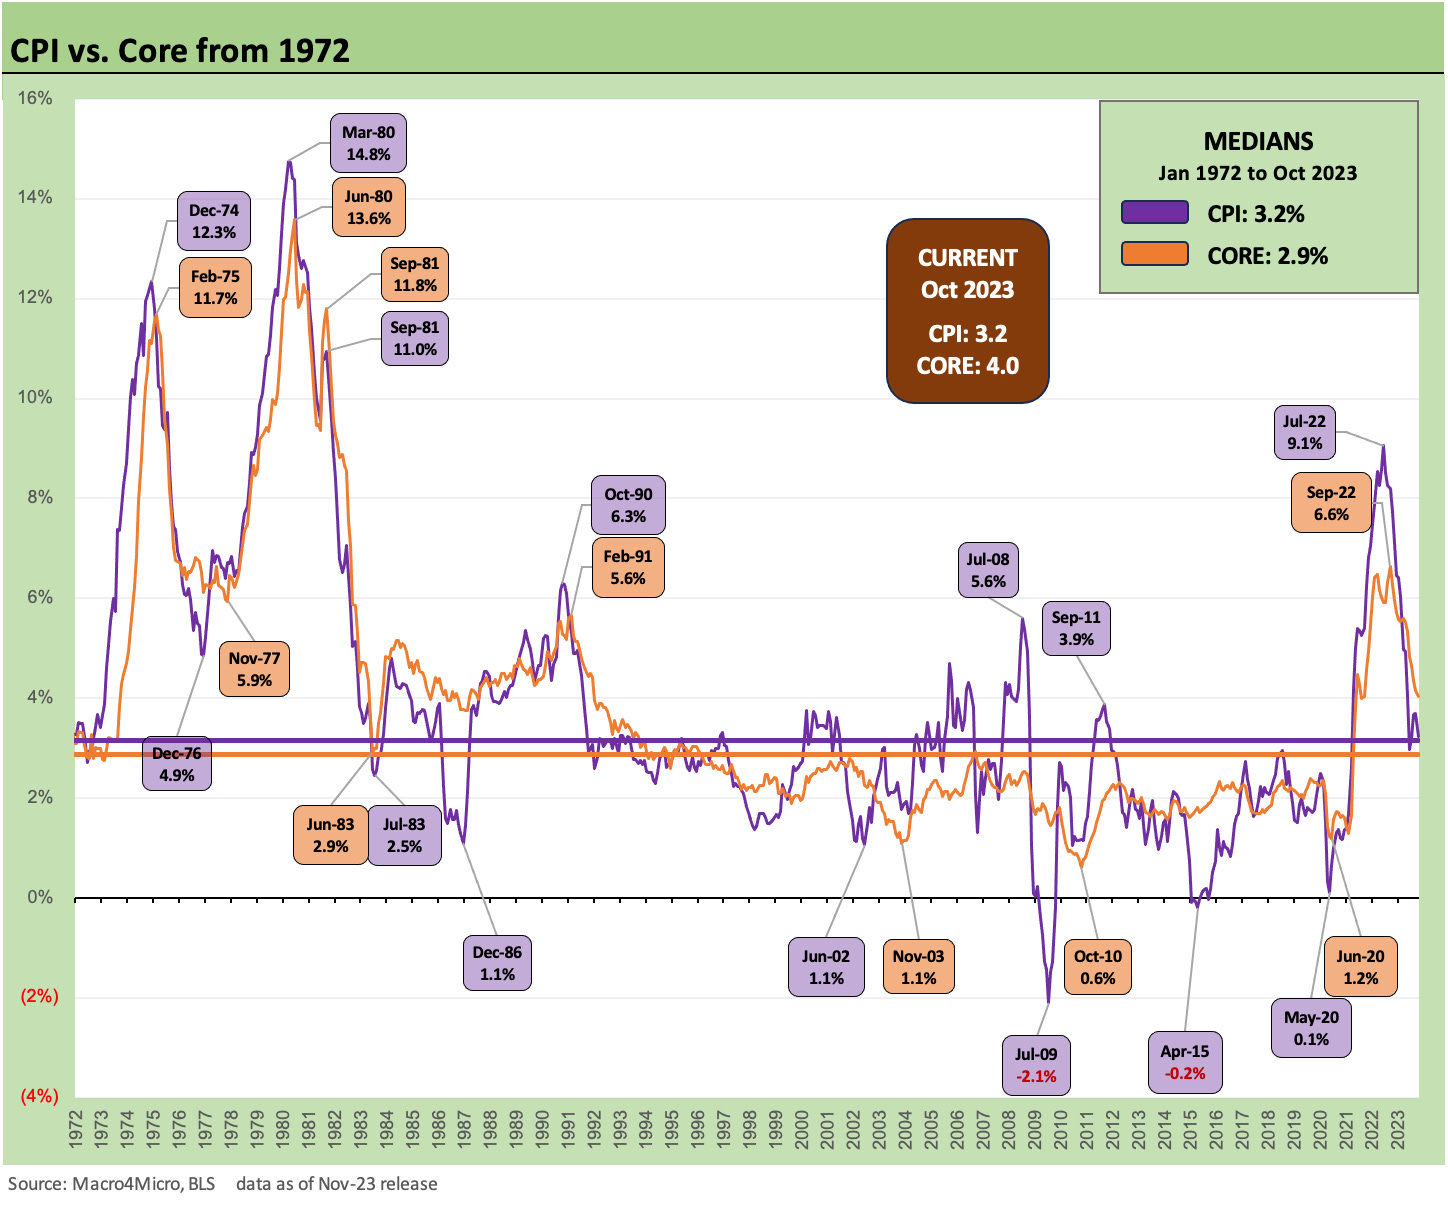
We post the Headline CPI vs. Core CPI history above, but that is not the main focus of this piece. We see the long term median of 3.2% on CPI – the same as the Oct 2023 rate – and 2.9% for Core CPI, wish is below the current 4.0%. The CPI vs. Core relationship has been the recurring topic as we highlight in the Macro4Micro links at the bottom of this commentary. Our primary focus initially was the relationship of fed funds to CPI and PCE, which were decidedly negative to start the tightening cycle in 2022 as inflation was high but fed funds low (even if rising).
As we highlighted at the time back in 2022, the Volcker playbook was for fed funds to be well in excess of inflation even if initially fed funds swung around quite dramatically on the strategy of locking in on supply across the monetary aggregates. During 2022, that was not the case at all in the Powell FOMC (or they did not admit it was). Market watchers were calling for pauses and cuts at a time of negative real fed funds. The threat to bond asset allocation was the steady rise on short rates would take duration along for the ride.
With one exception, the times series collection we look at herein are plotted from the start of 1972, the year before the inflation gods cursed the US market with an oil embargo to go with the post-Vietnam inflation pressures already underway. The one exception is the Shelter line, which we look at later in this note. That time series starts during 1983.
The Shelter inflation methodology was radically overhauled by 1983, so the CPI ex-Shelter time series begins when the BLS and the economic think tanks and professor types feeding them came up with the new methodology that we see today.
From 1983, the terms such as Owners’ Equivalent Rent then ruled the measurement system rather than the traditional use of home prices and related mortgage financing costs (and property taxes, maintenance, and repair etc.). With Shelter at 34.8% of the CPI index, the treatment of Shelter is no small matter. The Owners’ Equivalent Rent piece by itself was 25.7% of the index as of the Oct 2023 release. We will get to the shelter chart and topic last on the checklist.
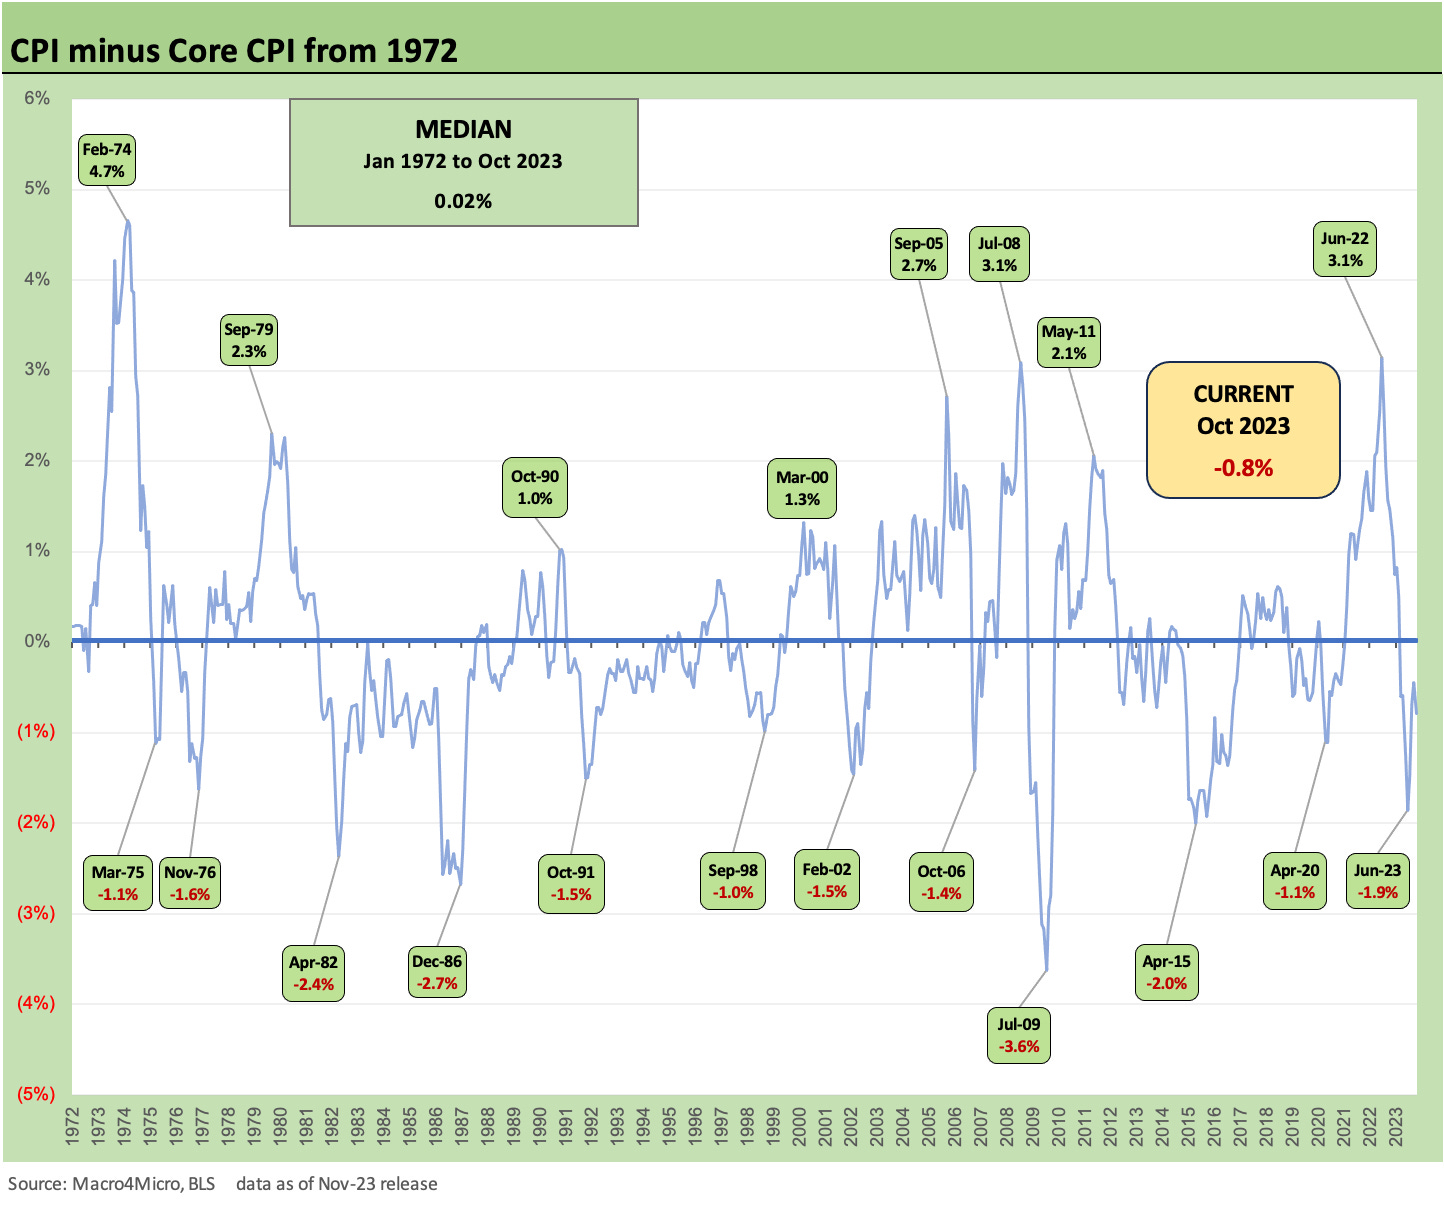
The above chart plots the history of the Headline CPI vs. Core differentials. We see a median differential of essentially zero but very slightly positive at 0.02%. We have swung from +3.1% in June 2022 to -0.8% in Oct 2023. When we look at the Energy and Food inflation lines, we see how it swings around. June 2022 was the peak panic period of inflation made worse by the effects of the oil spiral tied to Russia-Ukraine. Oil being weaponized is an old school OPEC action, and the actions by Russia on oil and gas were not new.
We had the Arab Oil Embargo from Oct 1973 to March 1974 (and US domestic rationing of gasoline) after the Yom Kippur War and then the fallout from the Iranian Oil crisis in 1979. Both of those are in evidence on the headline CPI spikes vs. Core. We then see the 1990 oil spike tied to Iraq’s invasion of Kuwait. The Mideast hot war history does not register today (so far) since oil is not on the line – unless Iran sticks its head up or the Saudis get angry.
As we look at the headline CPI divergences from Core above, the election and political fallout are not without some relevance in 2024 as an election year. Those inflation spikes had a bad habit of being contributors to inflation and recessions even if just for the toll taken on consumers. President Nixon resigned in 1974, but President Ford in part got hit by the aftereffects of recession in the election against Carter. Of course, Watergate did not do wonders for the GOP vote. Ethical standards were higher in those days (guys like Goldwater were “men” not “mice”). Then Carter was hit by recession and inflation and Reagan took the helm.
The recession that started in the summer of 1990 saw GHW Bush made into a one-term President. NBER did not declare the recession over until after the election in 1992 (seriously, see Business Cycles: The Recession Dating Game 10-10-22). The summer of 2008 saw a brutal oil spike that many tend to forget since everything else dwarfed it in the later credit crisis. GW Bush was done with his two terms but the 2006 election after the Iraq oil fallout did not help his second round of midterms (nor did the Iraq War).
We see a big Headline vs. Core gap in 2011 on the back of Middle East turmoil that started in the Arab spring of 2010 (the match was lit in Tunisia) but later saw major distortions in Libya in 2011 that roiled global oil markets. The year 2011 saw a train wreck in the Eurozone and threatened defaults in the US with the Tea Party ascendant in the GOP. So, there was no shortage of issues to look at beyond oil.
In the context of today’s politics and policy conflicts, it is worth noting that in July 2011 the Gallup poll had Obama down around 40% over a year before the election. At the time in 2011, he was given last rites on 2012 election prospects. He of course won that election. That is a policy variable in assessing what today means if we duck a recession and we have 2% inflation next year. During 2011-2012, the GOP controlled the House and the Democrats controlled the Senate. Sound familiar?
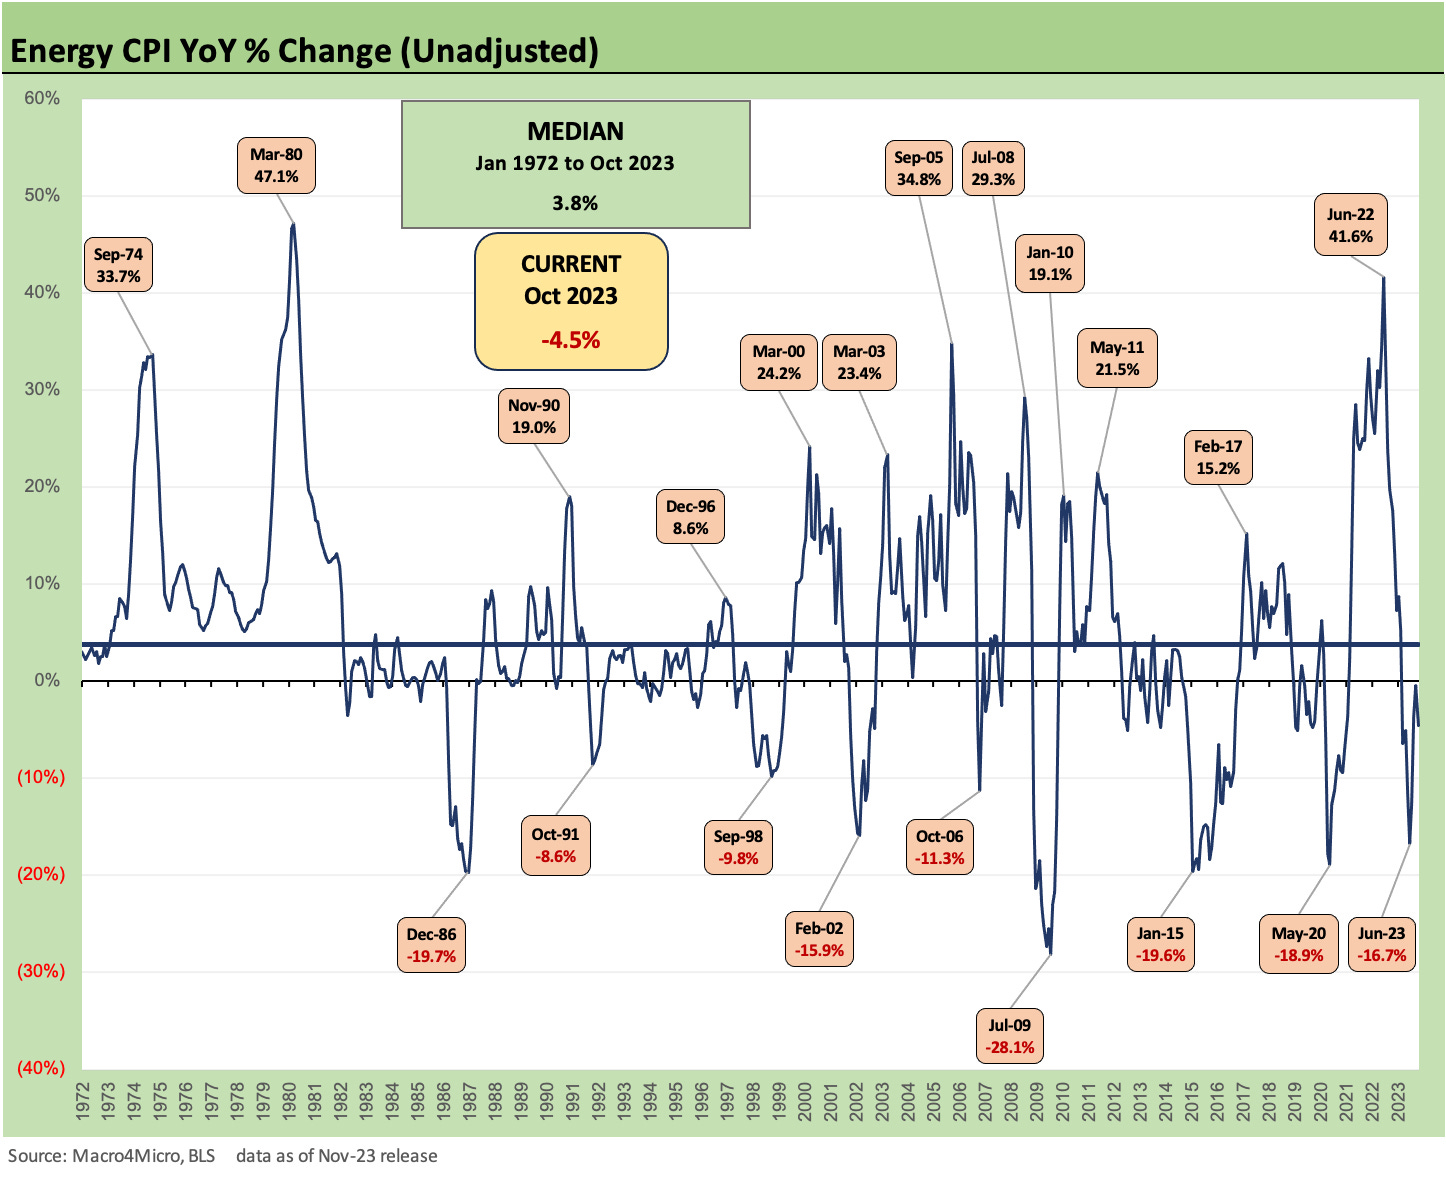
The above chart speaks for itself around what Energy CPI means for predictability. Across the wild swings, the median does not hold much significance, but it is +3.8% vs. the -4.5% of Oct 2023.
Looking back across the cycles, the 1974 blowout is no mystery after the Arab Oil Embargo and panic around the US running out of oil and natural gas as the 1970s wore on. That experience scared the consumer and corporate sector alike, so by 1979 the reaction to the Iran crisis led to some refined product hoarding that exacerbated the situation and set off another spike.
The oil markets would soon be transformed in the 1980s by the rising production across the North Sea, Alaskan crude oil, the rise of Mexico, and the erosion of OPEC discipline in controlling supply. For anyone interested in those transition years, they should get “The Prize” (shortened title) by Daniel Yergin (published back around 1991). It is a light read at 800+ pages (!) but can be read in sections by area of chronological interest.
I had started covering oils on the buy side in the 1980s and the consensus was initially oil would go to $100. Of course, it went to $10 as evident in the 1986 data point above. In the late 1970s, everyone knew the US would run out of natural gas, so the pipelines (which were then merchants rather than “highways”) scrambled to lock in supply sources at high fixed prices and occasionally such suicidal structure as “percentage of field production” deals that would lead to financially devastating purchase commitments later. We do not seek to go into that rabbit hole here, but it is a reminder of how hard commodities are to predict.
Russia-Ukraine was one more example of how quickly prices can go ballistic. Similarly, the post-shale peak was an example of how a collapse in prices can unfold. For the early 1980s, OPEC felt it. In the mid-1980s, the US oil patch and Texas Banks were crushed. The Sept 1980 to Aug 1988 Iran-Iraq War served as another supply wild card. Then the invasion of Kuwait in 1990 and US/UN military action. Then Iraq Part Deux in 2003. Then the secular boom in China demand across the years. Then the Arab Spring and Libyan revolution. The “shale” and unconventional drilling boom in the US and Saudi market share war in late 2014. Now back to Russia-Ukraine. The bottom line is: “never dull.”
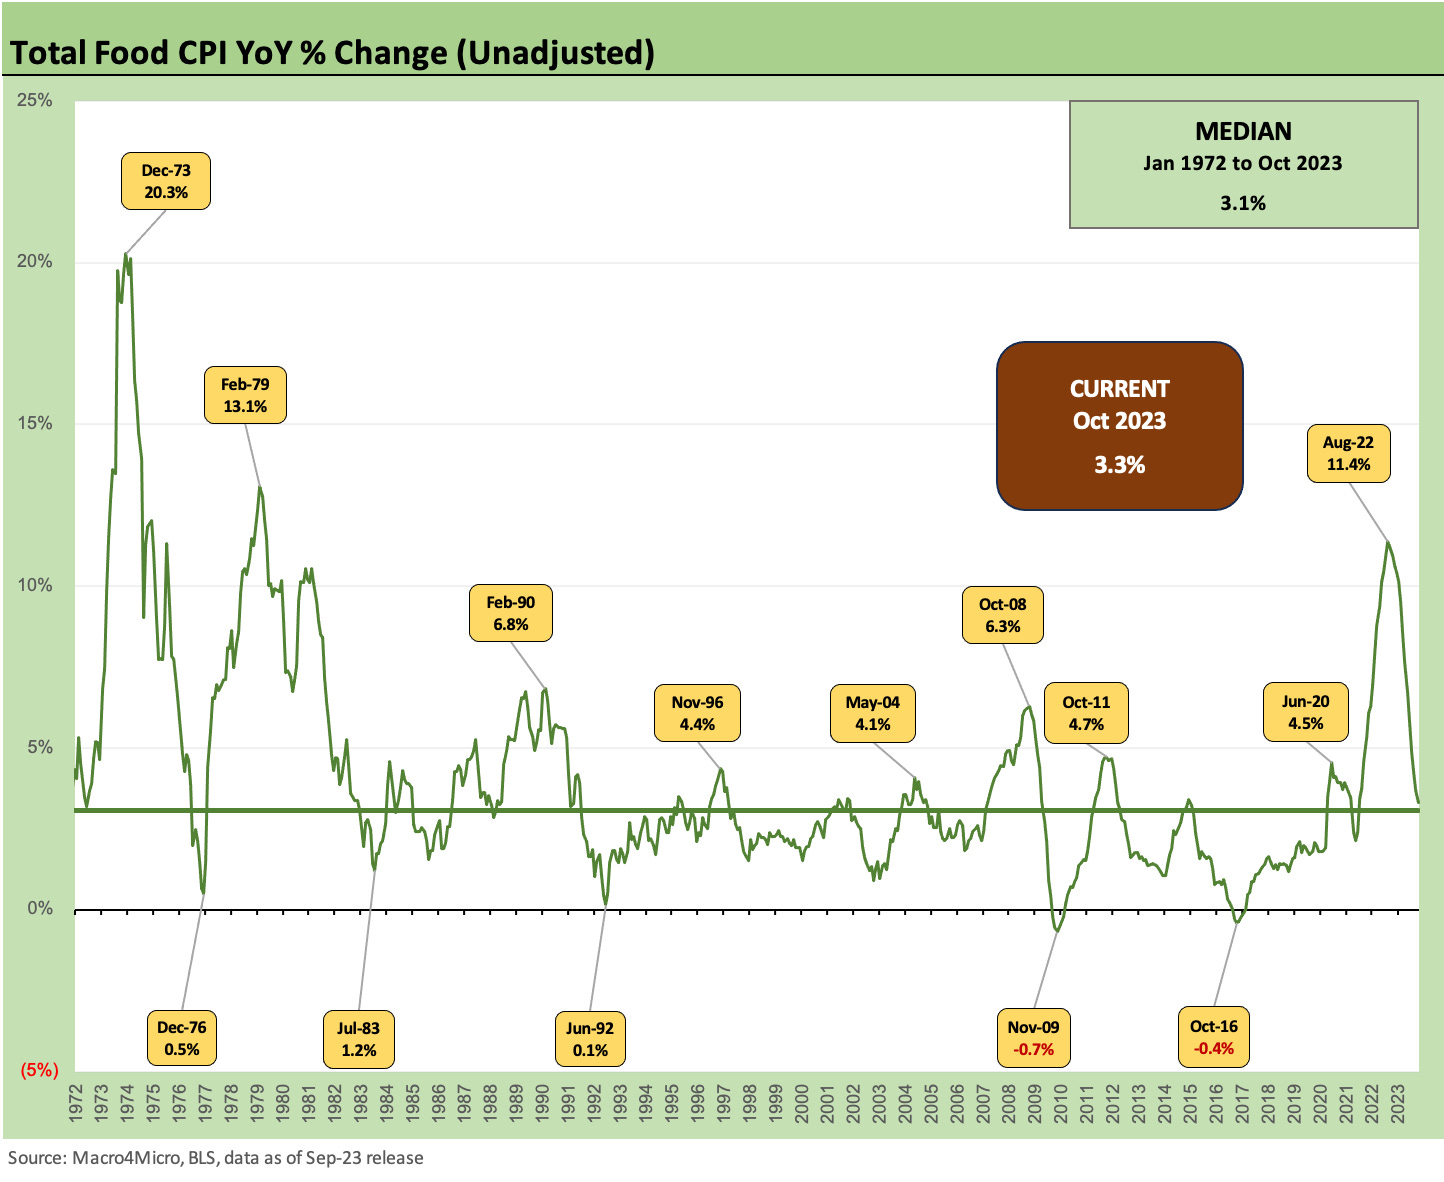
The above chart shows the time series for Total Food inflation including “Food at Home” and “Food Away from Home.” We see a long-term median of 3.1% but with much less volatility than energy after the 1970s. We see some ugly turns in the 1970s that were not revisited until this recent spike in 2022.
Energy costs always have an effect on food inflation from the agricultural chemical costs to the operating costs of the farm to the surcharges on freight and logistics. Drought and floods are factors over time. Many see climate changes as a hoax until their crops die and water sources dry up. Mother Nature has a role to play. The good news is that the ag sector is one area where the US ranks among the most competitive and efficient in the world.
The topic of food inflation is a critical one for political fodder for obvious reasons just as gasoline is a hot button when the average household drives to the grocery store and is often living paycheck to paycheck. The Food inflation headline of 2022 often came with the phrase “highest since 1979” for the reason we see in the chart with the 2022 high of 11.4% modestly under the 13.1% of 1979. As we know, that did not end well for President Carter.
The food inflation of 1973 was one for the ages. In 1973, when food inflation hit over 20% in Dec 1973 during the oil embargo, the not so funny punchline was that driving to the store would eat into your ability to shop in all the aisles. Or you sent your kids to the store on foot (It is still not funny today). As we know, that did not end well for Nixon (who resigned for other reasons in 1974) or later for President Ford, who inherited the mess and the was at the helm for the wind-down of the longest recession since the Great Depression.
The curse of food inflation has a rough history for elected officials. The trick will be avoiding recession and keeping jobs high. That said, Carter’s performance on average GDP growth and employment growth was clearly superior to Trump’s single term and Obama’s two terms. However, the eye (or blurred brain) of the beholder calls the shots.
We are now down to only +3.3% CPI for Total Food as of Oct 2023 and +2.1% for “Food at home” (+8.5% of the CPI index). Unfortunately, the receipt at the register is not in deflation or causing amnesia of where prices were not long ago. “Food away from home”(4.8% of the CPI index) was “+5.4%” in this latest CPI report (see October CPI: The Bis 5 Buckets and Add-Ons 11-14-23).
The food inflation of 1973 was a topic studied and analyzed to death by economists since the backdrop tied into farm policy, trade policy, dollar exchange rate management, and international relations such as with grain sales to Russia.
Whether it be bad policy design on grain stockpiles, misguided pricing strategies on international sales (sometimes out of concern over the dollar), crop failures around the world, rising consumer appetites for meat in “less developed countries” (“LDC” is now considered politically incorrect), or a range of other cause-and-effect checklist items, those debates at the time never ended. Some even had a purely monetary view of all inflation (personally I never heard of an M2 crop failure with rising demand for edible M3).
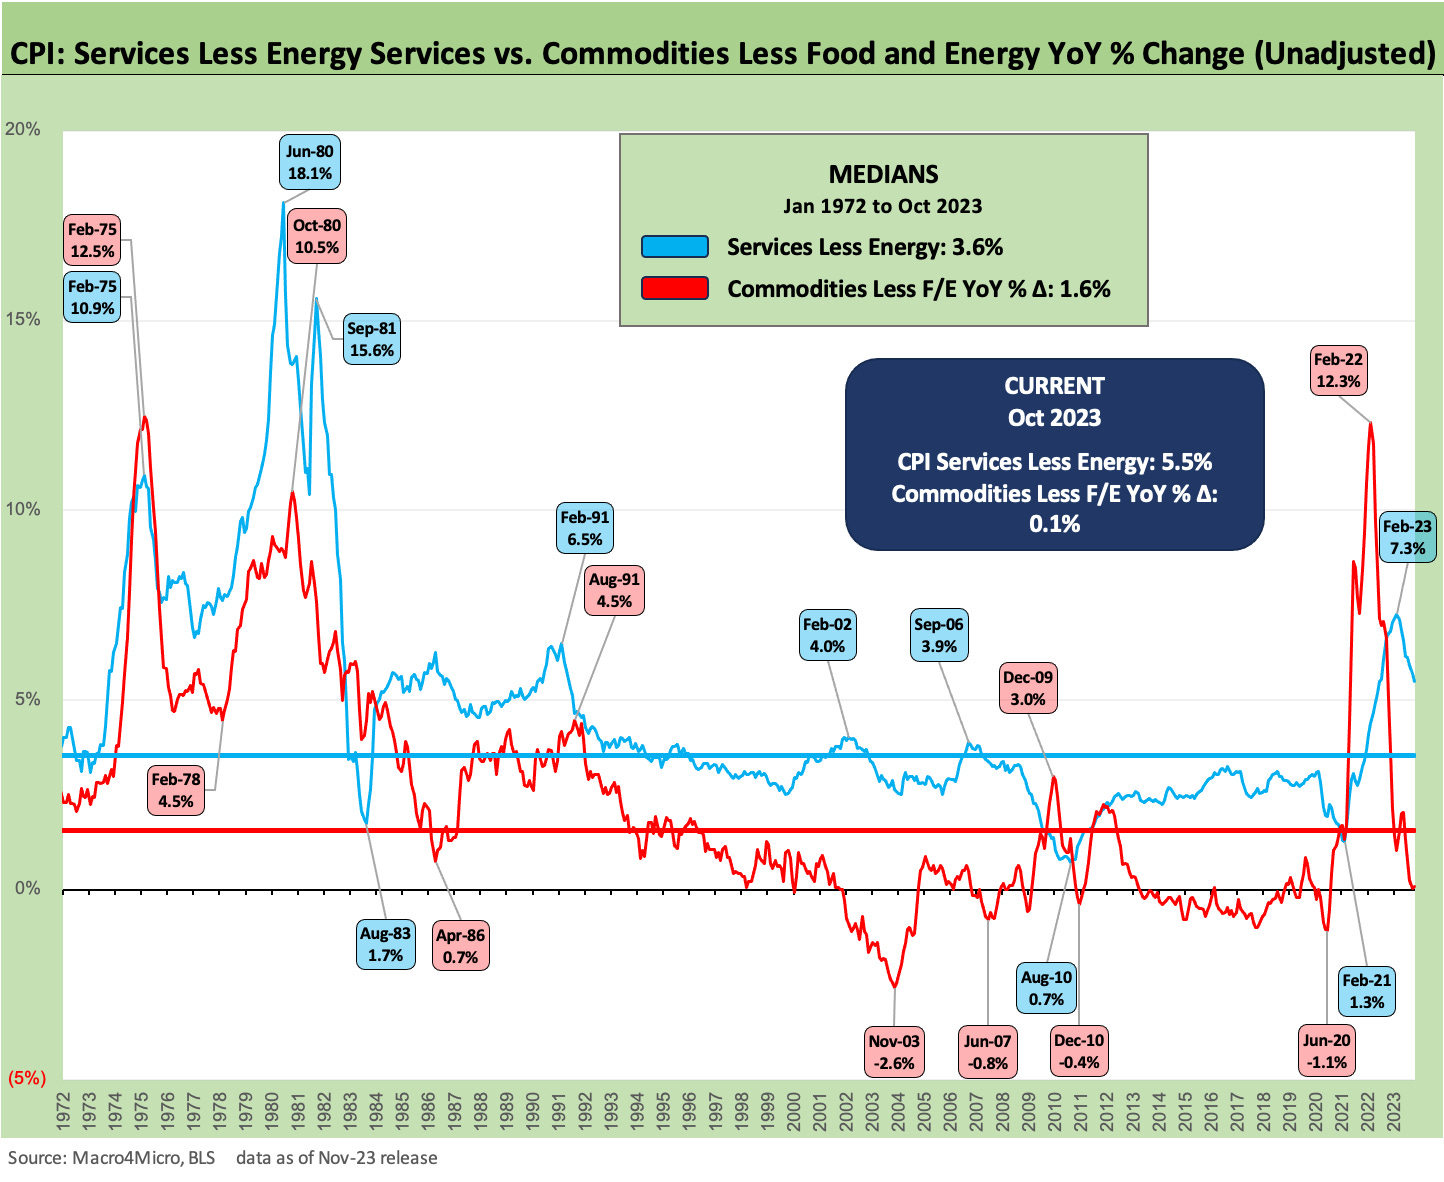
The above chart tracks “Services less Energy Services” (58.5% of CPI index) vs. “Commodities less Food and Energy” (20.9% of CPI index). The combined CPI index share totals 79.4%. This comprises “Core CPI.” The term “Commodities” is the BLS word for “Goods” although a BMW made in South Carolina or a patented, branded, high margin drug might not naturally be called a “commodity” in anything other than a BLS release.
We see Services ex-Energy as down to 5.5% YoY (median: 3.6%) after dipping down into the most recent monthly report from 0.6% in Sept 2023 to 0.3% in Oct 2023. As we discuss in our recent CPI commentary, the 5.5% in Services ex-Energy is a long way from 2.0% for a line that is over 58% of the CPI index. Shelter Services, which we address in the next chart, is a big part of that 5.5% with Shelter CPI’s weight at 34.9% of the 59.5% or a substantial majority of that Services ex-Energy subset of CPI.
We see “Commodities less Food and Energy” at +0.1% at this point vs. a median of +1.6%. “Goods” as we call them are in solid shape from an inflation standpoint. Autos have been topping off among larger categories with used cars deflating as of Oct 2023. New vehicles (4.2% weighting of CPI) are at +1.9% YoY while used vehicles (+2.6% of CPI) are at -7.1% CPI YoY. Meanwhile, the cost of vehicle financing is a strain in this market. For example, cost of car ownership is rising with insurance and repair/maintenance around double digits YoY. Apparel (2.6% of CPI) is hovering around 2.6% YoY CPI. Household furnishing and supplies (4.3% of CPI) are at +0.7% CPI YoY.
Goods are not the problem at this point with Durables at -2.1% and Nondurables at +1.7% YoY. We would note that Nondurables less food and beverage are in deflation mode as of the most recent CPI report (-0.4%).

The above chart plots the Shelter inflation line across the years since the methodology change that went into effect in 1983. We see a long-term median of +2.6% for Shelter vs. the current +6.7%. We see the +6.7% for total shelter as a serious laggard based on high frequency current rental numbers which of course can vary by region. There is no shortage of data sources that look across the markets at all the major metros.
Regardless of the rental numbers that can be used to revise the estimate, the main problem is the Owners Equivalent Rent concept itself as we discuss below. The CPI less Shelter number of 1.5% is much closer to economic reality.
We start the timeline above in 1983 with the new system, but for a look back at the old BLS releases and the old methodology, we first note a few of the old, brutal housing inflation numbers. We see unadjusted YoY for 1979 at +15.3%, 1980 at +13.8%, and 1981 at +10.0%. Those were some ugly years at the real estate office. We took those stats directly from the old documents from the BLS archive.
As the BLS sought to shift the framework on housing CPI, the treatment of shelter essentially came down to a choice between “What does a house cost?” and “What is the implied cost of shelter services in a home?” The idea was to come up with some frame of reference using rental equivalence based on the idea that owner occupied dwelling offers a shelter service that can be estimated. Unfortunately, the whole process takes the consumer experience to economics class and out of that homeowner’s checking account.
The only part of shelter inflation that is easily embraced and intuitive is the cost of renting the place where you live (e.g., a rental apartment), and even that CPI metric lags depending on lease periods and the current indications for new rental units coming on the market across the range of metro regions. Common sense says that your two-year lease has zero inflation until it gets renewed and/or repriced.
The old treatment for shelter inflation was about the price and related costs of financing the purchase. The broader limitations of that approach in terms of concepts and sample size in 1979-1981 when activity plunged is a story for another day, but there were also the longer-term realities that real estate value appreciates and that a house is an investment and not just a vehicle for shelter.
The old approach faces the fact that the mortgage could be refinanced. Did that mean that a lower refinanced mortgage rate was causing deflation at a time when the house value was also rising since it was purchased? It is easy to poke fun at the treatment of owned dwellings, but the simple situation of an owner with no mortgage or low fixed rate mortgage (as we see broadly today) tells a basic story. The owner is not experiencing inflation headwinds when that homeowner writes the same size check each month to the bank or no check at all. The idea that he is facing +6.8% inflation (the Oct 2023 level on OER) due to Owners Equivalent Rent is somewhat silly in cash-in/cash-out realities.
Housing services such as insurance, maintenance, property taxes, etc. make sense, but the imputed shelter service cost idea is just another bad day at the faculty club. It is another reason to give more weight to some of the “CPI ex” lines such as “CPI All Items ex-Shelter” at 1.5% for Oct 2023. We do have to eat, and we do have to use energy. However, we don’t have to write an imaginary check to an imaginary landlord for theoretically derived shelter services in the house we own.
Contributors:
Glenn Reynolds, CFA glenn@macro4micro.com
Kevin Chun, CFA kevin@macro4micro.com
See also:
Fed Funds vs CPI: Narrowing of the Gap 12-14-22
Fed Funds vs. PCE Price Index: What is Normal? 10-31-22
Fed Funds, CPI, and the Stairway to Where? 10-19-22
Fed Funds-CPI Differentials: Reversion Time? 10-11-22