
The Curve: Powell’s Relief Pitch 8-24-25
We look at the moving parts of the UST yield curve as Powell signals easing from Jackson Hole.


Trying to get a grip on the jobs vs. inflation balancing act for the curve.
The Jackson Hole speech dominated the headlines for the week. Powell gave a lot of information from different angles including the current state of economic affairs and inflation risk to payroll worries and how it all rolls up into the dual mandate. He offered a lot of airtime on the monetary policy framework, but that was not the immediate focus for the market.
The dynamics of weak economic growth, tariff driven inflation risk, and a shaky payroll backdrop still gave Powell some room to deliver the money line of “with policy in restrictive territory, the baseline outlook and the shifting balance of risks may warrant adjusting our policy stance.” That was the main takeaway.
Powell’s pieces of the economic puzzle were anything but favorable: “GDP growth has slowed notably in the first half of this year to a pace of 1.2 percent, roughly half the 2.5 percent pace in 2024…the effects of tariffs on consumer prices are now clearly visible...it will continue to take time for tariff increases to work their way through supply chains and distribution networks…tariff rates continue to evolve, potentially prolonging the adjustment process…” That was not a resounding endorsement of the economy or policy confidence. We can be sure Team Trump did not like that description.
In the end, the potential (not certainty) of a “one-time shift” in the price level was more positive spin for easing while framing the labor market as being in a “curious kind of balance that results from a marked slowing in both the supply of and demand for workers.”
In this note, we also look back at the historical slope of the 3M to 2Y UST as the inversion still gnaws at the FOMC given how anomalous it is in an expansion with relatively low inflation at this point.
Note: We reworked the format of our weekly UST recap to streamline the text and chart count. For those who want the full detailed history on UST migration from the Oct 2023 10Y UST peak through current times, see Footnotes & Flashbacks: State of Yields 8-17-25.
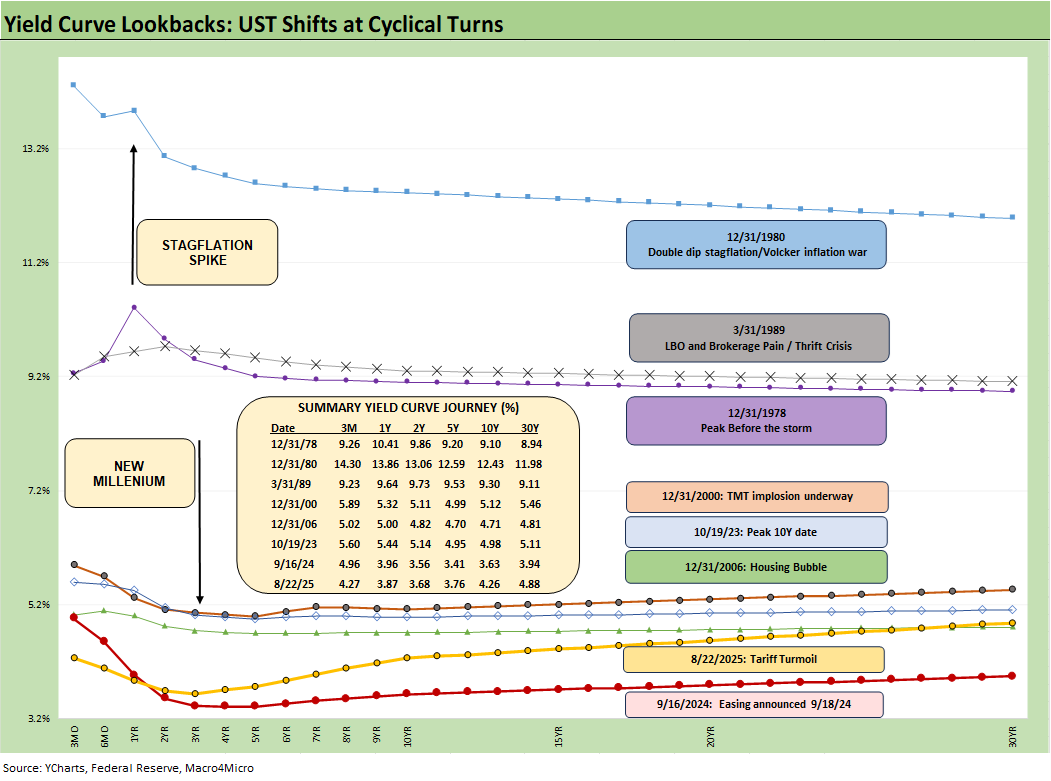
The above chart helps give historical context to the level and shape of the yield curve vs. some very interesting market backdrops in historical economic expansions and in some cases pending turns in the monetary cycle. With the FOMC approaching some major decision points in September and into the 4Q25 period, it has been a long time since a stagflation threat had to be considered. The recent experience of the Sept 2024 easing will keep market participants aware that easing can wag the entire curve for a while, but the steepening risks of 2024 and 2025 will still lurk.
Historical yield curves underscore current rates are low…
The chart plots yield curves over a span from the Carter inversion of 1978 across the Volcker years, the1980s credit cycle peak in 1989 (note the 9.2% 3M UST), the TMT cycle faltering in 2000 (on the way to a massive Greenspan easing in 2001), and the housing bubble in 2006. During the 2004 to 2007 period, leveraged derivative exposure and structured credit was out of control and counterparty risk was soaring. Worth highlighting is that the current 3M UST is notably lower than the pre-crisis, pre-ZIRP 3M UST levels.
The chart then jumps from 2006 to 2023, which takes the market beyond the crisis period and the ZIRP years and COVID. Both the post-credit crisis period and COVID prompted the Fed to deliver a wave of market liquidity support and confidence building programs that helped save the capital markets, reopened the credit markets, reduced refinancing risk anxiety, and reduced the contingent liquidity risk profile of the banks.
The credit crisis period from late 2008 and the 2020 COVID crisis period brought plenty of QE and normalization distortions to the yield curve shape. The Fed’s dual mandate made that possible. The market could soon face new legislative threats to that dual mandate based on commentary from Bessent and as discussed in Project 2025 (See Chapter 24).
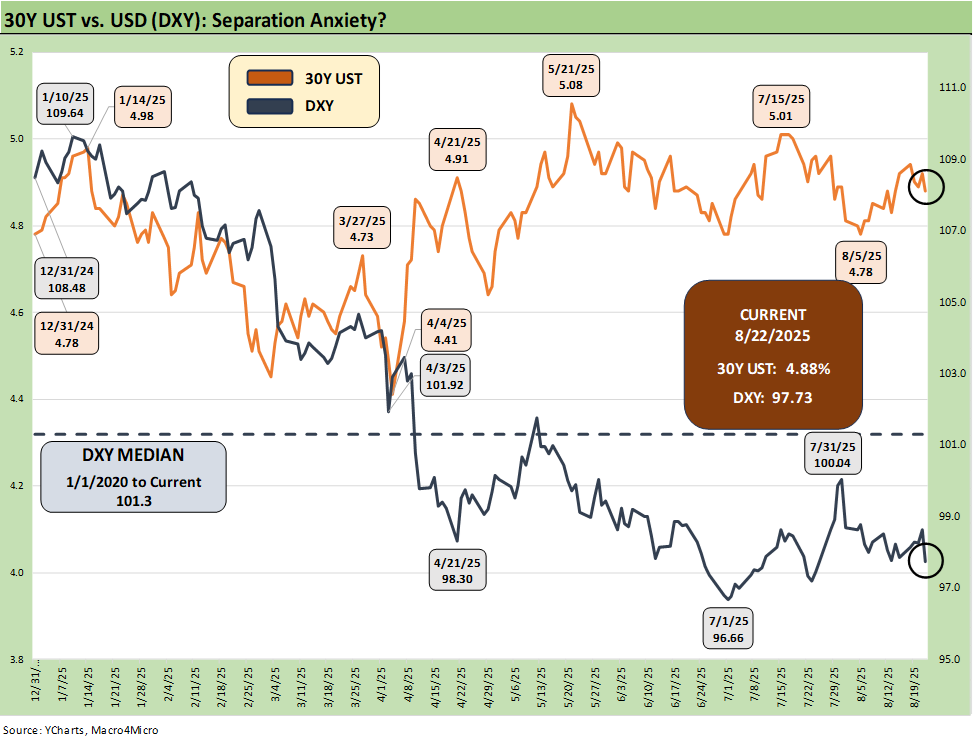
The above chart plots the recent trends in the 30Y UST vs. the dollar index (DXY) as the US dollar weakness throws another wrench in the asset allocation game plan and into the risk factor checklist on non-US buyers of UST. The US needs to attract record demand offshore to buy a record supply of UST. That was a hot topic after the Liberation Day panic of April when the dollar cracked.
Lower rates could be a catalyst for dollar weakness while political risk factors and governance quality are no longer non-factors in the US sovereign credit quality assessment. Record forward-looking deficits and the optics of political instability (military occupation of major cities by an authoritarian-leaning, confrontational leader) adds a negative element to the sovereign risk profile of the US that no rating agency would have the courage to flag.
In theory, the demand side can make up its own mind as the US sovereign balance sheet migrates toward BBB rated Italy. Metrics will matter to someone at some point, the dollar will be under scrutiny, and subjective inputs will not be helped by recurring trade conflict and cyclical pressures in the economies of (former?) allies.
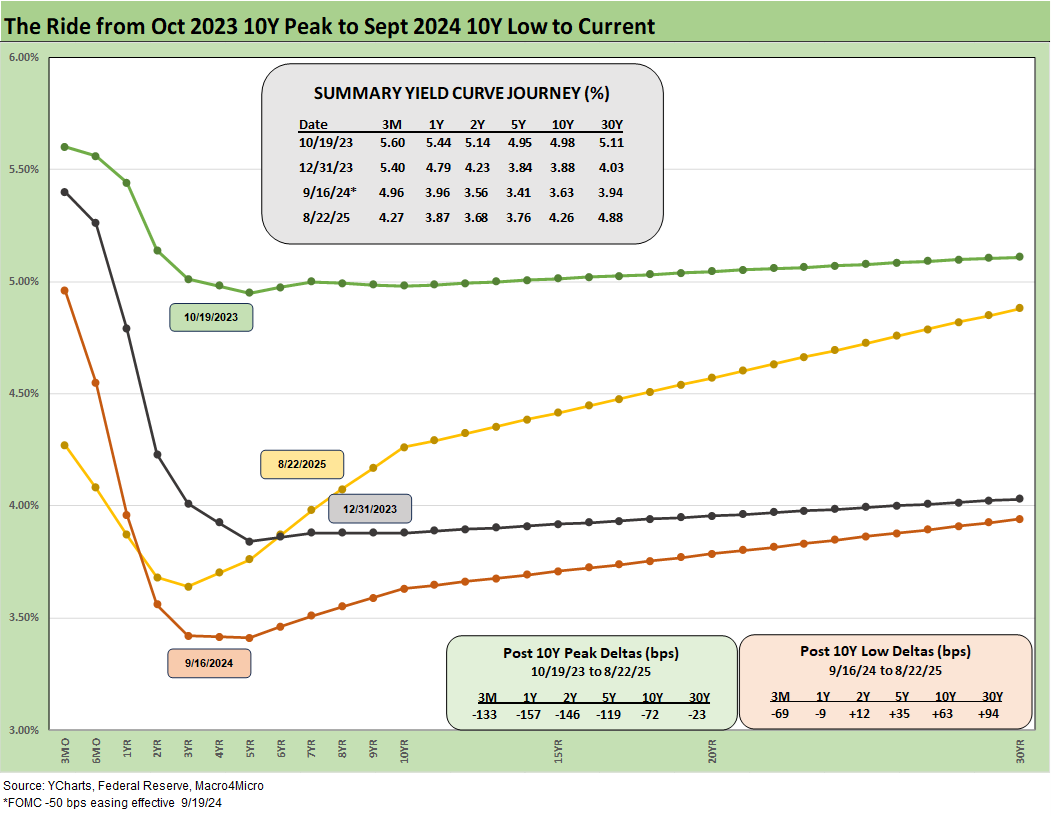
The above chart frames the Oct 2023 peak in the 10Y UST, across the bull flattener into year end 2023, and then into the easing actions and rally of Sept 2024. Then came the ensuing bear steepener that is evident in the journey to Aug 2025. We break out some numerical UST deltas in the box.
There was a lot of bear steepener action from the end of 2023 into the summer of 2024 and fresh bouts of the same after the big rally in the fall of 2024. The Sept 2024 easing gyrations will make it hard to take much for granted this time after Sept 2025 with much higher, sweeping tariff policies and a cyclical slowing in the mix of variables.
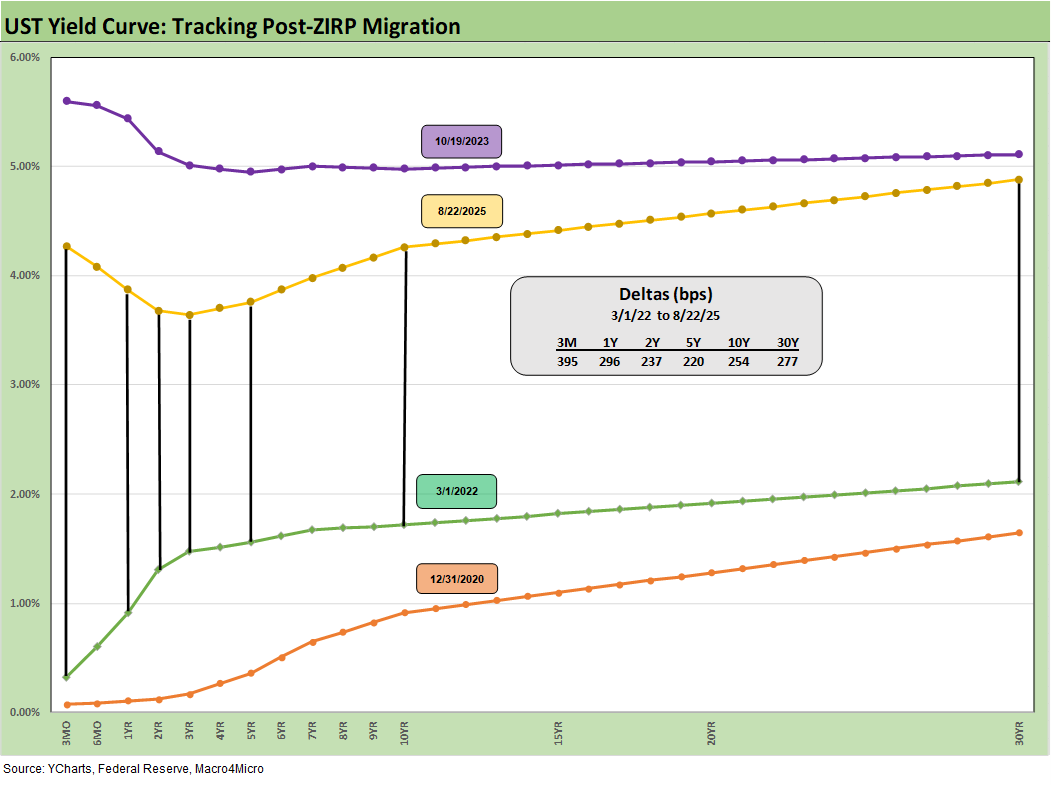
We drop in the above chart to frame the UST deltas since March 2022 when ZIRP ended and the tightening cycle began. It offers a reminder that we had a major move out to Oct 2023 and a smaller move to Aug 2025 from Sept 2024. The past year kept the long duration UST ETF (TLT) under pressure even with the positive YTD 2025 performance (see Footnotes & Flashbacks: Asset Returns 8-24-25).
We next get PCE details and then payroll in short order. The second estimate of 2Q25 GDP this week should also help give more input on fixed investment and the consumer.
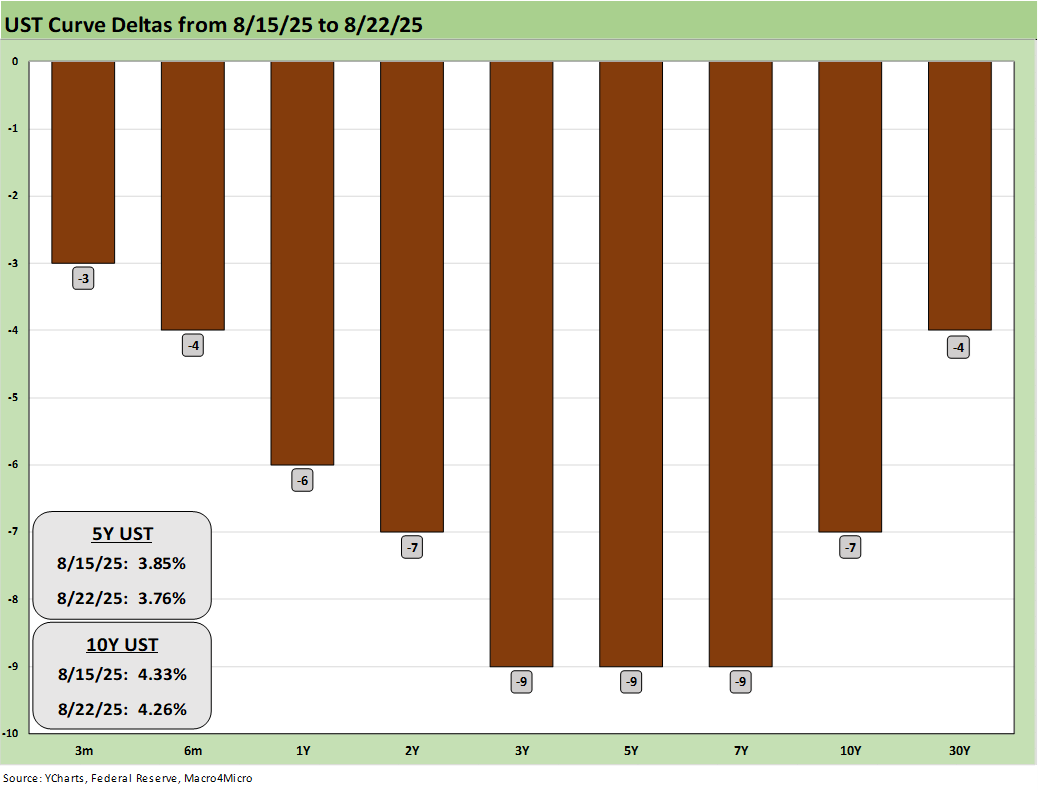
The above chart plots the 1-week UST deltas as Friday price action helped drive a good week for bonds.
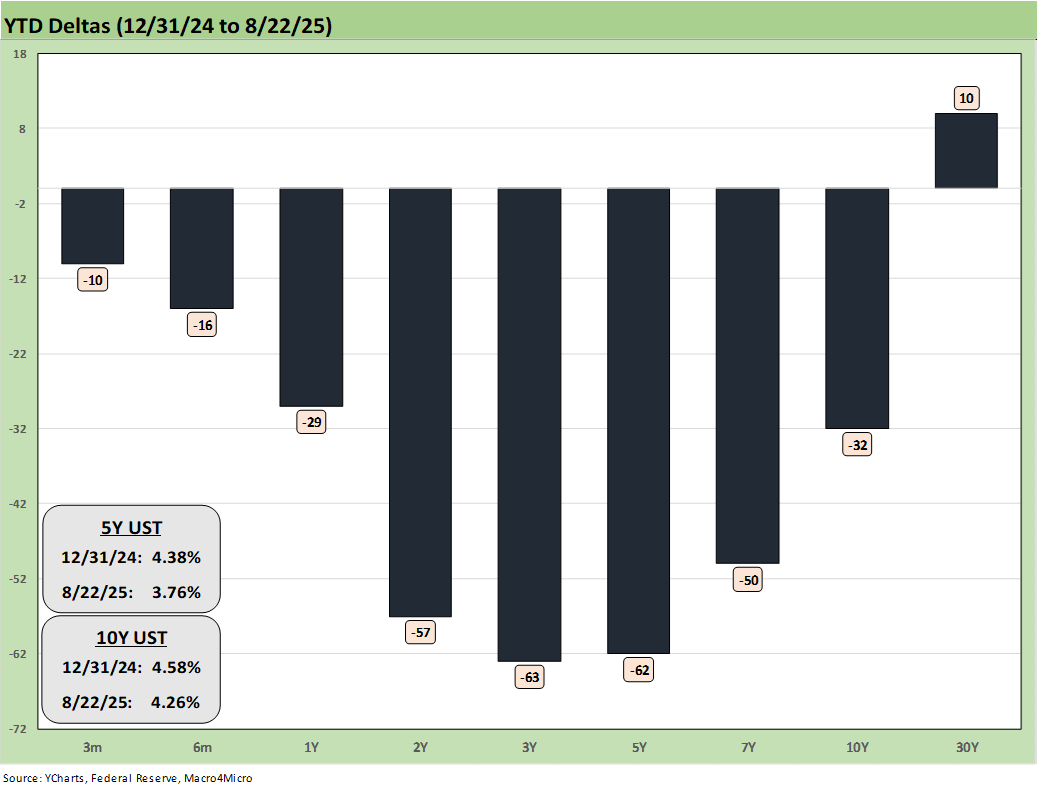
The YTD UST yield curve deltas are broken out above. The bull steepener pattern has rewarded bonds, but the long end has been stubborn.
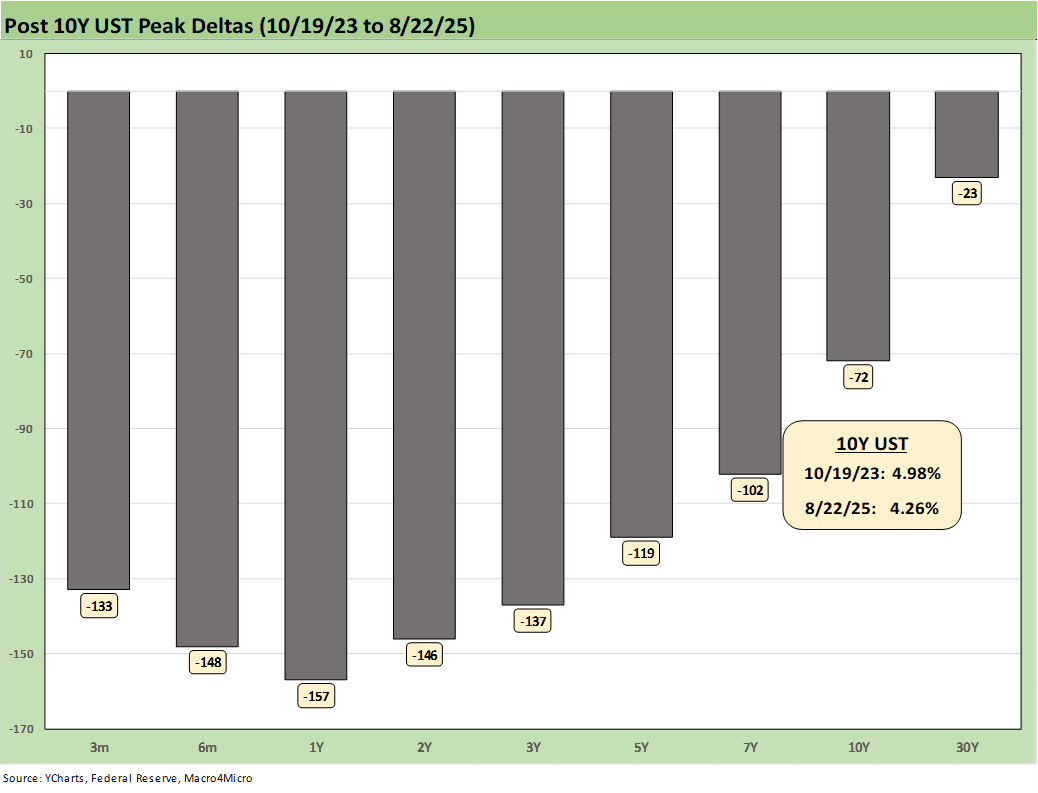
The above chart updates the running UST deltas from 10-19-23 through Friday. At the very least, it offers a reminder of what could go wrong if we get the wrong inflation outcomes from tariffs.
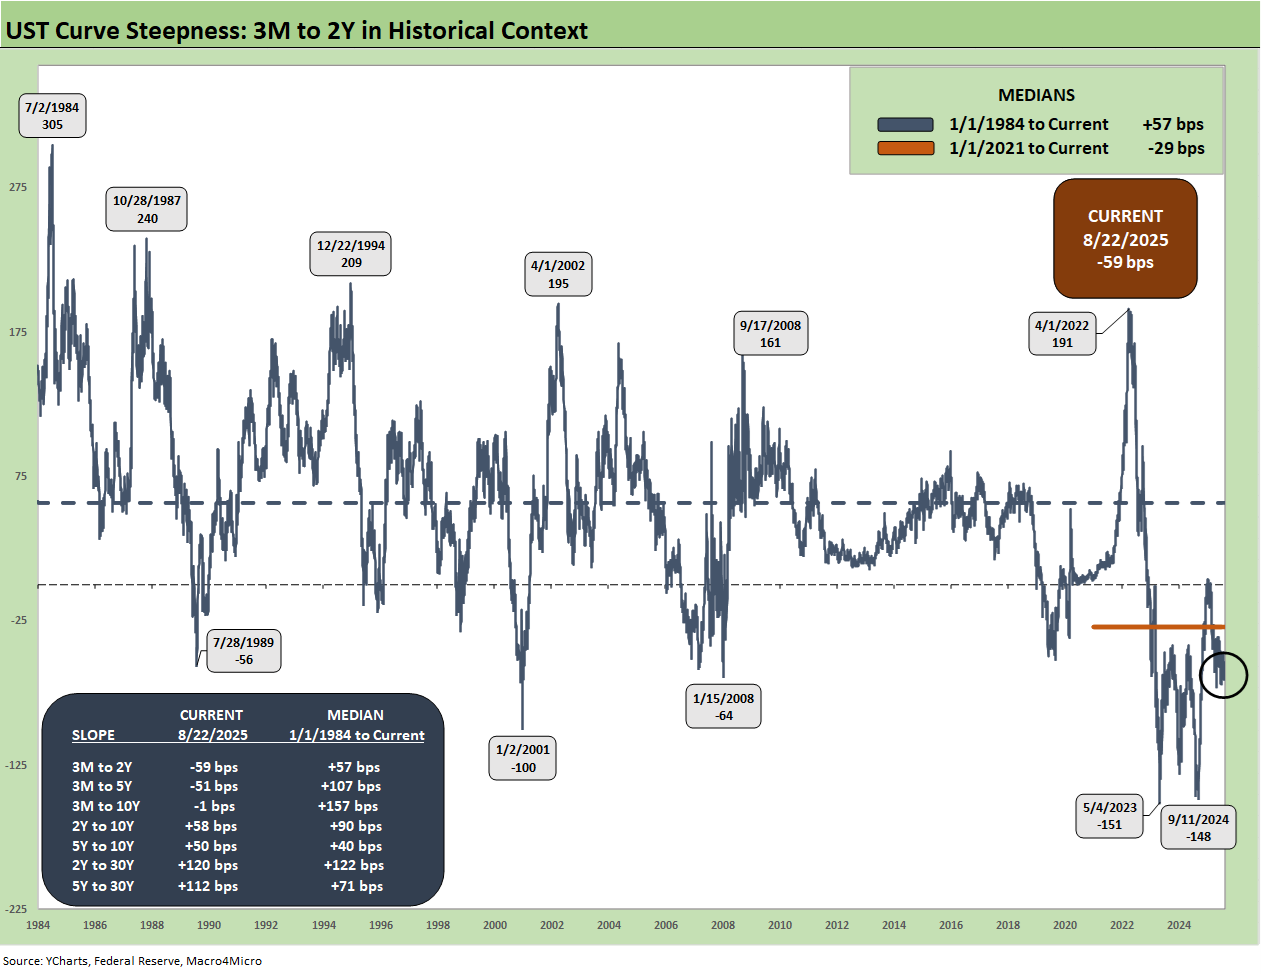
The above chart plots the 3M to 2Y UST slope from 1984 for a read on the current inversion. The long-term median for 3M to 2Y UST is upward sloping at +57 bps vs. the current inversion of -59 bps. We see a peak inversion in May 2023 of -151 bps and a fresh near-peak inversion of -148 bps in Sept 2024.
We also include the other UST curve segment slopes that we watch along with the long-term medians. The front-end inversion from 3M is still the most anomalous part of the curve when you consider the fact we are in an economic expansion and PCE inflation is inside the 3.0% line.
The challenge for the FOMC has been about tariffs. We are into a set of tariff policies never tried in the modern capital markets in a highly globalized economy with extensive supplier chain ties. There is a lot of new ground to cover to understand the structural effects ahead.
See also:
Footnotes & Flashbacks: Asset Returns 8-24-25
Mini Market Lookback: The Popeye Powell Effect 8-23-25
Existing Home Sales July 2025: Rays of Hope Brighter on Rates? 8-21-25
Home Starts July 2025: Favorable Growth YoY Driven by South 8-19-25
Footnotes & Flashbacks: Credit Markets 8-18-25
Herc Holdings Update: Playing Catchup 8-17-25
Footnotes & Flashbacks: State of Yields 8-17-25
Mini Market Lookback: Rising Inflation, Steady Low Growth? 8-16-25
Industrial Production July 2025: Capacity Utilization 8-15-25
Retail Sales Jul25: Cautious Optimism in the Aisles 8-15-25
PPI: A Snapshot of the Moving Parts 8-14-25
CPI July 2025: Slow Erosion of Purchasing Power 8-12-25
Iron Mountain Update: Records ‘R’ Us 8-11-25
Mini Market Lookback: Ghosts of Economics Past 8-9-25
Macro Menu: There is More Than “Recession” to Consider 8-5-25
Mini Market Lookback: Welcome To the New World of Data 8-2-25
Happiness is Doing Your Own Report Card 8-1-25
Payrolls July 2025: Into the Occupation Weeds 8-1-25
Employment July 2025: Negative Revisions Make a Statement 8-1-25
Employment Cost Index 2Q25: Labor in Quiet Mode 7-31-25
PCE June 2025: Prices, Income, and Outlays 7-31-25
2Q25 GDP: Into the Investment Weeds 7-30-25
2Q25 GDP: First Cut of Another Distorted Quarter 7-30-25
United Rentals: Cyclical Bellwether Votes for a Steady Cycle 7-29-25