
The Curve: Risk Tradeoff - Tariffs vs. UST Supply
With payroll ahead this week, the tariff decision was last week’s biggest development with reverberating effects.


Tariff legal risk and payroll handicapping have mixed odds for the curve.
The Friday tariff news on Trump’s legal setbacks on IEEPA tariffs (7-4 vote) sends the case to the Supreme Court. The news raises a raft of issues on how the dramatically lower aggregate level of tariffs will settle in on purchasing power and inflation risk, corporate profitability, small business health, and most important for monetary policy, inflation worries (or more simply defined purchasing power vs. wage expectations).
The tariff revenue line (aka the US buyers’ expense line and potential price pass-throughs) sets up some budget deficit questions that would be a negative for the recurring threat to UST supply-demand balance and steepening risk.
The week saw a balanced set of macro moving parts with PCE inflation still in the sub-3% zone but income and outlays data showing a healthier consumer than might have been feared. The 2Q25 GDP second estimate also dropped in enough upward revisions to keep the debate going, but the consumption line saw the lowest services PCE line since Trump 1.0.
Payroll data comes this week, and all eyes will be on what a negative reading would mean for FOMC handicapping and the Team Trump response to any readings they don’t like. The attempted takeover of economic data releases comes with Trump demanding 300 bps of easing. That is, as long as feds funds reductions come alongside positive superlatives and praise of the “best 8 months in Presidential History” for economic policies and overall governance. That is a tough tandem conceptually.
NOTE: We recently reworked the format of our weekly UST recap to streamline the text and chart count. For those who want the full detailed history on UST migration from the Oct 2023 10Y UST peak through current times, see Footnotes & Flashbacks: State of Yields 8-17-25.
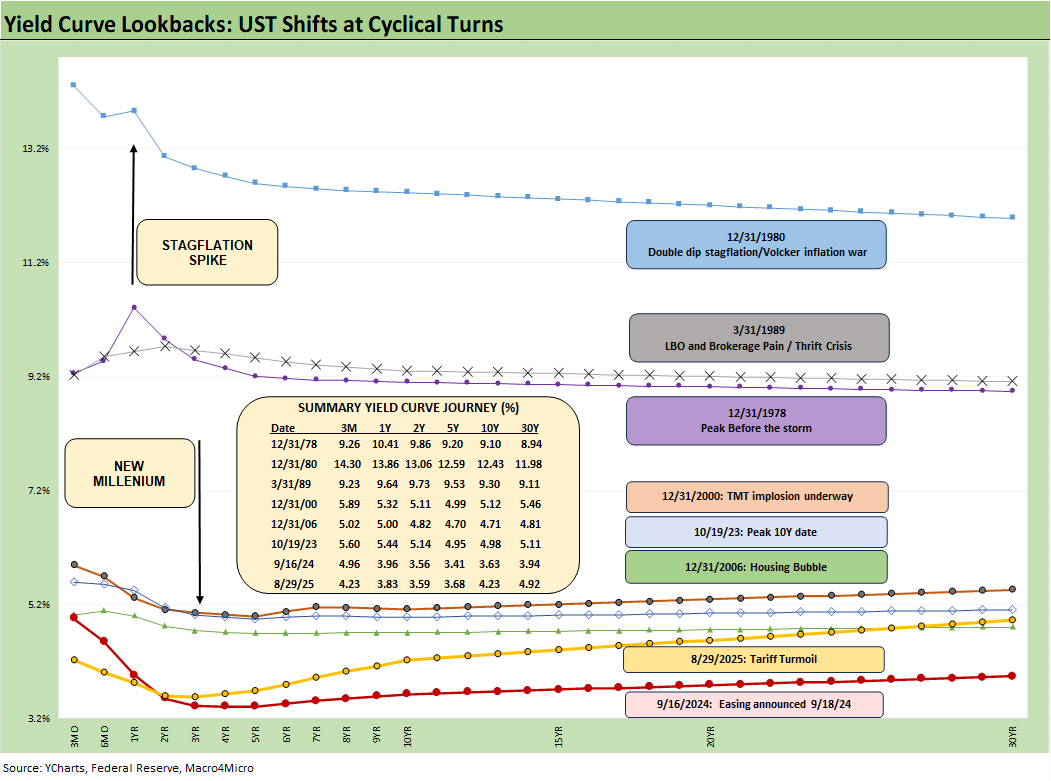
The above chart helps give historical context to the level and shape of the yield curve vs. some very interesting market backdrops in historical economic expansions and in some cases pending turns in the monetary cycle. With the FOMC approaching some major decision points in mid-September and into the 4Q25 period, it has been a long time since a stagflation threat had to be considered.
The recent experience of the Sept 2024 easing will keep market participants aware that easing can wag the entire curve for a while, but the steepening risks of 2024 and 2025 will still lurk. The tariff headline of the past week will now raise even more questions around UST supply pressure.
The fear of steepening is alive and well if the economy stays the course (steady growth) and corporations see less tariff pressure (Trump statements to the contrary, the buyer writes the check to customs) and thus less to “pass on.” If the decision stands, there will still be an unprecedented level of tariffs in the postwar economy, but nowhere near the scale Trump had sought to generate a revenue dependence line.
The IEEPA ruling will not eliminate all tariffs since Section 232 and Section 301 etc. remain in place and in process), but the legal decisions (if SCOTUS approves) would drive the total tariff base much lower and notably with many of the inflation exposed products getting let off the hook.
That would make life easier for the FOMC, the small business community, and the consumer. It would also kneecap Trump’s economic policy and the new world of tariff-based leverage deployed against essentially all countries.
The tariff scenarios run the gamut with Trump’s very agreeable SCOTUS being the easiest answer. If that fails, Trump can look to Congress to legislate him a blank check to assign tariffs at will (the Constitution and Article 1 be damned). But even that would face the risk of the Senate needing to “go nuclear” and erase the filibuster.
Historical yield curves underscore current rates are low…
The chart further above plots yield curves over a span from the Carter inversion of 1978 across the Volcker years, the1980s credit cycle peak in 1989 (note the 9.2% 3M UST), the TMT cycle faltering in 2000 (on the way to a massive Greenspan easing in 2001), and the housing bubble in 2006. During the 2004 to 2007 period, leveraged derivative exposure and structured credit was out of control and counterparty risk was soaring. Worth highlighting is that the current 3M UST is notably lower than the pre-crisis, pre-ZIRP 3M UST levels.
The chart then jumps from 2006 to 2023, which takes the market beyond the crisis period and the ZIRP years and COVID. Both the post-credit crisis period and COVID prompted the Fed to deliver a wave of market liquidity support and confidence building programs that helped save the capital markets, reopened the credit markets, reduced refinancing risk anxiety, and reduced the contingent liquidity risk profile of the banks.
The credit crisis period from late 2008 and the 2020 COVID crisis period brought plenty of QE and normalization distortions to the yield curve shape. The Fed’s dual mandate made that possible. The market could soon face new legislative threats to that dual mandate based on commentary from Bessent and as discussed in Project 2025 (See Chapter 24).
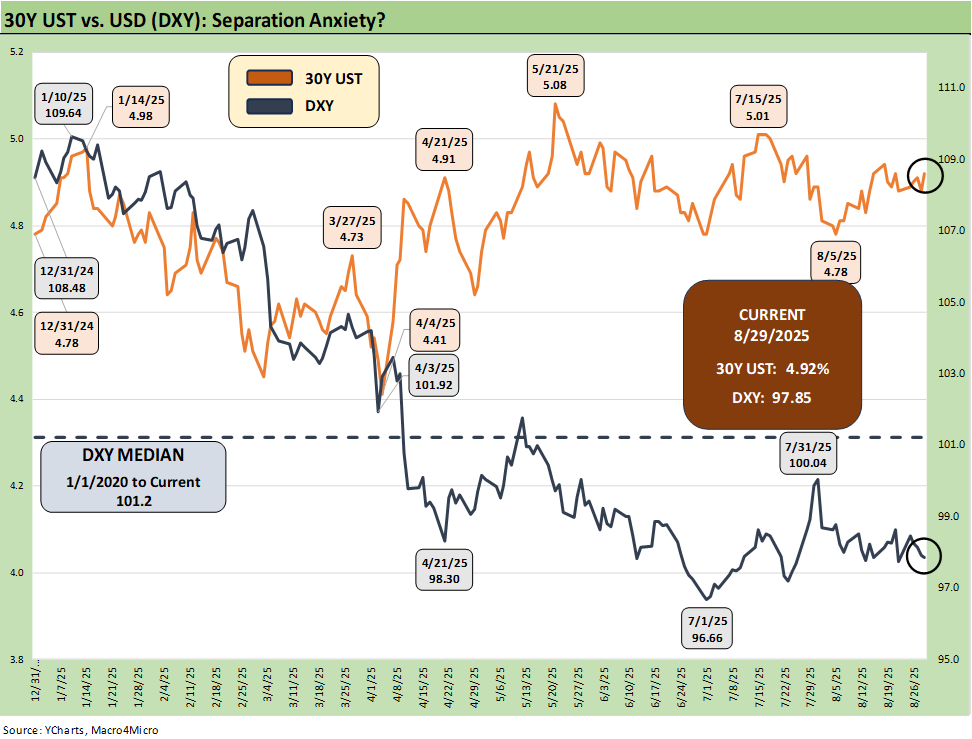
The above chart plots the recent trends in the 30Y UST vs. the dollar index (DXY) as the US dollar weakness throws another wrench in the asset allocation game plan and into the risk factor checklist on non-US buyers of UST.
For the week, we saw the DXY and 30Y both tick higher. The US needs to attract record demand offshore to buy a record supply of UST. That was a hot topic after the Liberation Day panic of April when the dollar cracked. It is likely to warm up again if SCOTUS backs the Appeals Court on the IEEPA ruling. As discussed above, that tariff legal decision assures more borrowing needs with the regressive tax revenue line (i.e. tariffs) moving sharply lower.
Lower rates could be a catalyst for dollar weakness while political risk factors and governance quality are no longer non-factors in the US sovereign credit quality assessment. Record forward-looking deficits and the optics of political instability (military occupation of major cities by an authoritarian-leaning, confrontational leader) adds a negative element to the sovereign risk profile of the US that no rating agency would have the courage to flag.
In theory, the demand side can make up its own mind as the US sovereign balance sheet migrates toward what we see with BBB rated Italy. Metrics will matter to someone at some point, the dollar will be under scrutiny, and subjective inputs will not be helped by recurring trade conflict and cyclical pressures in the economies of (former?) allies.
The tariff decision on IEEPA could create more than a little turmoil in the finalization of trade deals. It has been coming to light that many of the “deal terms” are anything but clear with many disagreements behind the scenes. That is notably the case on the topic of the “greenmail” investment demands Trump extracted with the IEEPA-based threats he could make.
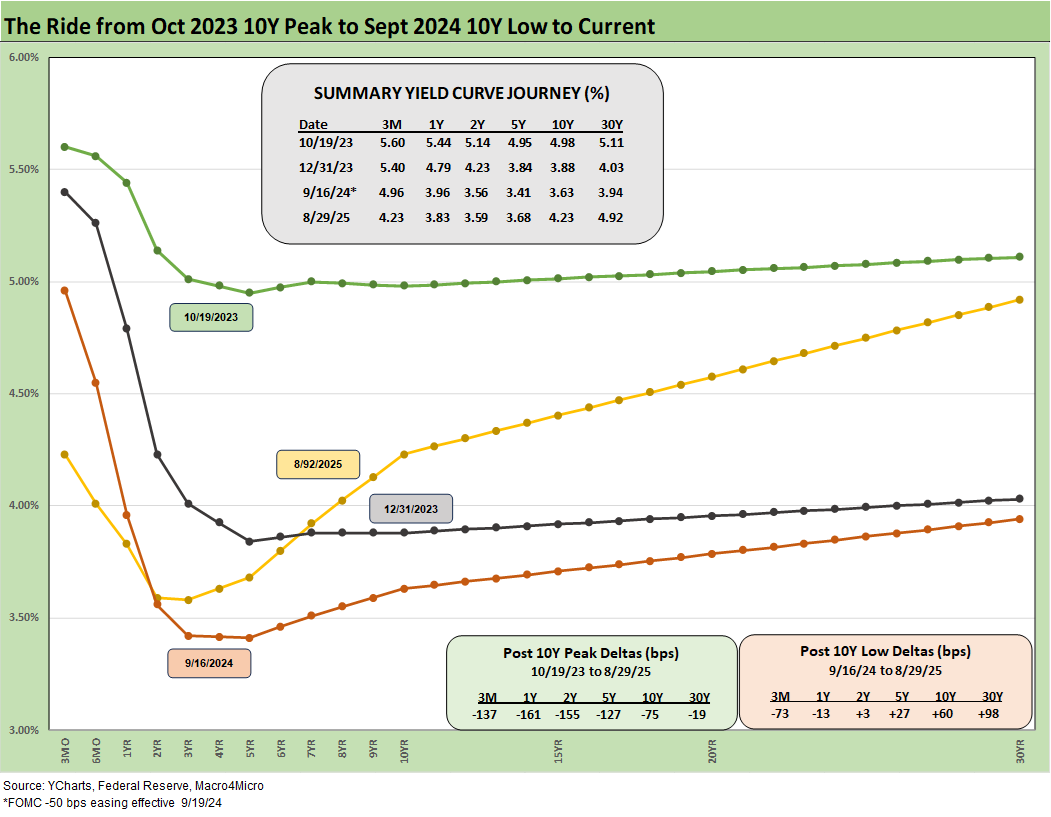
The above chart frames the Oct 2023 peak in the 10Y UST, across the bull flattener into year end 2023, and then into the easing actions and rally of Sept 2024. Then came the ensuing bear steepener that is evident in the journey to Aug 2025. We break out some numerical UST deltas in the boxes.
There was a lot of bear steepener action from the end of 2023 into the summer of 2024 and fresh bouts of the same after the big rally in the fall of 2024. The Sept 2024 easing gyrations will make it hard to take much for granted this time after Sept 2025 with much higher, sweeping tariff policies and an ongoing debate over a cyclical slowing in the mix of variables.
The tariff court action could change the market handicapping on steepener risk but needs SCOTUS to weigh in. The early assumption would be that there will be higher supply to deal with as the massive deficit is held up against lower tax revenue from tariffs. Trump will have lost his Godfather ability to pull out the IEEPA big gun for tariff and trade deal leverage (“your signature is on the page or…”).
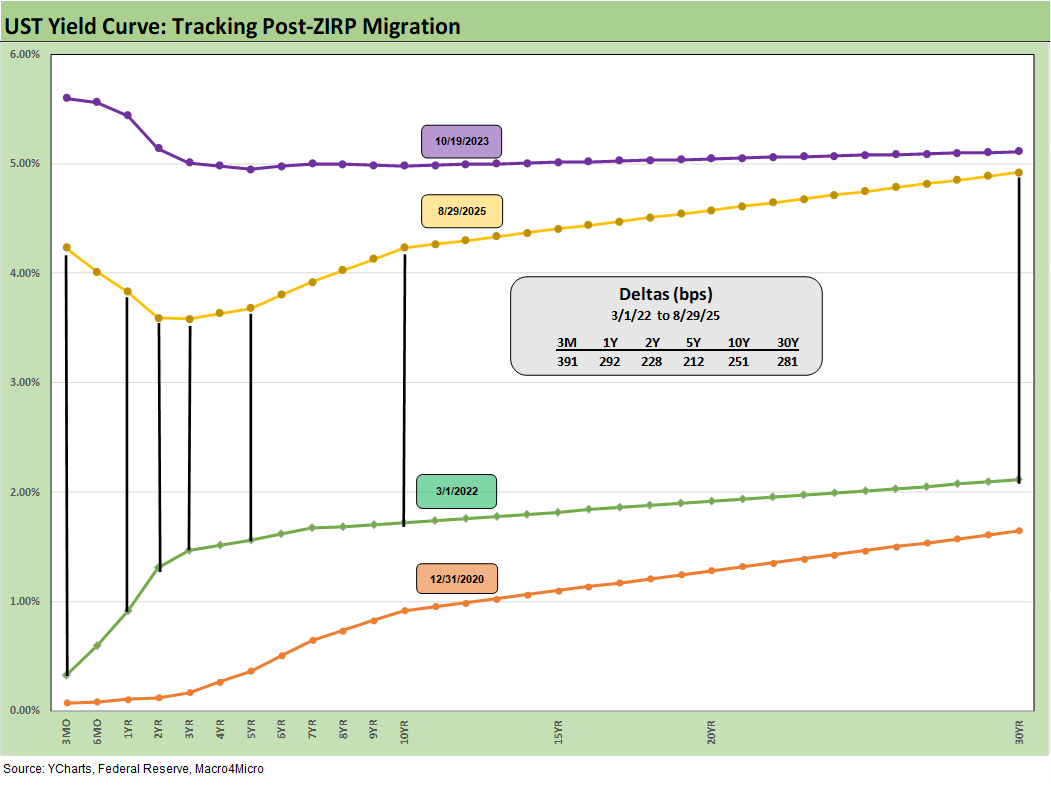
We drop in the above chart to frame the UST deltas since March 2022 when ZIRP ended and the tightening cycle began. It offers a reminder that we had a major move out to Oct 2023 and a smaller move to Aug 2025 from Sept 2024 (see prior chart for Sept 2024). The past year kept the long duration UST ETF (TLT) under pressure even with the positive YTD 2025 performance for bonds (see Footnotes & Flashbacks: Asset Returns 8-29-25).
The macro picture gets an important payroll number this coming week. This past week saw a bump in the second estimate of 2Q25 GDP, which saw personal consumption expenditures (PCE) up to a still weak +1.6%. That is not strong but beats the +0.5% line in 1Q25. The headline GDP of +3.3% has more of the major distortions we saw in 1Q25 with net exports of goods and services adding +4.95% and private inventories down -3.29% (see 2Q25 GDP: Second Estimate, Updated Distortion Lines 8-28-25).
Overall, the PCE price index data this past week indicated inflation remains stubborn but is not climbing quickly even if uncomfortably above the 2.0% target. The income and outlays data in the PCE release indicated the consumer is solid even if weaker in services (see PCE July 2025: Prices, Income and Outlays 8-29-25).
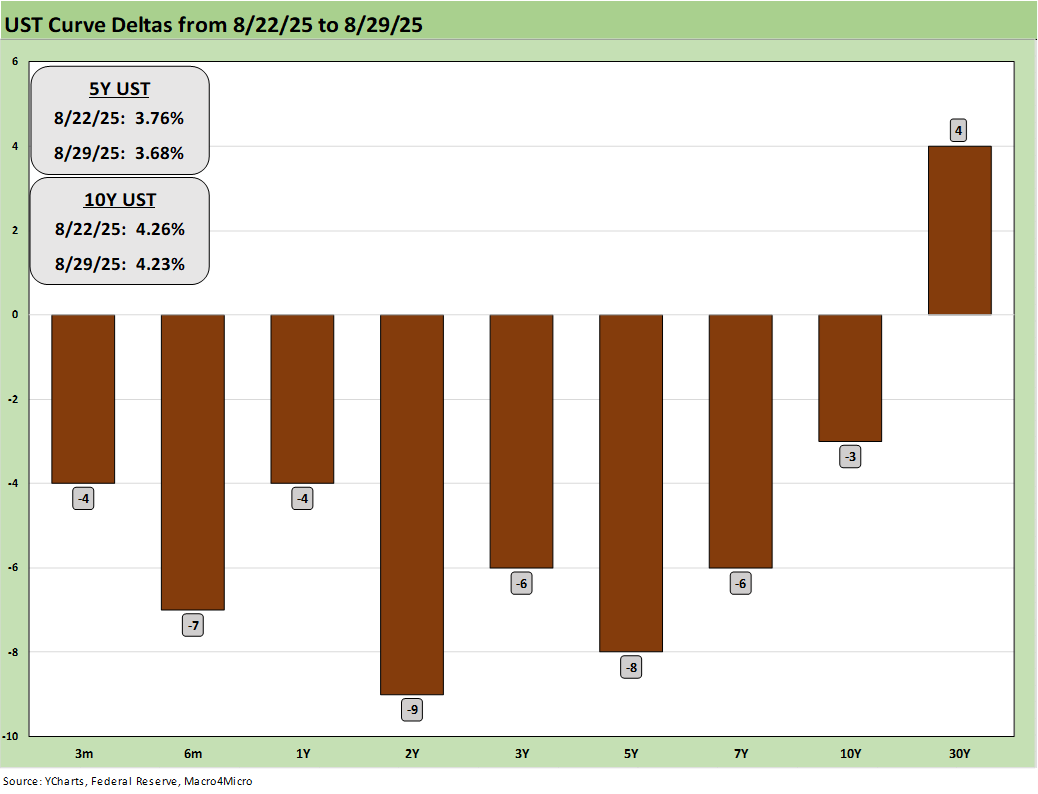
The above chart plots the 1-week UST deltas with the long end remaining under pressure. If a steady economic backdrop remains in place with lower tariffs, the steepening risk should have less inflation to trade off against bigger deficit numbers to contend with on UST supply fears.
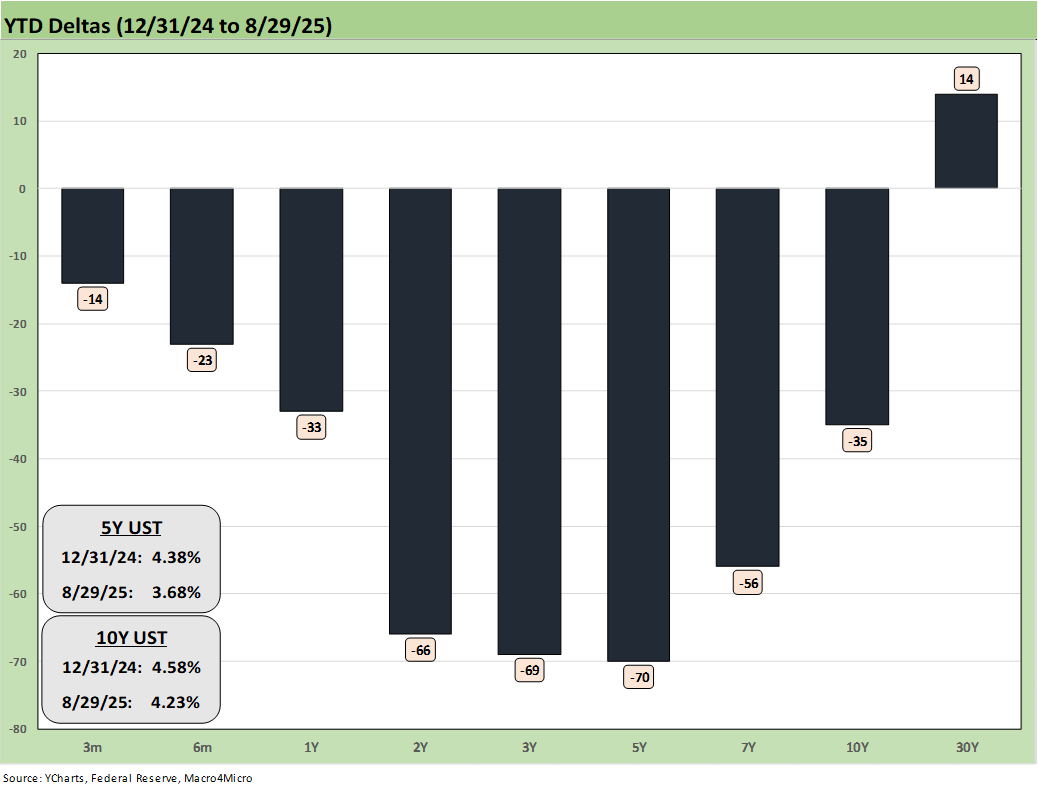
The YTD UST yield curve deltas are broken out above. The bull steepener pattern has rewarded bonds, but the long end has been stubborn.
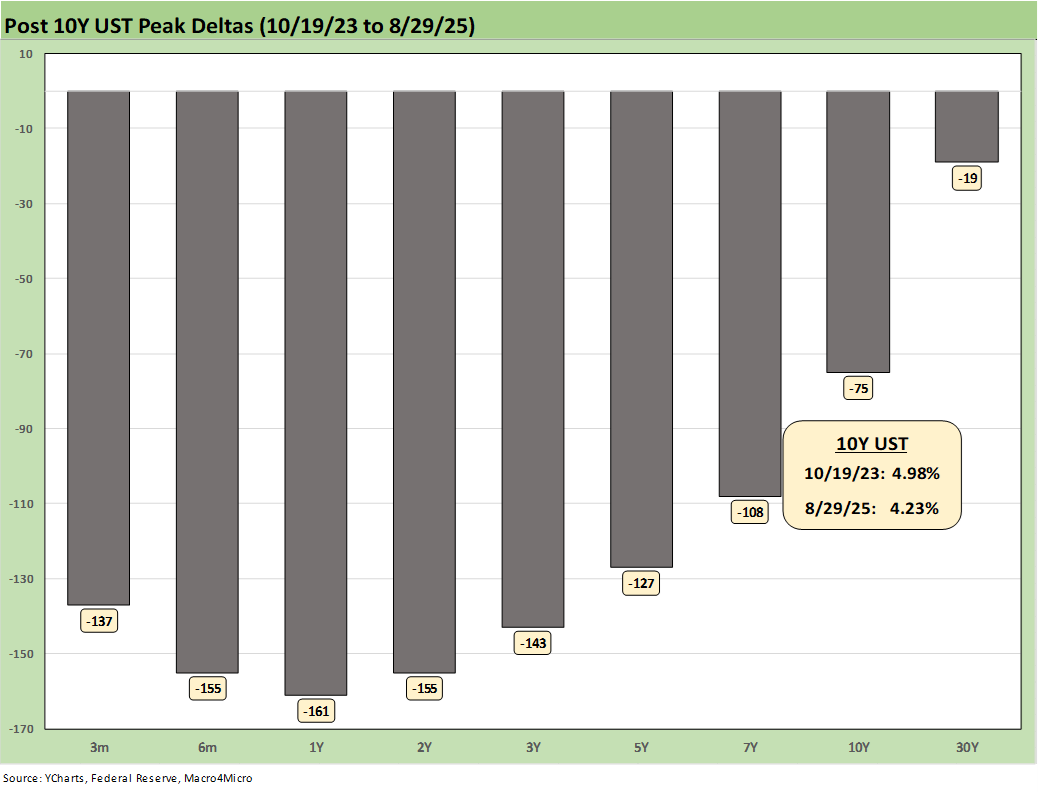
The above chart updates the running UST deltas from 10-19-23 through Friday. At the very least, it offers a reminder of what could go wrong if we get the wrong inflation outcomes from tariffs.
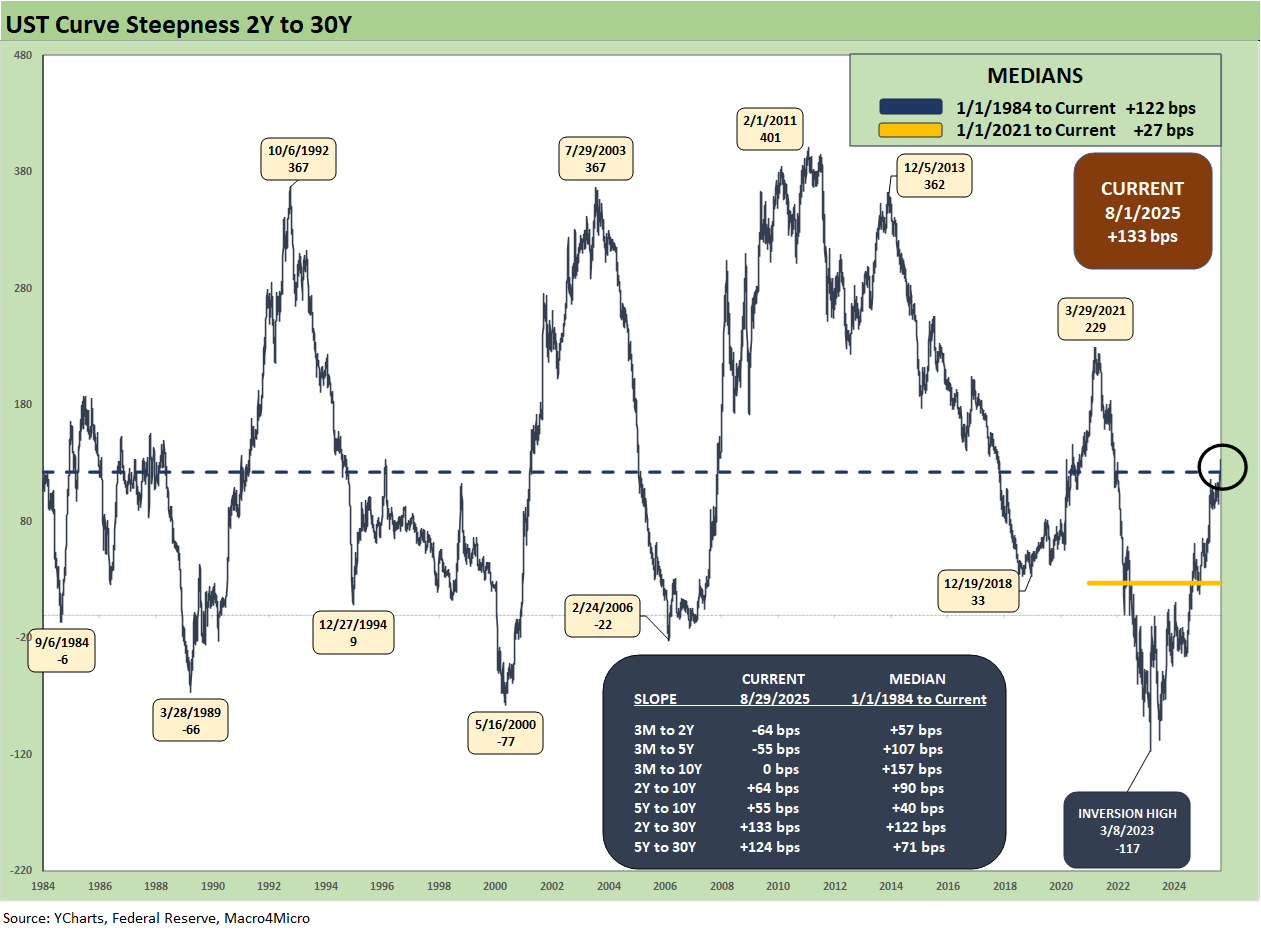
The above chart plots the 2Y to 30Y slope from 1984 for a read on the current upward sloping UST curve. The long-term median for 2Y to 30Y UST is upward sloping at +122 bps vs. the current slope of +133 bps.
We see a peak inversion in March 2023 of -117 bps after the 2Y to 30Y had hit a slope of +229 bps in March 2021 when the macro picture was bouncing off COVID in a ZIRP market. The imbalance of supply and demand for goods was coming into view, but there were enough COVID fears flying around that the FOMC did not get busy for another year.
We also include a box within the chart that details the other UST curve segment slopes that we watch along with their long-term medians. The front-end inversion from 3M is still the most anomalous part of the curve when you consider the fact that we are in an economic expansion and PCE inflation is inside the 3.0% line.
The challenge for the FOMC has been about tariffs. We had moved into a set of tariff policies never tried in the modern capital markets in a highly globalized economy with extensive supplier chain ties. There will still be a lot of new ground to cover to understand the structural effects ahead, but the latest court decisions completely change the math, the trade partner deal dynamics (China, Canada, Mexico) and many of the later targets of reciprocals (e.g. Brazil, low-cost Asian countries).
Unless SCOTUS follows their usual political “constitution be damned” path with it dangerously open-ended view of executive power, Team Trump will have lost the biggest tariff gun it has to bring to the trade knife fight.
The process in 2025 has been a very strange time in economic policy where the US alienates military allies to protect its national security. The fact that Section 232 is in the process of being invoked for furniture says a lot. In a national emergency you can always sit on the ground (bring a blanket).
See also:
Footnotes & Flashbacks: Asset Returns 8-29-25
Mini Market Lookback: Tariffs Back on Front Burner 8-30-25
PCE July 2025: Prices, Income and Outlays 8-29-25
2Q25 GDP: Second Estimate, Updated Distortion Lines 8-28-25
Avis Update: Peak Travel Season is Here 8-27-25
Durable Goods July 2025: Signs of Underlying Stability 8-26-25
Toll Brothers Update: The Million Dollar Club Rolls On 8-26-25
New Home Sales July 2025: Next Leg of the Fed Relay? 8-25-25
Credit Markets: Dull Week for Spreads 8-25-25
The Curve: Powell’s Relief Pitch 8-24-25
Footnotes & Flashbacks: Asset Returns 8-24-25
Mini Market Lookback: The Popeye Powell Effect 8-23-25
Existing Home Sales July 2025: Rays of Hope Brighter on Rates? 8-21-25
Home Starts July 2025: Favorable Growth YoY Driven by South 8-19-25
Footnotes & Flashbacks: Credit Markets 8-18-25
Herc Holdings Update: Playing Catchup 8-17-25
Mini Market Lookback: Rising Inflation, Steady Low Growth? 8-16-25
Industrial Production July 2025: Capacity Utilization 8-15-25
Retail Sales Jul25: Cautious Optimism in the Aisles 8-15-25
PPI: A Snapshot of the Moving Parts 8-14-25
CPI July 2025: Slow Erosion of Purchasing Power 8-12-25
Iron Mountain Update: Records ‘R’ Us 8-11-25
Mini Market Lookback: Ghosts of Economics Past 8-9-25
Macro Menu: There is More Than “Recession” to Consider 8-5-25
Mini Market Lookback: Welcome To the New World of Data 8-2-25
Happiness is Doing Your Own Report Card 8-1-25
Payrolls July 2025: Into the Occupation Weeds 8-1-25
Employment July 2025: Negative Revisions Make a Statement 8-1-25
Employment Cost Index 2Q25: Labor in Quiet Mode 7-31-25
2Q25 GDP: Into the Investment Weeds 7-30-25
2Q25 GDP: First Cut of Another Distorted Quarter 7-30-25
United Rentals: Cyclical Bellwether Votes for a Steady Cycle 7-29-25