
Footnotes and Flashbacks: Asset Returns 9-6-25
A good week for major equity benchmarks came along with a UST curve rally driven by weaker economic signals.


“I’ve had worse” (just not since 2020)
The very weak jobs numbers served as the week’s headliner, but the color from releases such as ISM manufacturing and the Beige Book did not help sentiment (see Payrolls Aug 2025: Into the Weeds 9-5-25, Employment August 2025: Payroll Flight 9-5-25).
The first negative jobs month since COVID and worst rolling 4 months since Trump 1.0 and COVID are hard to explain away to a rational fact-based audience. That is especially in the context of Trump’s description of payroll numbers a few days before Election Day 2024 that he called “depression-type numbers.” Trump was a BLS fan that month (see Mini Market Lookback: Job Trends Worst Since COVID 9-6-25).
Some favorable news from mega tech bellwethers brought a double-digit return week from Alphabet (not required to sell Chrome) and Broadcom (banner earnings) that helped wag the NASDAQ into the top quartile while Midcaps also made it into the top tier with the Russell 2000 just missing. We saw duration risk as a big winner this week with the long duration UST ETF (TLT), IG bonds (LQD), and EM Sovereign (EMB) all in the top quartile for weekly returns in our 32 benchmarks and ETFs.
This week brings CPI and PPI, and the real tariff story will be in the sequential MoM moves by product lines more than the headline total. The big debate on the other side of the CPI release is the FOMC meeting and whether the last major inflation data point could move the Fed into a more aggressive easing mode with such poor jobs numbers. Does the FOMC need the SCOTUS IEEPA decision first to be bolder in easing?
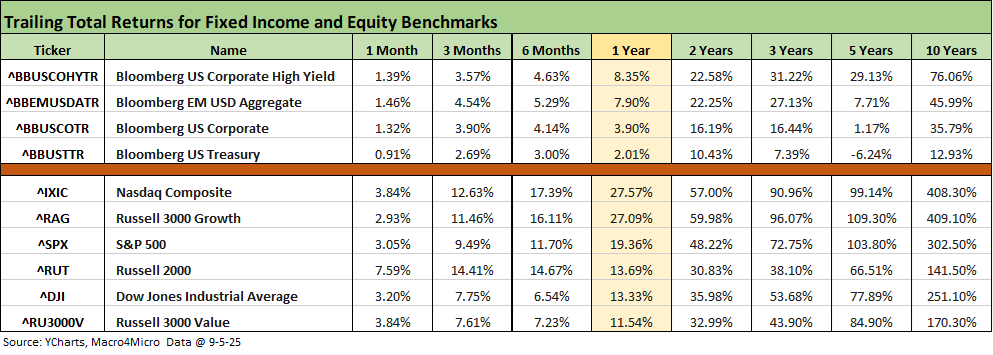
The above table updates the running returns across time horizons for the debt and equity benchmarks we update each week. We again see all positive numbers across the lines until we get to the 5-year returns on UST, where the -6.2% captures the tightening cycle, upward shift and steepening out the curve.
There is no question that the prior month was a good one and the rolling 3 months exceptional by any standards as the bounce of the post-Liberation Day sell-off remains in place. The 6-month run in equities is also impressive.
The trailing 1-year is more mixed for debt as the yield curve has been wagged by a mix of the FOMC holding the line in the face of tariff worries and the massive US budget deficits that require record demand to meet record supply. We look at those issues in more detail in our separate weekly commentary on the UST curve to be published later.
The rolling return visual
In the next section, we get into the details of the 32 ETFs and benchmarks for a mix of trailing periods. Below we offer a condensed 4-chart view for an easy visual on how the mix of positive vs. negative returns shape up. This is a useful exercise we do each week looking for signals across industry groups and asset classes.
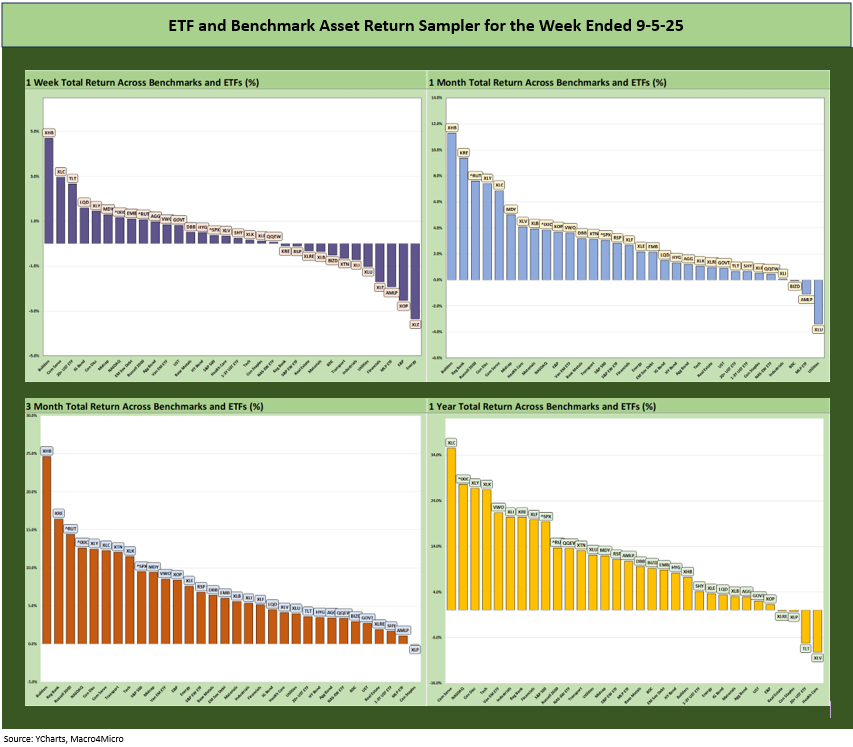
The good run of asset returns from 3 months to 1 year reflect a mix of strength across so many industries that are only now starting to feel the aftereffects of the tariff policies in a more meaningful way. Earnings growth and the consumer sector habits are the two anchors of the economy we cover in our GDP reviews each quarter and the 2 revisions that accompany each quarter (see 2Q25 GDP: Second Estimate, Updated Distortion Lines 8-28-25).
Right behind GDP growth is household consumption (PCE) at 68% of GDP. How PCE trend plays into broader cyclical and secular performance are reflected in Gross Private Domestic investment at around 18% of GDP. When the market started to struggle back in 2019, Powell and the FOMC rode to the rescue when private investment and exports had been flagging.
In the latest wave of releases, the problems appear to be emanating from the consumer sector as we see in the PCE lines in GDP releases. We did see some relief in the recent PCE/Income and Outlays release, but the jobs situation means consumer risks are now rising (see PCE July 2025: Prices, Income and Outlays 8-29-25).
The Magnificent 7 heavy ETFs…
Some of the benchmarks and industry ETFs we include have issuer concentration elements that leave them wagged by a few names. When looking across some of the bellwether industry and subsector ETFs in the rankings, it is good to keep in mind which narrow ETFs (vs. broad market benchmarks) get wagged more by the “Magnificent 7” including Consumer Discretionary (XLY) with Amazon and Tesla, Tech (XLK) with Microsoft, Apple, and NVIDIA, and Communications Services (XLC) with Alphabet and Meta.
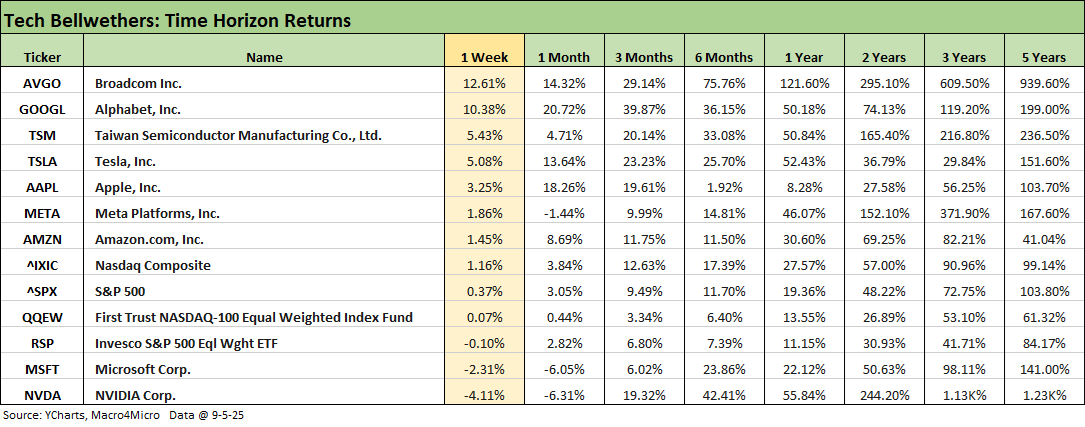
We looked at the 1-week numbers already in our Mini Market Lookback: Job Trends Worst Since COVID (9-6-25). There will come a point when the AI-based valuations will face a challenge on multiples as markets question where the value generation will come at the end of that customer chain. But that clearly has not shown up yet.
Whether we have seen this movie before (1999) or we truly are in an all-new world going through dramatic functional changes in how all manufacturing and services operate is going to be a high-level, intense debate into 2026. In the meantime, AI-based applications do not make the steel tariff or the aluminum tariff lower or the labor supply larger or the household income level materially higher.
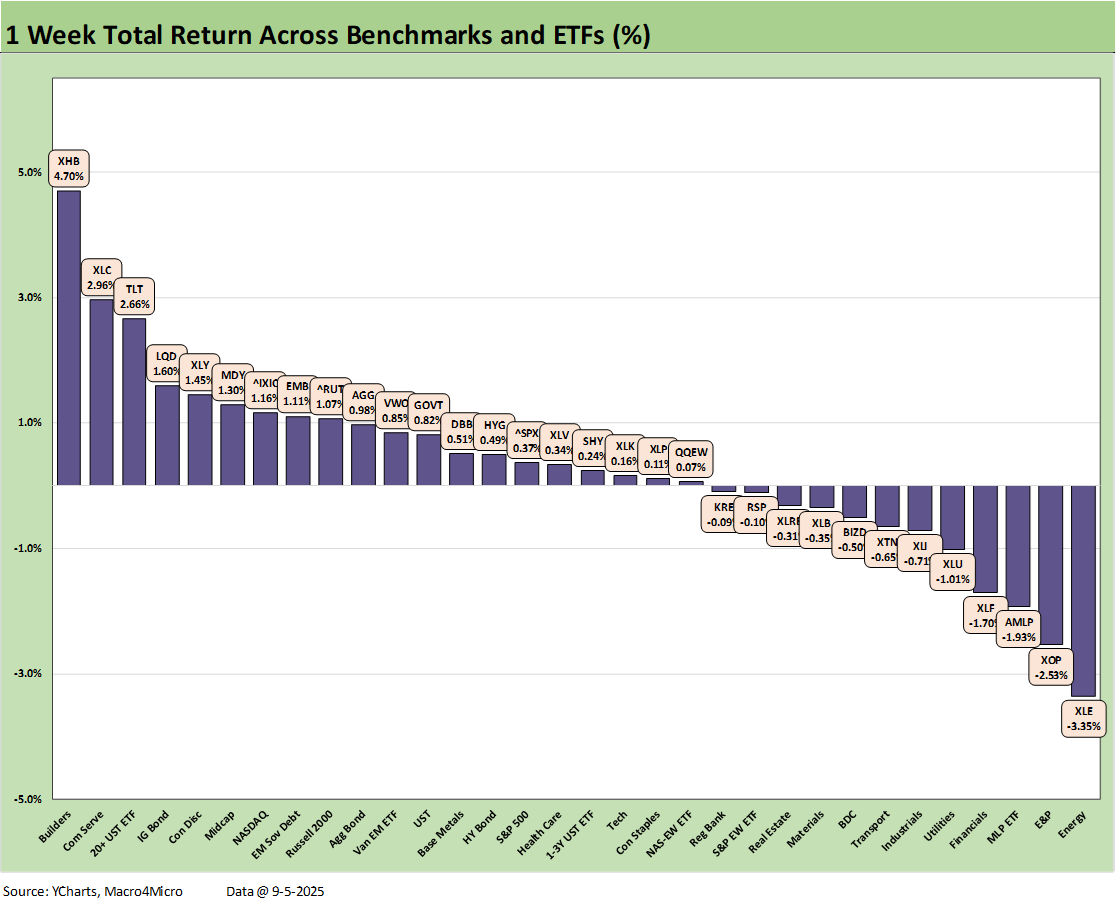
We looked at the 1-week return profile across the 32 benchmarks and ETFs already in our Mini Market Lookback: Job Trends Worst Since COVID (9-6-25). The score of 20-12 was not impressive but some standouts such as Homebuilders (XHB) have been riding high since the lengthy pummeling that started in 4Q24 after a running year where XHB was the top performer for the trailing LTM time period ending 3Q24.
We also saw duration winning top quartile positions with TLT, LQD, and EMB in the top tier. With XLE, XOP and AMLP in the bottom 3 slots, we also got a reminder of how oil and gas has kept headline inflation in check.
When CPI reports this week and the same for PPI, the exercise will be about sequential trends across any product line that would be influenced by the Trump tariff program whether within food, durables, nondurables, or services facing operating cost pressure. More inflation signals will make the steepening risk loom larger since the jobs picture is going to trigger a natural response over at the Fed under its dual mandate. As we saw in Sept 2024 the UST slope can flatten or steepen quickly.
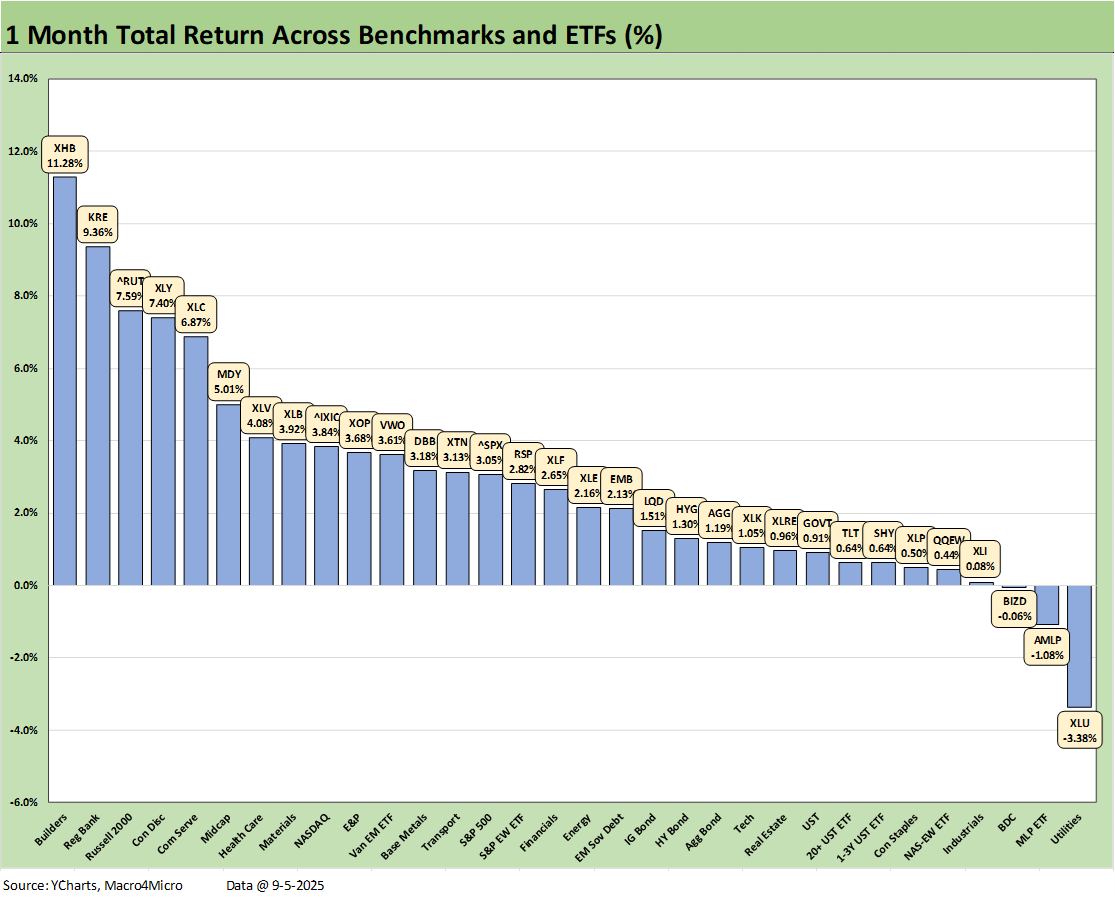
The 1-month time horizon weighed in with a 29-3 score. We see 2 bond ETFs in negative range (TLT, SHY) as both long UST and short UST lagged and landed in the bottom quartile. The remaining 5 bond ETFs landed in the third quartile. In absolute terms, these numerical returns in the third quartile make for a respectable month.
For the major equity benchmarks, it was a good sign for investor confidence in breadth that the small cap Russell 2000 (RUT) and Midcaps (MDY) made it into the top quartile with the large cap NASDAQ and S&P 500 in the second quartile. With Homebuilders (XHB) a strong #1 and Regional Banks #2, both of those played into smaller cap indexes. Among notable underperformers, we see Utilities (XLU) struggling a bit of late even as it remains in the top quartile YTD.
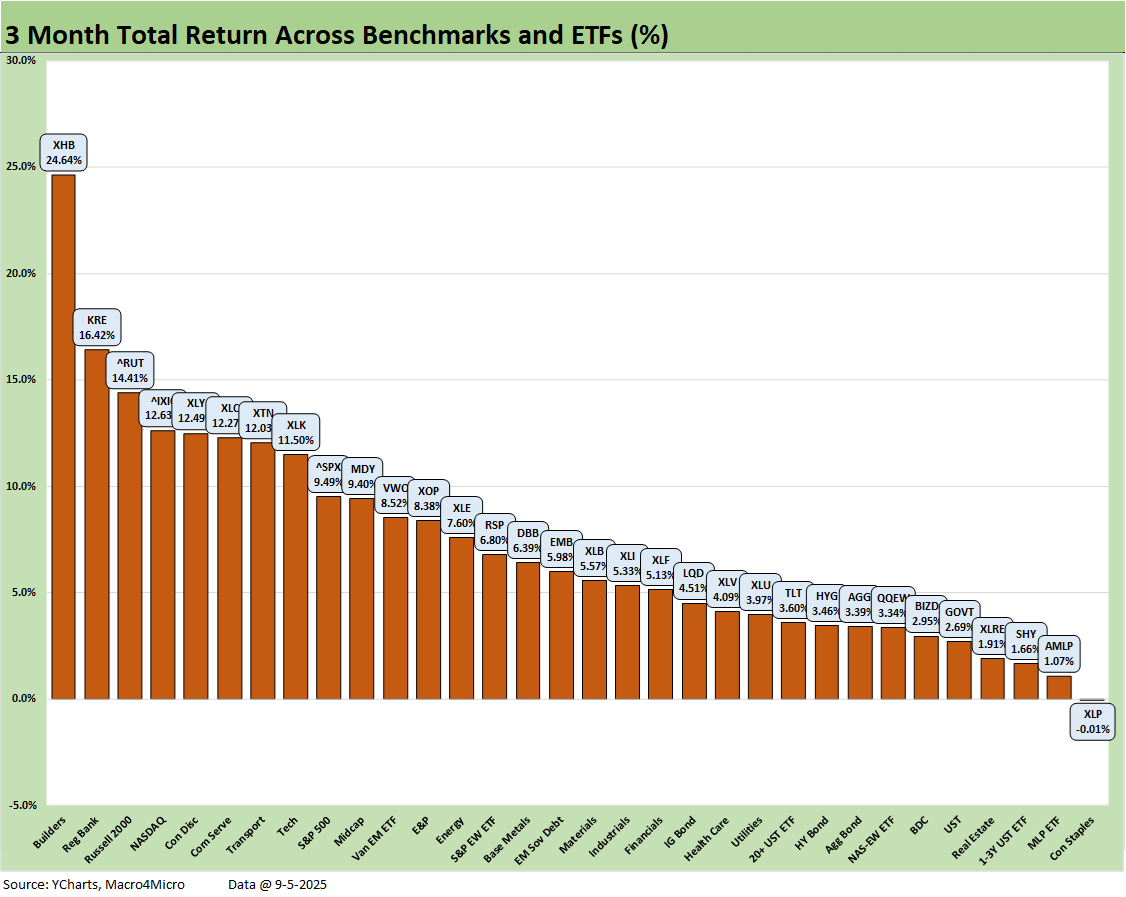
The running 3-month results just missed a shutout at 31-1 as the defensive Consumer Staples ETF (XLP) barely missed a positive return. We see Homebuilders (XHB) mounting an impressive rally at +24.6% and Regional Banks (KRE) at #2 turning in a solid rolling 3-month run at +16.4%. The main outlier in the top quartile mix was Transport (XTN) at #7 as the freight and logistics chaos is in part calming down (for now) with XTN one of 2 negative line items YTD with E&P (XOP).
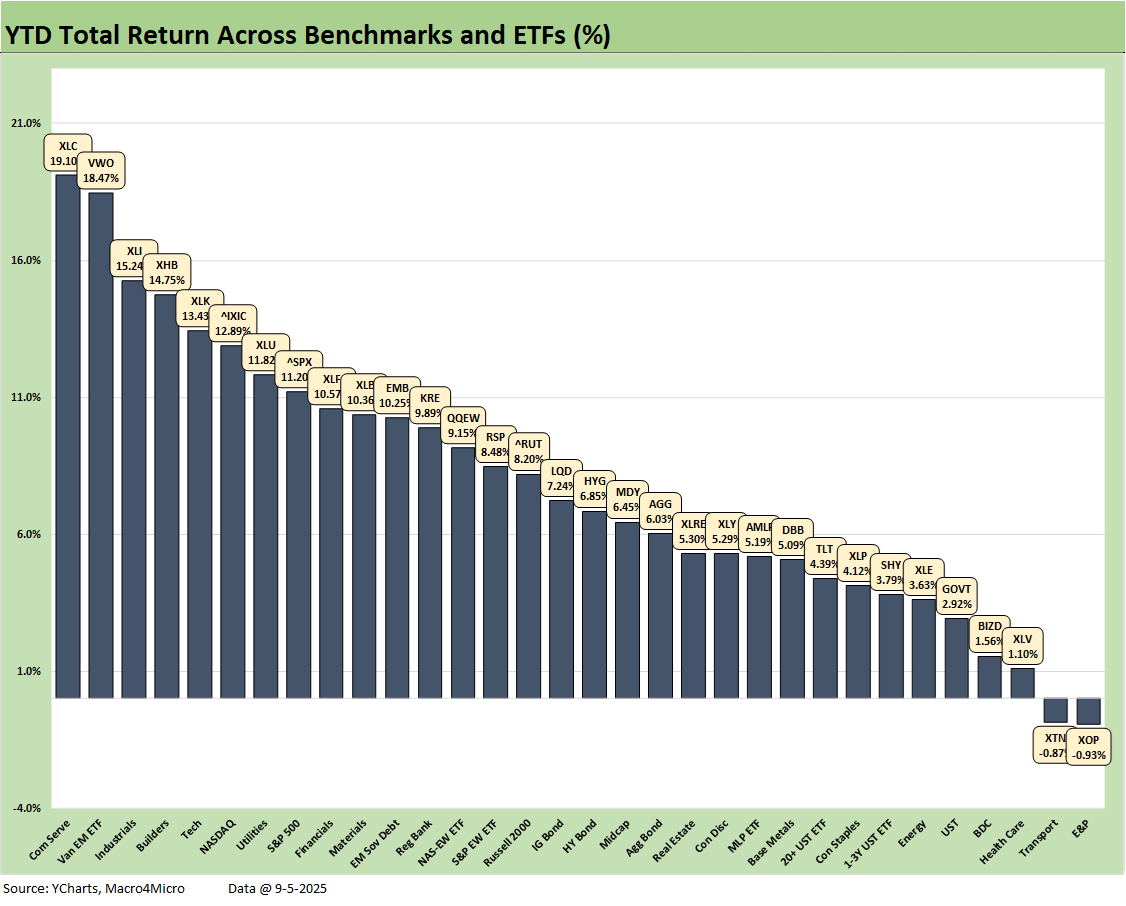
The YTD returns weigh in at 30-2 with Transports (XTN) and E&P (XOP) as the only two lines slightly in negative range but inside the -1.0% line. We see all 7 bond ETFs in positive range with 2 in the second quartile (EMB, LQD), 3 in the third quartile (HYG, AGG, TLT) and 2 in the bottom quartile with SHY and GOVT.
The top quartile was led by tech-centric lines with Communications Services (XLC) at #1, Tech (XLK) at #5, and NASDAQ at #6. On a positive note for cyclical balance, Industrials (XLI) was #3, Homebuilders (XHB) at #4, and Utilities (XLU) at #7. The Mag 7 wags the S&P 500, which was #8 at the bottom of the top quartile at +11.2%. In contrast, the Equal Weight S&P 500 ETF (RSP) was down in the lower half of the second quartile at +8.5%.
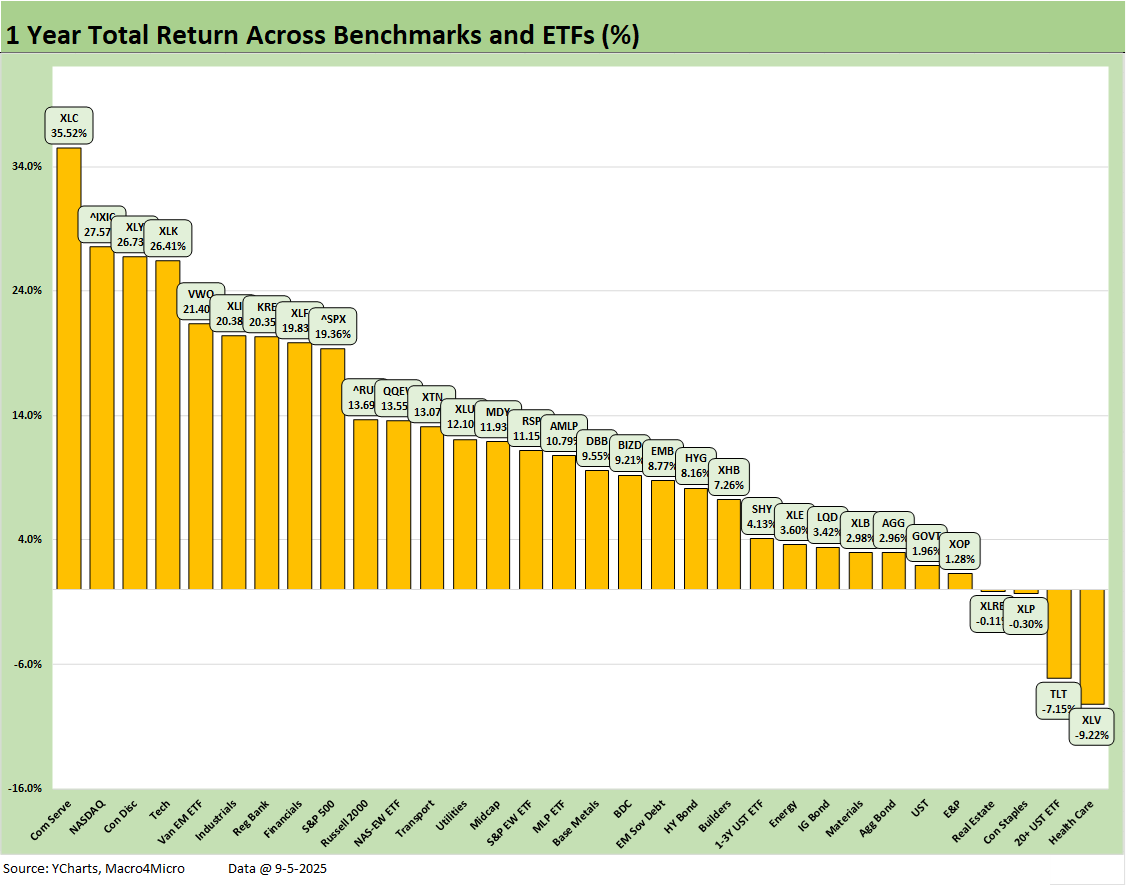
The 1-year returns stood at 28-4 again this week with the Health Care ETF (XLV) on the bottom at -9.2% and the long duration UST ETF (TLT) still in the red zone at -7.2%. We see minimally negative returns for Consumer Staples (XLP) and Real Estate (XLRE).
Communications Services (XLC) holds down #1, NASDAQ is #2, Consumer Discretionary (XLY) is #3, the Tech ETF (XLK) is #4 with EM Equities (VWO) at #5. In what is a reasonably diverse mix (if somewhat tech heavy) in the top quartile, we see Industrials (XLI), Regional Banks (KRE), and Financials (XLF) rounding out the quartile. The S&P 500 at a run rate of 18.4% over 1-year (11.2% YTD 2025) will need to finish 2025 in impressive fashion to match the 2024 and 2023 S&P 500 returns.
The year 2024 was Part Two of the best 2-year run in the S&P 500 since the late 1990s, so that sets a high bar (see Footnotes & Flashbacks: Asset Returns for 2024 1-2-25). The S&P 500 return of +25% for 2024 (26% 2023) and more than double that for the cumulative 2 years (2023 through 2024) will be very hard to match in 2025-2026. The S&P 500 will need another 13.8% in the time remaining to get to 25%, In other words, the S&P 500 needs to finish the remaining period (less than 4 months) with higher returns than the Trump 2.0 market has generated in over 8 months in 2025. It’s possible, but that requires stabilization of the economy and a very friendly Fed. Of course, maybe the new BLS director will offer some helpful data.
That market reality – combined with the recent weak job performance - undermines Trump’s theme music of “the country was dead 8 months ago.” Only someone whose red hat is on too tight would believe that (show of hands?). We would also highlight those 2023-2024 numbers were generated at higher interest rates under Biden.
Recession debates continue to unfold in the markets, but we still see a recession scenario as hard to get to in the fall. The period since the early 2020 COVID recession has not seen the US economy come close to a recession. That COVID recession in early 2020 came after the longest recovery in US history.
As we have covered in earlier commentaries, it takes a lot to drive a recession (see Macro Menu: There is More Than “Recession” to Consider 8-5-25). Only two Presidents the last 50 years have served out their terms without a recession period – Clinton and Biden. The wild economic, capital markets, and banking system issues were stories unto themselves and the geopolitical and systemic events that contributed to those recessions were also extraordinary.
See also:
Mini Market Lookback: Job Trends Worst Since COVID 9-6-25
Payrolls Aug 2025: Into the Weeds 9-5-25
Employment August 2025: Payroll Flight 9-5-25
JOLTS July 2025: Job Market Softening, Not Retrenching 9-3-25
Hertz Update: Viable Balance Sheet a Long Way Off 9-3-25
Credit Markets: Will the Heat Matter? 9-1-25
The Curve: Risk Tradeoff - Tariffs vs. UST Supply 9-1-25
Mini Market Lookback: Tariffs Back on Front Burner 8-30-25
PCE July 2025: Prices, Income and Outlays 8-29-25
2Q25 GDP: Second Estimate, Updated Distortion Lines 8-28-25
Avis Update: Peak Travel Season is Here 8-27-25
Durable Goods July 2025: Signs of Underlying Stability 8-26-25
Toll Brothers Update: The Million Dollar Club Rolls On 8-26-25
New Home Sales July 2025: Next Leg of the Fed Relay? 8-25-25
The Curve: Powell’s Relief Pitch 8-24-25
Mini Market Lookback: The Popeye Powell Effect 8-23-25
Existing Home Sales July 2025: Rays of Hope Brighter on Rates? 8-21-25
Home Starts July 2025: Favorable Growth YoY Driven by South 8-19-25
Herc Holdings Update: Playing Catchup 8-17-25
Mini Market Lookback: Rising Inflation, Steady Low Growth? 8-16-25
Industrial Production July 2025: Capacity Utilization 8-15-25
Retail Sales Jul25: Cautious Optimism in the Aisles 8-15-25
PPI: A Snapshot of the Moving Parts 8-14-25
CPI July 2025: Slow Erosion of Purchasing Power 8-12-25
Iron Mountain Update: Records ‘R’ Us 8-11-25Mini Market Lookback: Ghosts of
Economics Past 8-9-25
Macro Menu: There is More Than “Recession” to Consider 8-5-25
Mini Market Lookback: Welcome To the New World of Data 8-2-25