
The Curve: The Road to Easing has been Long.
The home stretch to the FOMC meeting starts with CPI and PPI this week while the SCOTUS appeal on IEEPA lurks as a complicating variable.


I’m tired. I think I’ll ease now.
The weak jobs numbers and growing consensus that there is more payroll weakness ahead get more interesting with the setbacks in court for tariffs and Appeals Court decision. A rare setback for Trump at SCOTUS would give even more ammo for easing in Sept and 4Q25 beyond the 2 expected (see Mini Market Lookback: Job Trends Worst Since COVID 9-6-25, Mini Market Lookback: Tariffs Back on Front Burner 8-30-25).
The market faces another test with CPI and PPI, and the focus on the inflation impact will be more about gauging CPI on a MoM basis by product line. The White House demand for 300 bps (during the “greatest 8 months in Presidential history”) will get louder as the damaging tariff impacts become more obvious in payroll planning and pricing along the product lines. “Tariff cost mitigation strategies” show up in hiring/firing planning.
The big UST move lower on Friday after the jobs numbers fueled a fresh rally in mortgages down into a 6.2% handle range that will bode well for loosening up some existing home sales and giving homebuilders more opportunity to drive volumes with mortgage incentives well into the 5% handle range. The 10Y UST dipped just below the 4.1% line Friday and is dipping closer to 4.0% this morning as we go to print.
We update the 2Y to 10Y UST slope as it still is well inside the long-term median with some more supportive data needed to get the bull flattener crowd satisfied. The record UST supply and need for record demand (and then some) is still the reality with the “tariff refund” risk and loss of a hefty base of tariff revenue a swing factor in the forward deficit picture.
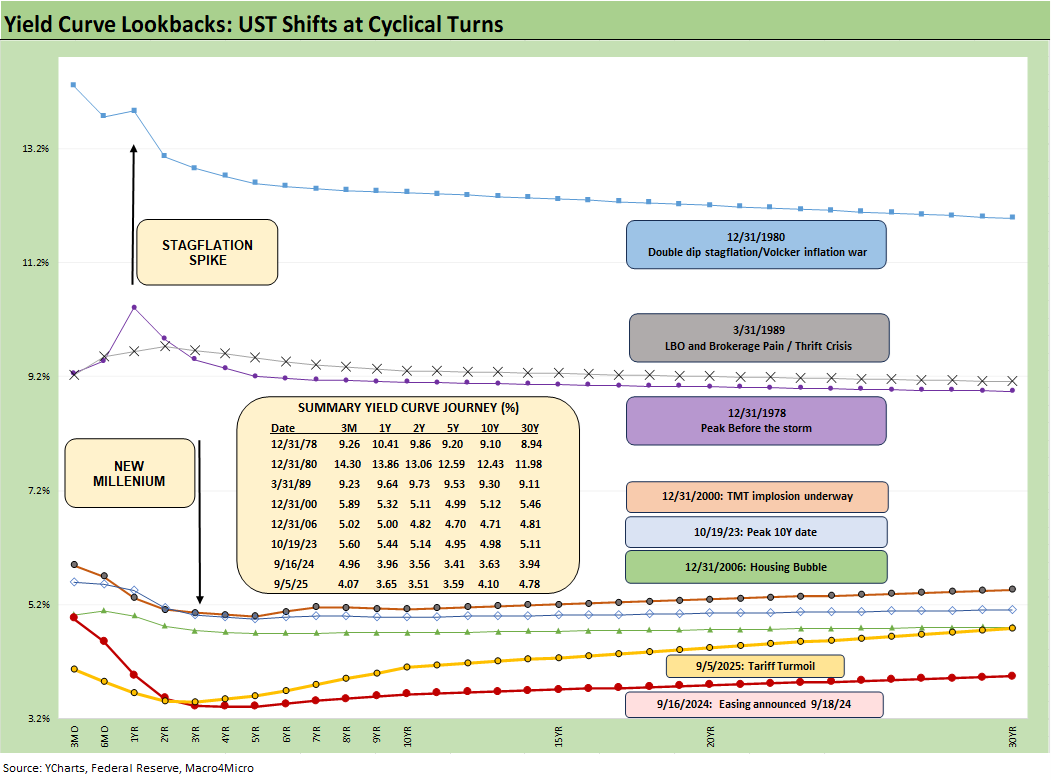
The above chart helps give historical context to the level and shape of the current yield curve vs. a range of market backdrops. The curves are plotted across some historical economic expansions and in some cases pending turns in the monetary cycle.
With the FOMC approaching some major decision points in mid-September, October and with the next SEP report, the stagflation debate is gearing up again with a big X factor in the pending SCOTUS decision on the legality of Trump’s IEEPA strategy. The last time a stagflation threat had to be considered was in the Carter inversion of 1978 above. The stagflation threat then showed up arrived by the Dec 1980 curve after a peak Misery Index of 22% in June 1980.
We like to remind ourselves and readers how low UST rates are today, so the demand for cuts still needs the context of what could go wrong with a tariff program without precedent in the modern capital markets. That remains a stagflation wildcard for the first time since Volcker. Worth highlighting is that the current 3M UST is notably lower than the pre-crisis, pre-ZIRP 3M UST levels.
The worst of the policy miscues across the Carter years included the inversion of 1978 into the high inflation backdrop of 1979 (Iranian Oil Crisis gets an assist along with a lot of industry deregulation). That brought the Volcker years and massive tightening policies. The experience of stagflation after the muted response during the mid to late 1970s in the face of inflation threats became a matter of religion for the Fed. The Volcker victory in the inflation war flowed into the1980s bull markets that saw a credit cycle peak in 1989 (note the 9.2% 3M UST).
Another useful period to ponder is the TMT cycle faltering in 2000 (on the way to a massive Greenspan easing in 2001). The current cyclical tech boom and valuations cannot escape looking back at the late 1990s. That period offers another case study in excess in equity and credit markets with the peak in 1999 (credit) and NASDAQ (2000). That soon led to excessive easing by Greenspan in 2001 and then into early 2004, in turn setting the table for the housing bubble peak in 2006. During the 2004 to 2007 period, leveraged derivative exposure and structured credit was out of control and counterparty risk was soaring.
The chart then jumps from 2006 to 2023, which takes the market beyond the crisis period and the ZIRP years and COVID. Both the post-credit crisis period and later COVID prompted the Fed to deliver a wave of market liquidity support and confidence building programs that helped save the capital markets, reopened the credit markets, reduced refinancing risk anxiety, and reduced the contingent liquidity risk profile of the banks.
The credit crisis period from late 2008 to the 2020 COVID crisis period brought plenty of QE and normalization distortions to the yield curve shape. The Fed’s dual mandate made that possible. The market could soon face new legislative threats in 2026 to that dual mandate based on commentary from Bessent and as discussed in Project 2025 (See Chapter 24). That will be a topic to tackle as we get closer to those ideas coming into play.
There are a lot of “What if?” scenarios that raise major structural risk and contingency planning fears if the Fed becomes a captive policy instrument of Team Trump. We got a taste with tariffs.
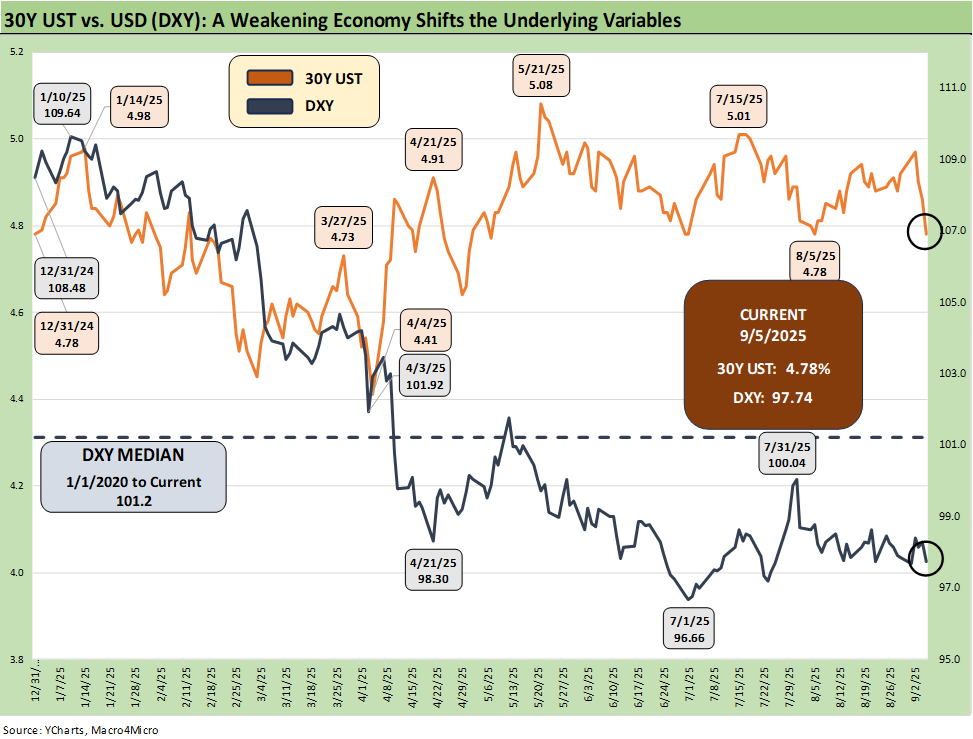
The above chart plots the recent trends in the 30Y UST vs. the dollar index (DXY) as the US dollar weakness throws another risk variable into the picture and poses a major risk factor for non-US buyers of UST.
This week saw a big move lower in the UST curve and the long bond as well with the jobs report. The US needs to attract record demand offshore to buy a record supply of UST, so the dollar matters. The DXY also ticked slightly lower.
Lower rates could be a catalyst for dollar weakness while political risk factors and governance quality are no longer non-factors in the US sovereign credit quality assessment. Record forward-looking deficits and the optics of political instability (military occupation of major cities by an authoritarian-leaning, confrontational leader) adds a negative element to the sovereign risk profile of the US that no rating agency would have the courage to flag.

I hate the smell of political instability. It weakens UST demand.
Mortgage rates and the curve rally. The Sept 2024 example…
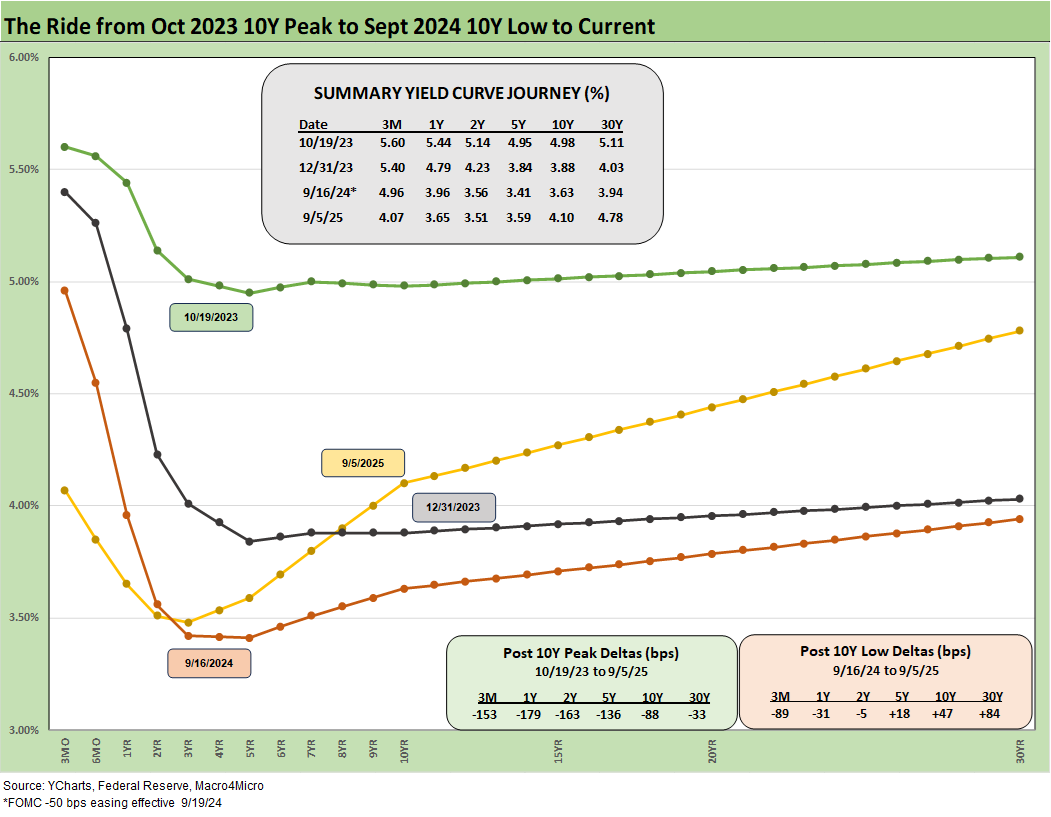
The above chart frames the shift from the Oct 2023 peak in the 10Y UST and then moves down across the bull flattener into year-end 2023. We then plot into the easing actions and rally of Sept 2024. Then came the ensuing bear steepener that is evident in the journey to Aug 2025. We break out some numerical UST deltas in the box.
This chart reminds us that the “ease and flatten” shapeshifting is hard to rely on in a market where the supply-demand of UST is tenuous and tariff impacts are hard to predict.
That economic chain reaction is also the case on the expense side for companies and how the companies react (hiring freeze? layoffs?). There is often a tendency to just debate the price impact on goods, but the guaranteed cost impact (buyers pay the cash tariff to customs) is also an economic event that begs a reaction in profit margins or in expense reduction elsewhere (note Friday’s jobs numbers).
There was a lot of bear steepener action from the end of 2023 into the summer of 2024 and fresh bouts of the same after the big rally in the fall of 2024. The Sept 2024 easing gyrations will make it hard to take much for granted this time after Sept 2025 with much higher, sweeping tariff policies and an ongoing debate over a cyclical slowing in the mix of variables. The opportunity to move quickly on transactions (existing or new) in housing will be interesting to watch. The optimism on rates and the pessimism on job security is an old-school dilemma.
The tariff court action ahead could change the market handicapping on UST steepener risk but needs SCOTUS to weigh in. One concern is that there will be a higher supply of UST to deal with the massive deficit. That is framed against lower tax revenue from tariffs if IEEPA loses. There could also be a need to give a very large refund as Bessent discussed over the weekend.
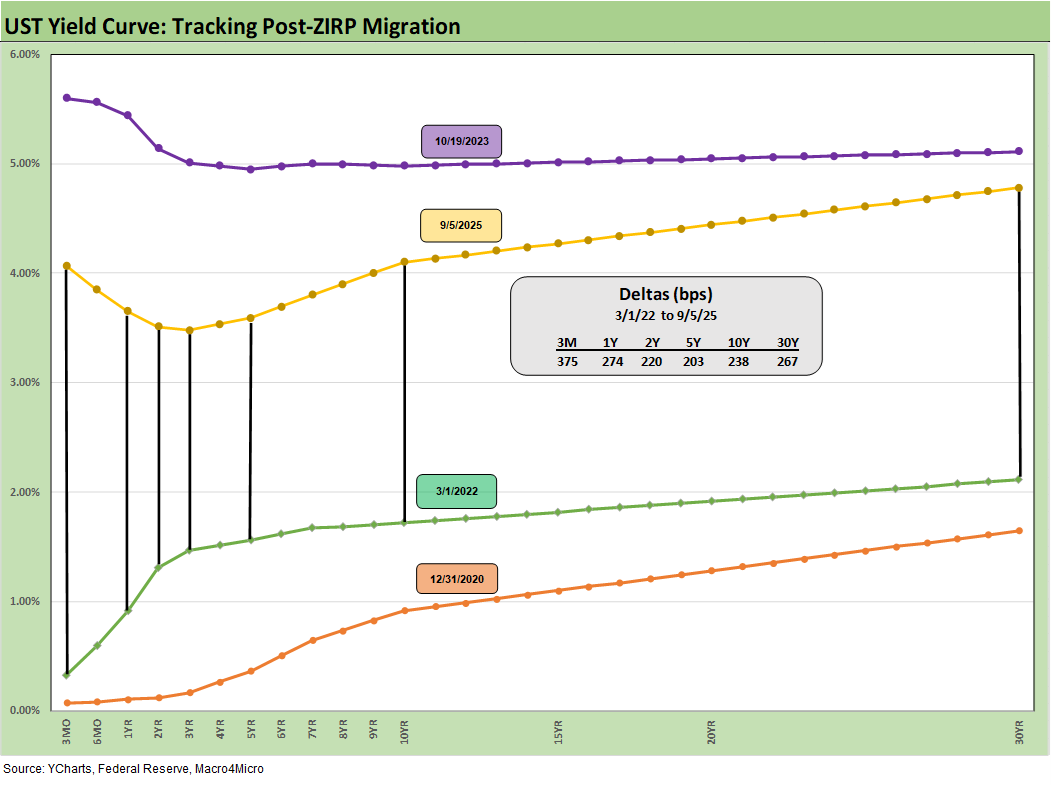
We drop in the above chart to frame the UST deltas since March 2022 when ZIRP ended and the tightening cycle began. It offers a reminder that we had a major move out to Oct 2023 and a smaller move to Aug 2025 from Sept 2024 (see prior chart for Sept 2024). The past year kept the long duration UST ETF (TLT) under pressure even with the positive YTD 2025 performance for bonds (see Footnotes and Flashbacks: Asset Returns 9-6-25).
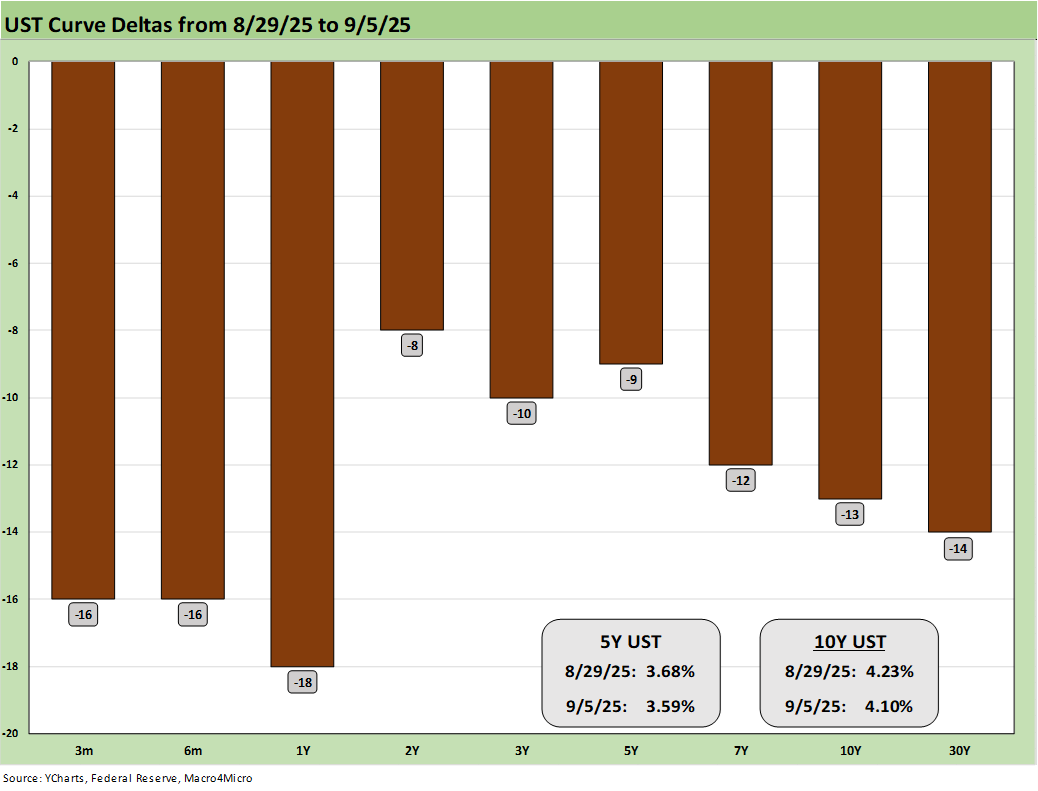
The above chart plots the 1-week UST deltas. If a relatively steady economic backdrop remains in place with lower tariff risk, the steepening risk will in theory diminish if paired with a slower economy. The FOMC will have less inflation anxiety to factor into decisions but the market will face a bigger deficit number to contend with on UST supply fears. As always, the Fed controls the short end and the market controls the long. The inflation impacts will still be substantial across the array of Section 232 tariffs if IEEPA gets struck down and the Section 301 game plan is the go-to strategy again. We will see record high postwar tariffs regardless.
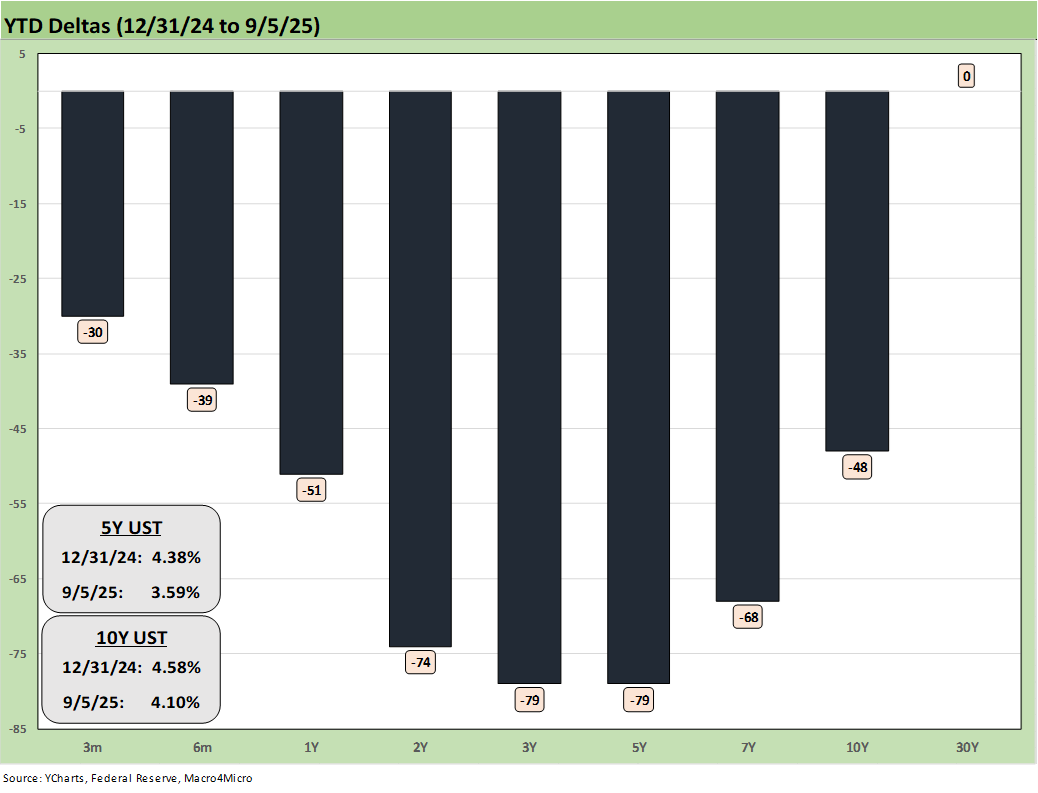
The YTD UST yield curve deltas are broken out above. The bull steepener pattern has rewarded bonds, but the long end has been more stubborn.
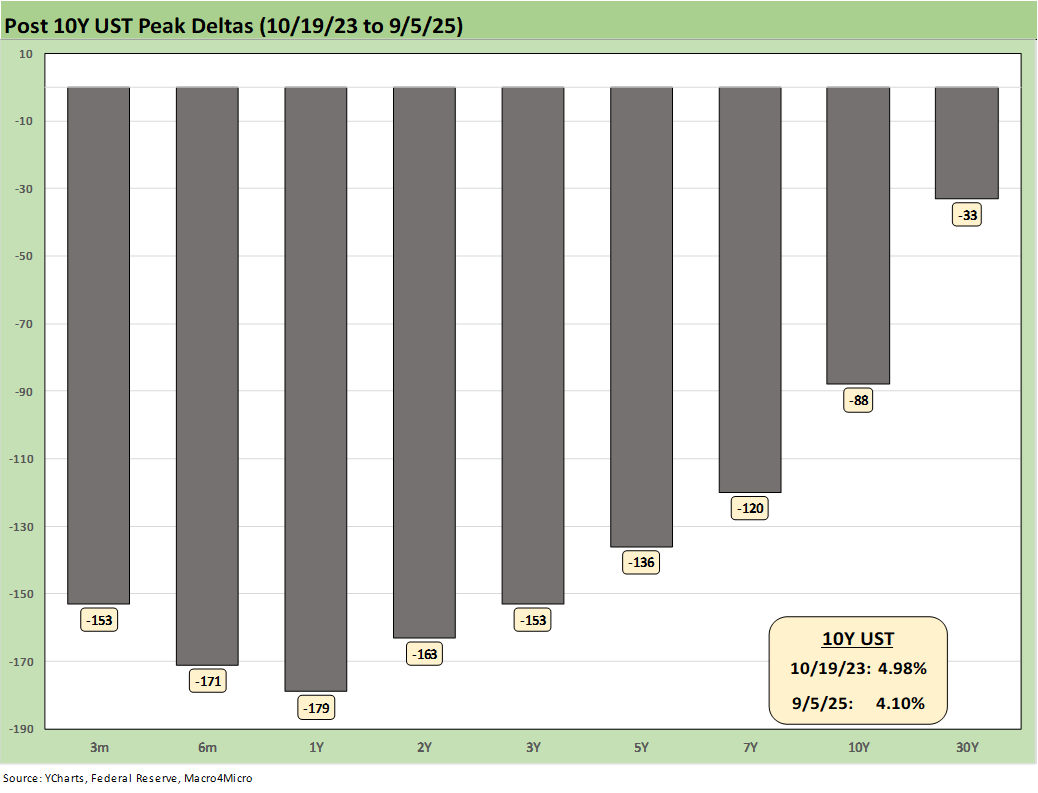
The above chart updates the running UST deltas from 10-19-23 through Friday. At the very least, it offers a reminder of what could go wrong if we get the wrong inflation outcomes from tariffs.
SCOTUS could follow its usual practice of doing whatever Trump wants and assigning virtually unchecked power to the executive branch. Another scenario is that SCOTUS agrees with the Appeals Court. In theory, the use IEEPA by Trump in substance could get freshly legislated in line with the Constitution. That might require going nuclear (ditching the 60-vote barrier and filibuster).
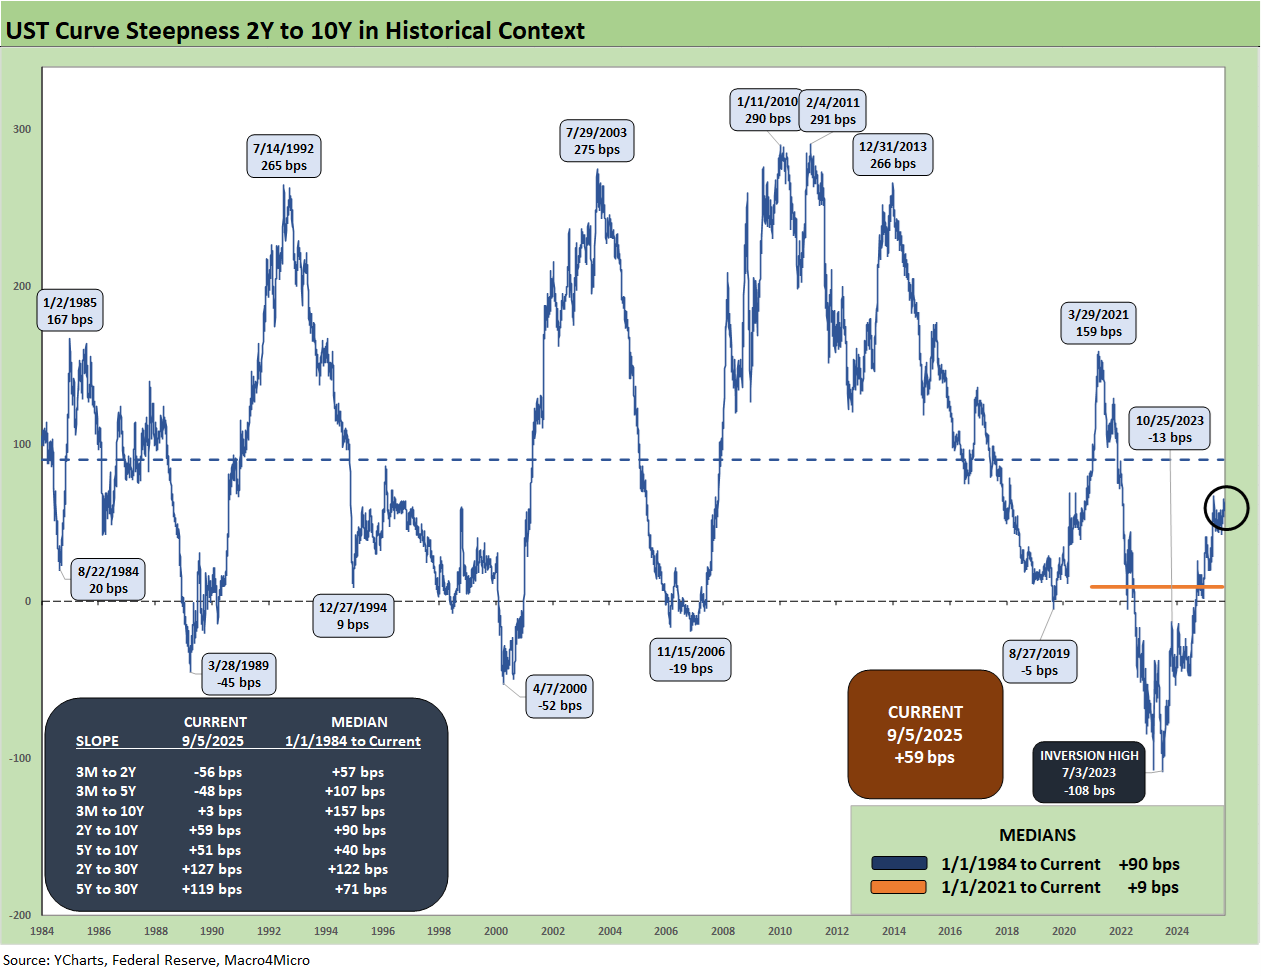
The above chart plots the 2Y to 10Y slope from 1984 for a read on the current upward sloping UST curve. The long-term median for 2Y to 10Y UST is upward sloping at +90 bps vs. the current slope of +59 bps.
We see a peak inversion in July 2023 of -108 bps after the 2Y to 10Y had hit a slope of +159 bps in March 2021 when the macro picture was bouncing off COVID in a ZIRP market. The imbalance of supply and demand for goods was flowing into inflation, but there were enough COVID fears flying around that the FOMC did not get busy for another year (March 2022).
We also include a box within the chart that details the other UST curve segment slopes that we watch along with the long-term medians. The front-end inversion from 3M is still the most anomalous part of the curve when you consider the fact we have been in an economic expansion (now slowing in 2025) with PCE inflation inside the 3.0% line. The 3M to 2Y UST inversion of -56 bps is starkly different from the post-1984 historical median of +57 bps. The 3M to 5Y inversion of -48 bps is a long walk from the +107 bps median.
The challenge for the FOMC has been heavily about tariffs. Trump has been moving the US into a set of tariff policies never tried in the modern capital markets in a highly globalized economy with extensive global supplier chain ties. There will still be a lot of new ground to cover to understand the structural effects ahead, but the latest court decision on IEEPA would completely change the math, the trade partner deal dynamics that are ongoing (China, Canada, Mexico) and many of the later targets of reciprocals (e.g. Brazil, low-cost Asian countries).
Trump’s promises of lower prices conflict directly with his economic policies. And that is showing up in the numbers. In such a case, the go-to plan is to attack the numbers. Realities at sea level will still be driven by the dismal science of economics. Political artistry of disinformation is for decision-makers to sort out.
See also:
Footnotes and Flashbacks: Asset Returns 9-6-25
Mini Market Lookback: Job Trends Worst Since COVID 9-6-25
Payrolls Aug 2025: Into the Weeds 9-5-25
Employment August 2025: Payroll Flight 9-5-25
JOLTS July 2025: Job Market Softening, Not Retrenching 9-3-25
Hertz Update: Viable Balance Sheet a Long Way Off 9-3-25
Credit Markets: Will the Heat Matter? 9-1-25
The Curve: Risk Tradeoff - Tariffs vs. UST Supply 9-1-25
Mini Market Lookback: Tariffs Back on Front Burner 8-30-25
PCE July 2025: Prices, Income and Outlays 8-29-25
2Q25 GDP: Second Estimate, Updated Distortion Lines 8-28-25
Avis Update: Peak Travel Season is Here 8-27-25
Durable Goods July 2025: Signs of Underlying Stability 8-26-25
Toll Brothers Update: The Million Dollar Club Rolls On 8-26-25
New Home Sales July 2025: Next Leg of the Fed Relay? 8-25-25
The Curve: Powell’s Relief Pitch 8-24-25
Mini Market Lookback: The Popeye Powell Effect 8-23-25
Existing Home Sales July 2025: Rays of Hope Brighter on Rates? 8-21-25
Home Starts July 2025: Favorable Growth YoY Driven by South 8-19-25
Herc Holdings Update: Playing Catchup 8-17-25
Mini Market Lookback: Rising Inflation, Steady Low Growth? 8-16-25
Industrial Production July 2025: Capacity Utilization 8-15-25
Retail Sales Jul25: Cautious Optimism in the Aisles 8-15-25
PPI: A Snapshot of the Moving Parts 8-14-25
CPI July 2025: Slow Erosion of Purchasing Power 8-12-25
Iron Mountain Update: Records ‘R’ Us 8-11-25
Mini Market Lookback: Ghosts of Economics Past 8-9-25
Macro Menu: There is More Than “Recession” to Consider 8-5-25
Mini Market Lookback: Welcome To the New World of Data 8-2-25
Thank you.
For anyone interested, here are my Aug CPI estimates:
https://open.substack.com/pub/arkominaresearch/p/aug-2025-cpi-estimate?r=1r1n6n&utm_campaign=post&utm_medium=web&showWelcomeOnShare=false