
Credit Markets: Spread Risk Lurks, but the World Waits
The past week did not get wagged by job headlines with the FOMC and the SCOTUS decision as the main events ahead.


Search and destroy mission on independent data ahead?
The ugly payroll release rolled up into the worst set of numbers since 2020 (including revisions of the prior two months) with negative June “adds” part of the worst 4-month stretch since Trump 1.0 (see Payrolls Aug 2025: Into the Weeds 9-5-25, Employment August 2025: Payroll Flight 9-5-25). The Beige Book and ISM Manufacturing color received a lot of attention pushing back on the theme of “Greatest 8 months in Presidential history.” The headwinds are in the numbers.
Just the concept of tariff risk mitigation strategies would signal caution on hiring and even be a catalyst for layoffs, shifts in product mix, caution on capex, and a defensive mindset generally with the massive decisions ahead by SCOTUS on the IEEPA ruling by the appeals court. Weaker jobs numbers should hardly be a surprise when PCE lines and GPDI investment lines are fading in GDP reports (see 2Q25 GDP: Second Estimate, Updated Distortion Lines 8-28-25).
The consensus on CPI for this week is relatively muted, but a closer look at the MoM trends by product group will be a useful exercise below headline and core CPI. The PPI trends also showed plenty of adverse sequential trends last month.
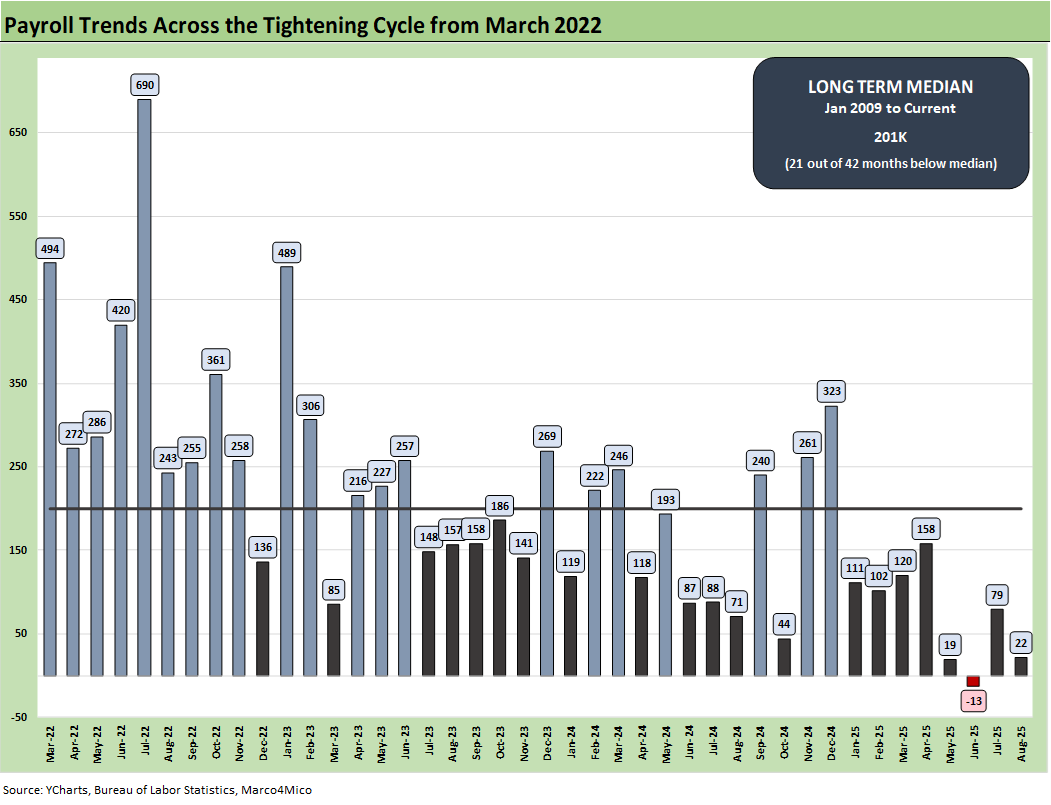
We thought we should lead with the jobs chart again to hammer home that the economic releases matter even if the panic is on at the White House and they want to discredit reported numbers and take closer control over the process and attack the providers. That is hardly a surprise and something we have been discussing since last year (see Happiness is Doing Your Own Report Card 8-1-25 and Payroll June 2024: The Race Gets Confusing 7-5-24).
Whether the topic was vote counts, FBI crime statistics, or economic releases, anything that disagreed with the story being delivered by Trump (now the White House), was derided and essentially dubbed as rigged. The data provider would be targeted and the data undermined. “Seller pays the tariffs” (as opposed to buyer pays customs) was a favorite as Trump spoke of “collecting hundreds of billions from selling countries.” The reality is that the US collected zero from those countries. This recent jobs release sent the White House into the false data theme spin again: “Next year, will have the real data” according to Trump.
Everyone is having their time with the Apocalypse Now visuals, and in the picture above we depict the special forces officer sent to “terminate with extreme prejudice” the command of Colonel Kurtz (Marlon Brando).
Termination with prejudice is a way of life in the purge-heavy Washington backdrop these days. It is not a great thing for expertise, independent thought, and quality of decision-making. That problem has already been in evidence in many departments at the top and now it is working its way into the BLS and BEA as well as the Fed.
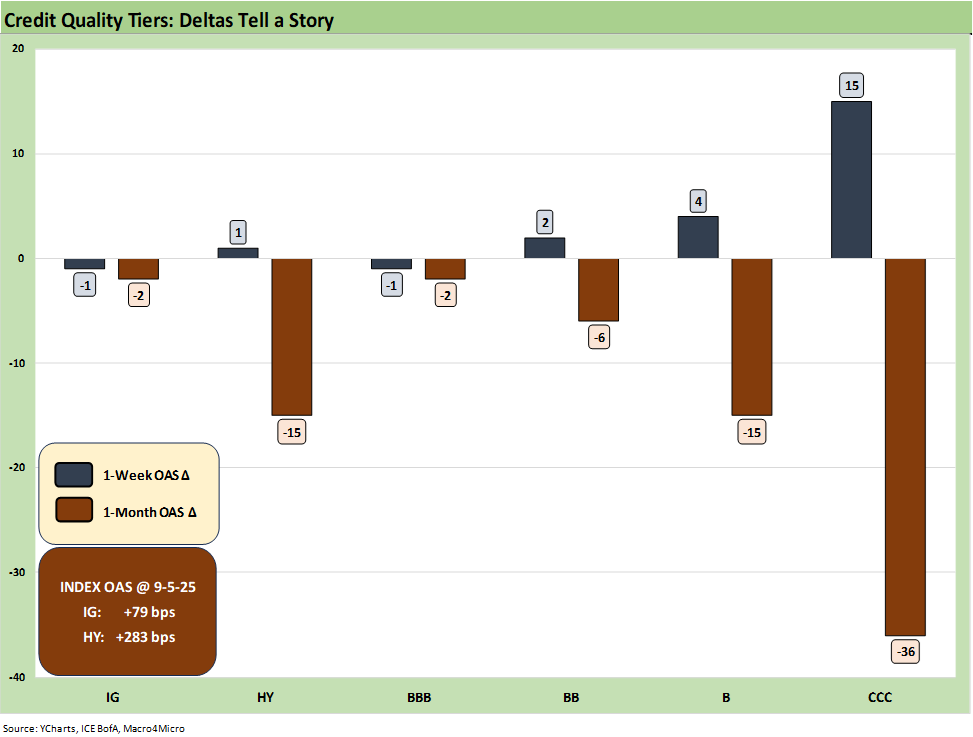
The above chart updates the 1-week and trailing 1-month spread deltas for IG and HY and from the BBB to CCC tiers. The risk pricing action was low on the week at the headline index levels with slight widening. The 1-month spreads show a clear tightening trend from the B and CCC tier but all flowing up into quality spread tightening with IG -2 bps tighter and HY -15 bps tighter. As we cover below, HY OAS remains in the June 2007 credit bubble zone for spreads.
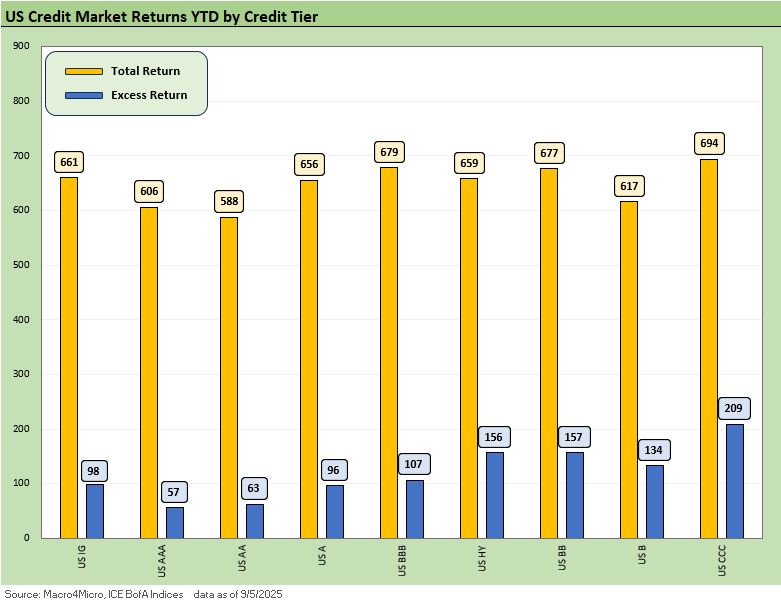
The above chart updates the YTD 2025 excess returns and total returns across IG and HY and the credit tiers. The support of the UST curve and spread compression is clearly reflected in the returns with the BB tier still the best positioned of the lot in the balance of credit risk and duration risk.
The CCC tier with its mix of coupons and shorter duration have framed up well in the bar chart, but then that begs the question of how much better the excess returns in the CCC and weak B range should be given the magnitude of the risks relative to the BBB and BB tiers. The risk-adjusted debate tends to get obscured by the discussion of what is the right metric to make that assessment.
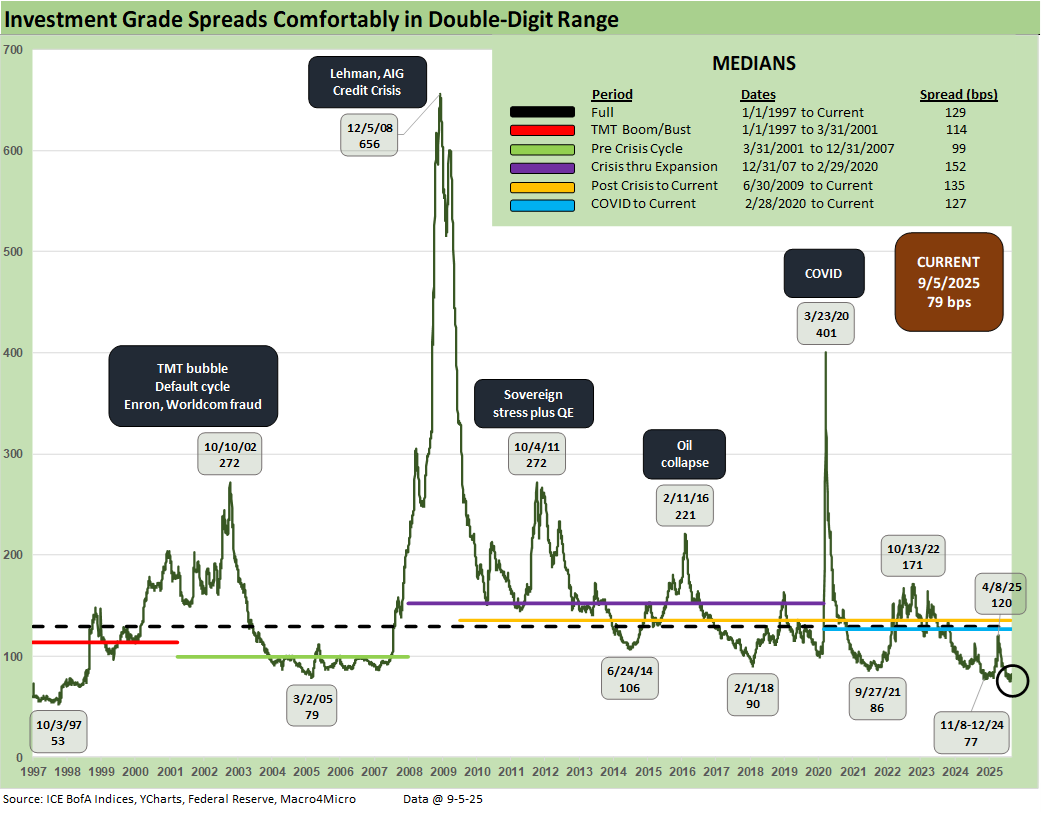
The above updates the multi-cycle spread history for IG as we see the wild swings across time when the banks were in harm’s way in 2008 and the heavy exposure to energy names whipsawed BBB energy in 2015 and early 2016.
The current +79 bps is just above the lows of late 2024 and the March 2005 levels just before the auto OEMs started taking a lot of heat with a GM warning in mid-March 2005. The record lows since 1997 were seen in early Oct 1997 just before the Asian Yankee bond market started to implode and the broader regional Asian crisis unfolded. Spreads in 1998 were infected and it had spread to other markets as 1998 saw a contagion effect hitting EM credit late in the year that also hit US HY valuations. That was the summer and fall of LTCM after the Russian default of Aug 1998.
A critical driver of IG spreads is always the banks and financials broadly, and the major banks are very sound at this point compared to past recession periods such as Dec 2007 to June 2009, which was an epic meltdown between banks and brokers. The TMT bubble years of 2000-2002, the infamous 1980s LBO reckoning and the commercial real estate stress of 1990-1993 came not long after the thrift crisis and oil patch collapse slammed many banks and S&Ls.
The COVID crisis was a very different beast but had a well-positioned Fed with a crisis-period tool box to pull out. How the Fed will be governed or legislated under Project 2025 is going to a critical variable into 2026 when the new team is in place and what Trump wants to do with his loyalists at the helm.
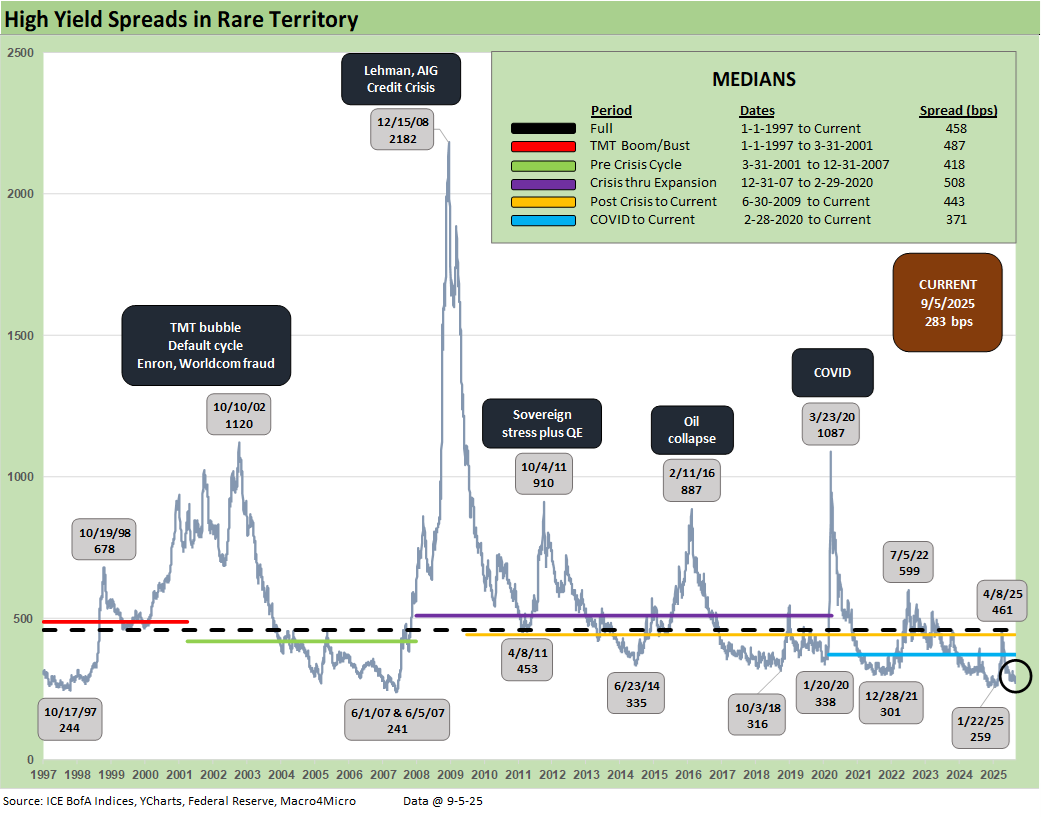
The sub-300 bps HY OAS returned after the Liberation Day panic eased. The +283 bps is inside the month-end spreads of June 2007 even if wide to the HY OAS tights seen at the start of June 2007 (+241 bps).
Today’s HY market presents a much healthier credit mix than in June 2007 when LBOs had gone off the charts and were partly funded with HY bonds. In the current market, those highly leveraged transactions have migrated over to private credit. That still means the +241 bps of early June 2007 is like a brass ring to HY funds today. The HY bond index default cycle is very much in check. The distress and debt exchange actions will be weighed more heavily (and quietly) over in private credit as the year plays out.
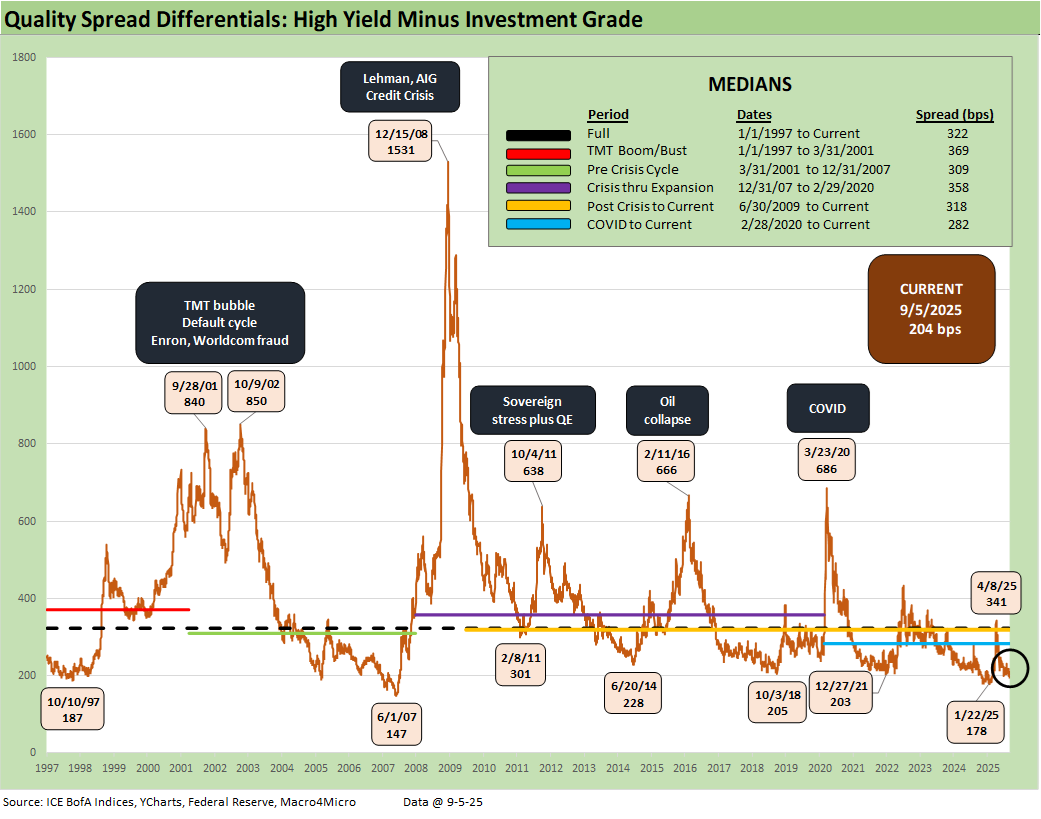
The “HY OAS minus IG OAS” quality spread differential of +204 bps is above the tights of +178 bps seen in Jan 2025 and materially higher than the +147 bps in June 2007. The +204 is more in line with credit cycle mini-peaks such as June 2014, Oct 2018, and Dec 2021.
We see the peak of +341 bps after Liberation Day vs. a long-term median of +322 bps. Most of the cyclical timeline medians noted in the box had 300-handles, so this trend overall highlights that quality spreads are offering low compensation for moving down the credit tiers.
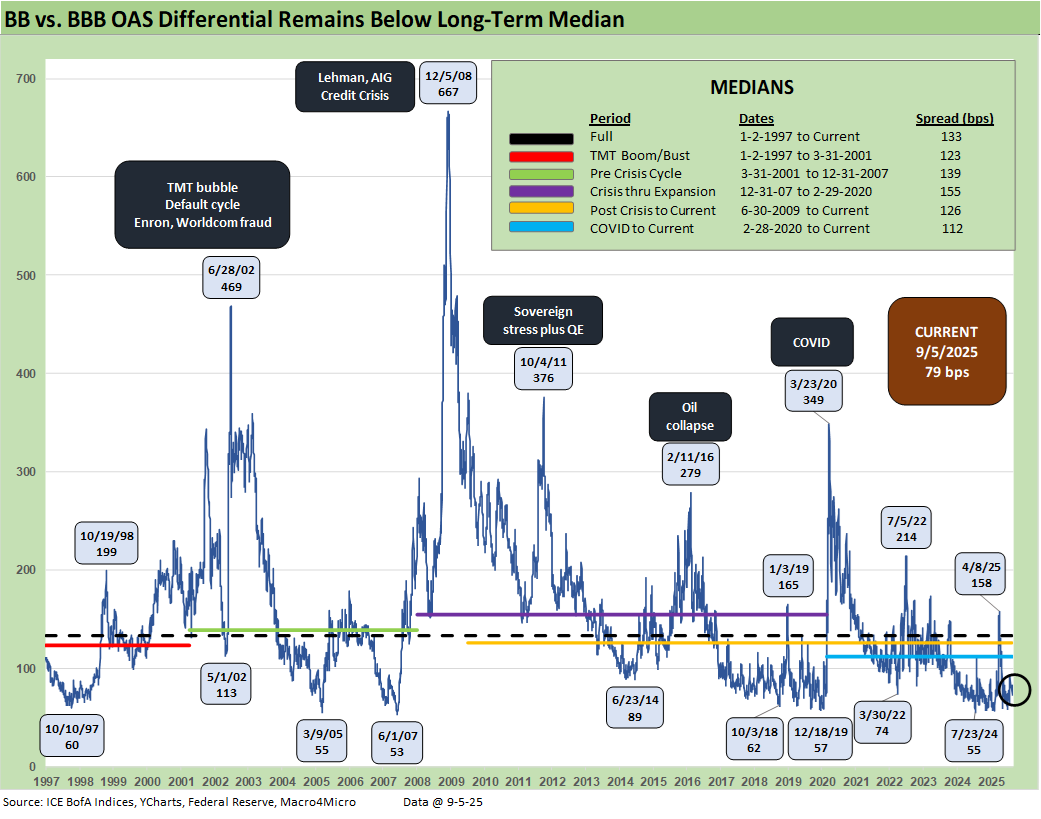
The “BB OAS minus BBB OAS” quality spread differential is back in double digits after spiking to +158 bps after Liberation Day. The long-term median of +133 bps is consistent with the median across the credit cycles detailed in the box.
The current cycle has routinely hit “lower lows” than the current +79 bps with 50-handles seen at numerous points. The low tick was June 2007 at +53 bps.
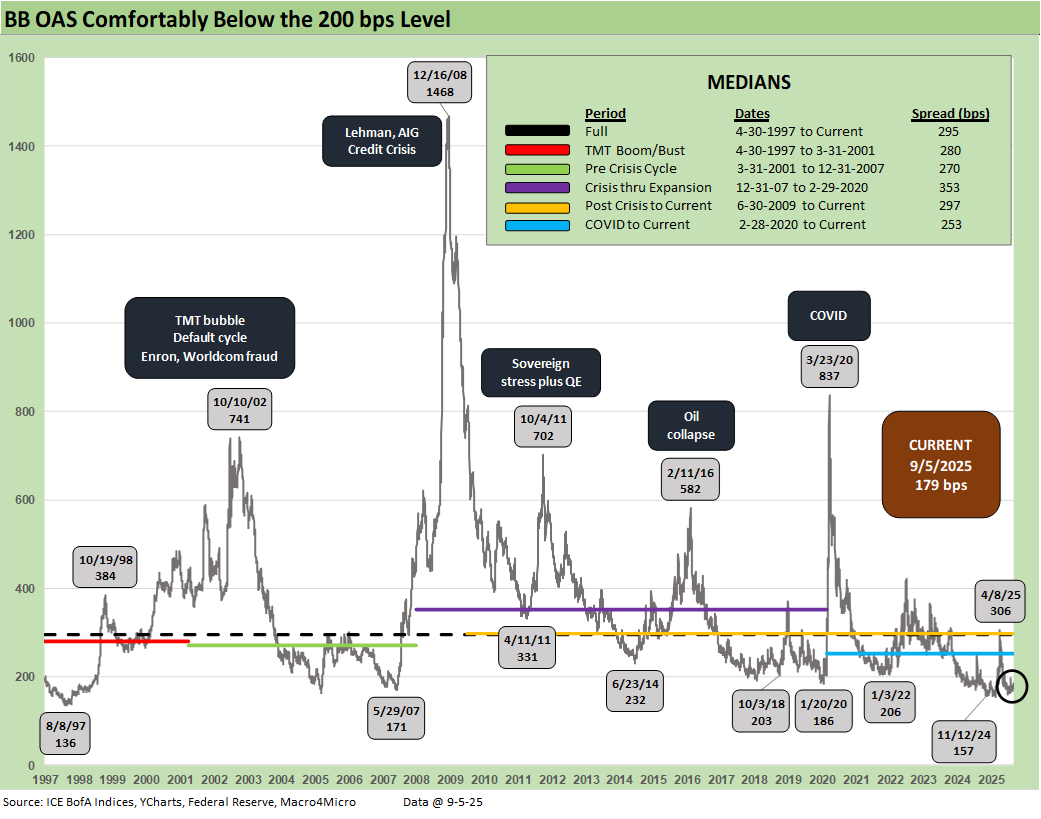
The above plots the time series for the BB tier across the cycles. The current sub-200 bps level of +179 bps is impressively tight, but we were lower in 4Q24 at +157 bps. The long-term median of +295 bps is in a different zip code.
The demand for BB tier bonds has seen BBB buyers, HY lite strategies, and defensive HY funds all looking to this tier that ranks as by far the largest in HY. The strategy has worked as we covered earlier in excess and total returns across the tiers. The BB tier has been a good way to take credit risk while managing duration exposure and still carrying a respectable coupon.
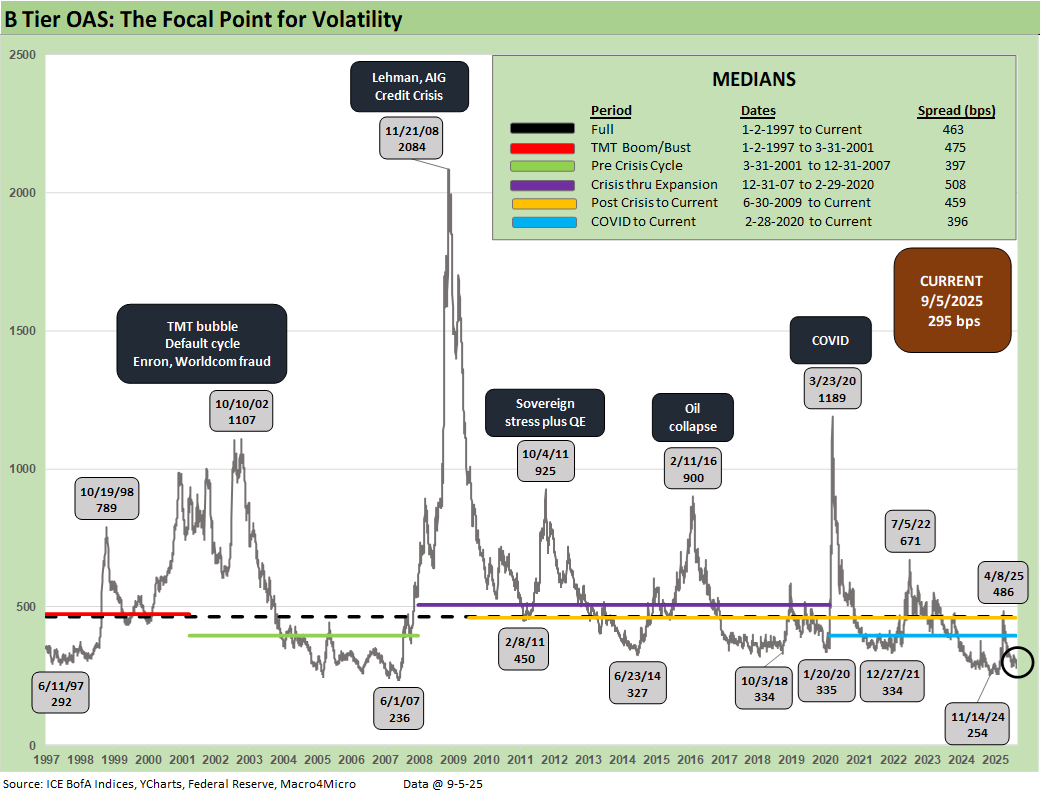
The B tier is the sweet spot and home of the “HY Classic” investor. We see the current level at +295 bps back inside the +300 bps line. B tier OAS had reached a post-2007 low of +254 bps in Nov 2024 before the Liberation Day fallout drove the B tier OAS to +486 bps. The long-term median stands at +463 bps.
This current cycle’s median at +396 bps is the lowest of the mini-cycle medians presented in the chart. It is well below the mid to high 400 handles seen in most with the exception of the post-crisis (Dec 2007 to Feb 2020) median which crossed above the 500 range to +508 bps.
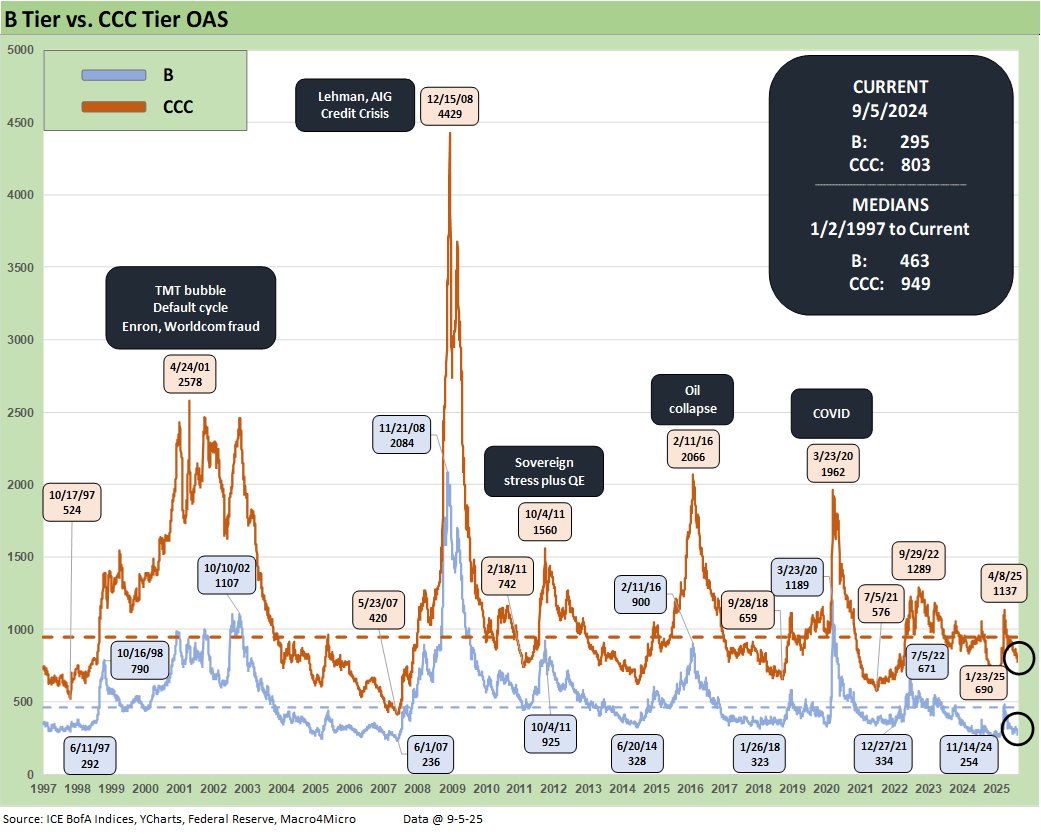
The above time series plots the wildest ride across the cycles seen in the B and CCC OAS levels. Both credit tiers are dramatically below their long-term medians. The B tier at +295 bps is well inside the median of +463 bps while the CCC tier at +803 bps is well below the median of +949 bps.
The post-crisis spread spike is ranked in a world of its own given the bundle of risks including a collapse of market makers and evaporating secondary liquidity. The TMT cycle default wave and liquidity implosion saw multiple spread peaks in 2001 and 2002 that were especially ugly. Enron came in the fall of 2001 and WorldCom in the summer of 2002.
The sovereign panic of fall 2011 is in evidence as was the overexposure and E&P excess of 2015 to early 2016 on the collapse of oil and gas as the cash flow burn and valuation crisis dominated the upstream sector.
COVID saw a wave of supportive monetary policy and fiscal actions, so the energy sector HY crisis peak OAS in early 2016 was wider in spreads than those seen at the 3-23-20 COVID highs. In the case of the energy crisis, a major cross-section of the HY universe was driven by the same small group of risk factors in oil and gas prices and the recurring story of a collapsing borrowing base with the banks.
During COVID, the return to ZIRP and the “great reopening” of the economy and markets bolstered risk appetites and generated record refinancing and extension volume. In turn, that materially reduced refinancing risk (thus default risk) and lowered coupon costs from IG to HY.
The ZIRP backdrop also eased ABS costs and bank line costs. Under some of the Fed legislation and control moves being discussed in the current market, that support seen in earlier credit panics would not have happened. If the Fed loses such tools, that would mean the White House would pick winners and losers (i.e. friends vs. enemies). Control of the Fed would offer the White House vastly more financial power than it has now to “influence” (intimidate? control?) borrowers and lenders alike.
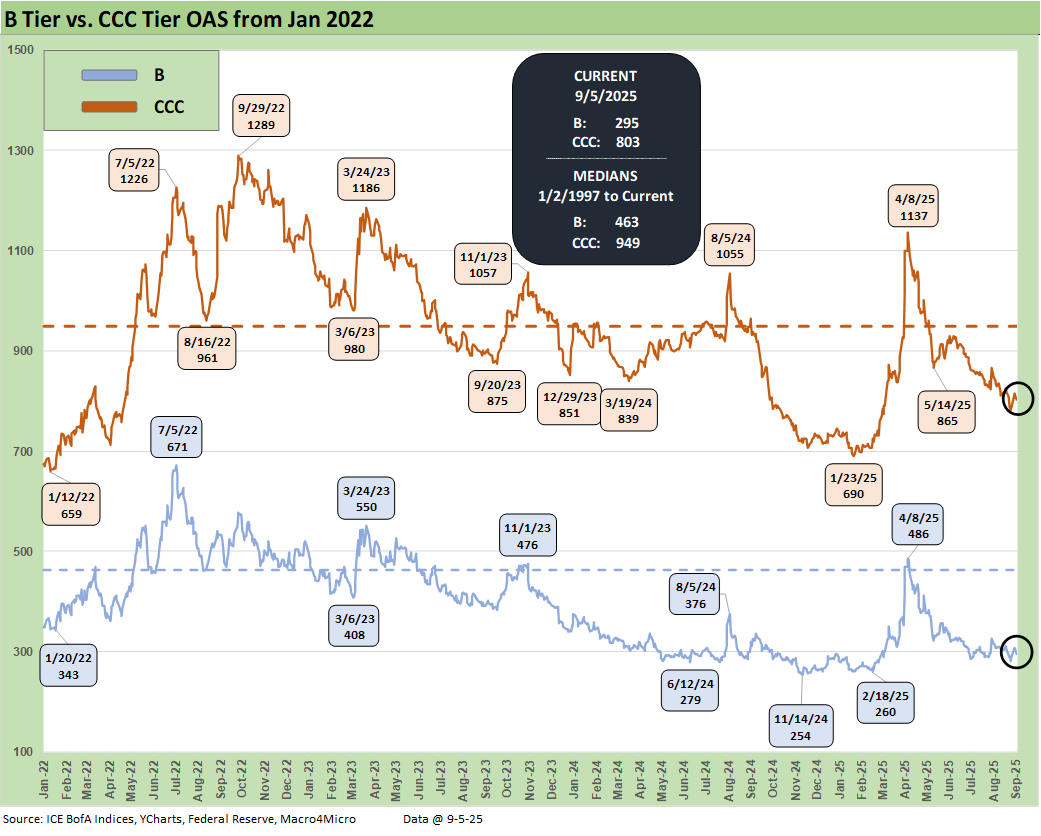
The above offers a more granular visual of the B vs. CCC OAS since the start of 2022 to get a read on how credit pricing moved across the tightening cycle on the way to easing mode. In the end, there was no recession and no ugly default wave. Inflation and rates came down quickly from the June 2022 peaks. CCC spreads peaked in Sept 2022 and B tier spreads in early July 2022.
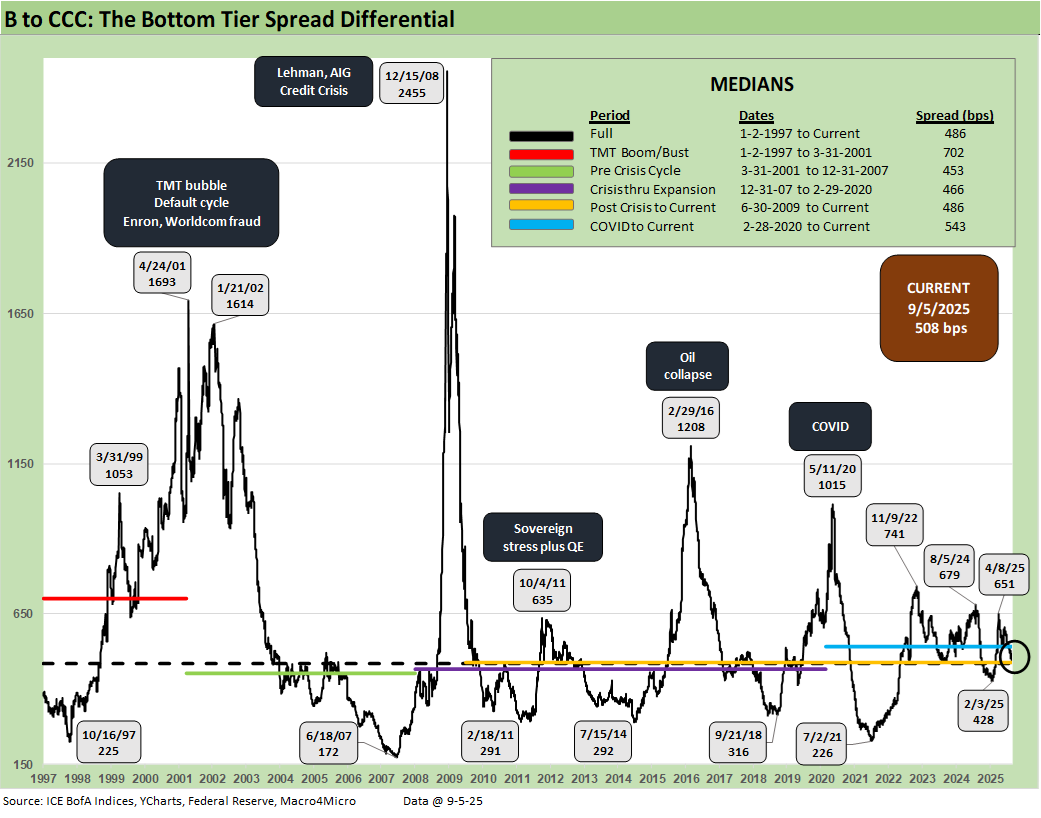
The above quality spread differential for B vs. CCC tells a simple story. In times of macro stress, HY secondary liquidity panics (fear of fund redemption waves, etc.) and quality shocks where the HY index has industry concentrations (e.g. TMT, Energy), the CCC tier quickly sees credit risk turn into the equivalent of equity risk and even high-risk equities. That means bond pricing is expected to offer returns commensurate with that status. That is when the action is about dollar prices and not spreads.
Trying to gauge the credit risk, the default risk, the loss-given-default pricing component, the secondary liquidity penalty, the structural risks of the governing documents, and the recovery value and time horizon risks (30 days on CDS, post workout value upon emergence, etc.) is where the distressed debt commandos and seasoned vets come in.
The quantitative modeling of defaults can sometimes take on the nature of “weird science” or “fake science” while the classic distressed investor typically has the experience and legal inputs to navigate such markets. Assumptions can always be wrong, but there are histories and templates that those players tap into.
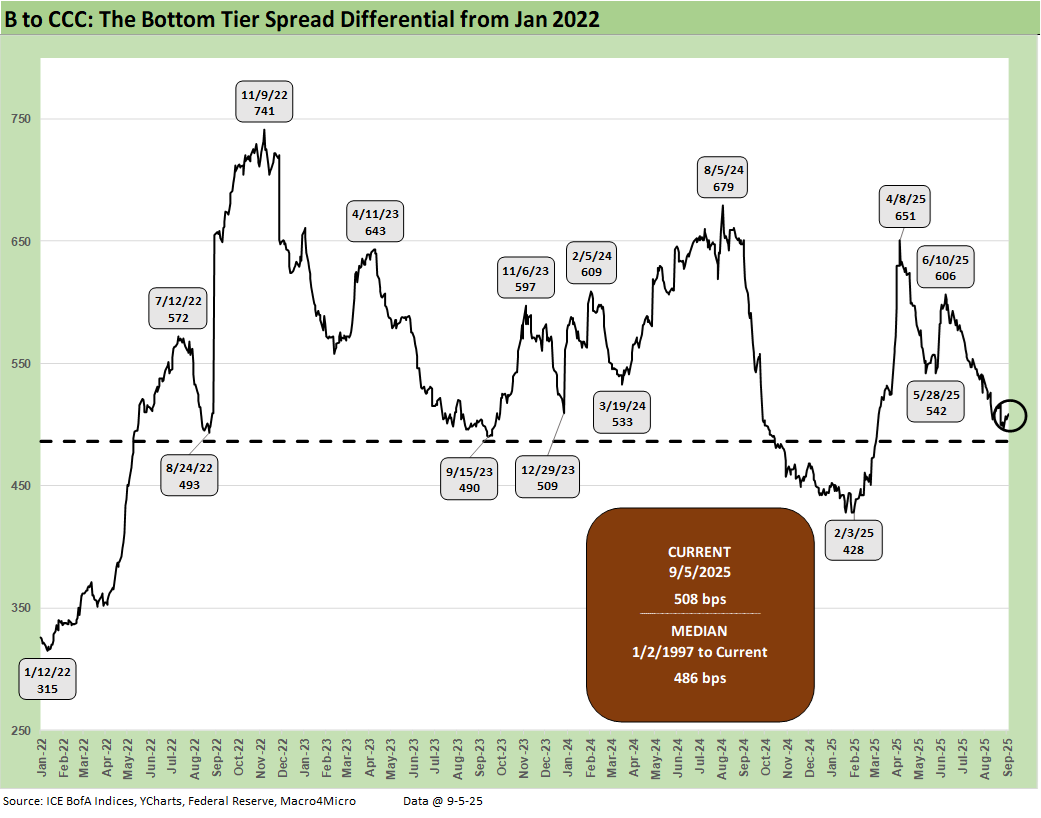
The above chart just shortens up the time horizon for the B vs. CCC quality spread differential history for the period from Jan 2022 through current times to capture both the tightening cycle, the start of easing, and the new world of tariffs.
We see peak quality spread differentials at +741 bps in Nov 2022, up from +315 bps at Jan 2022. We are currently at +508 bps, above the long-term median of +486 bps. As a reminder, many market watchers were screaming recession in the fall of 2022. We did not see it that way (see Unemployment, Recessions, and the Potter Stewart Rule 10-7-22).
Cyclical turning points? 2022 vs. today…
There was plenty to worry about back in 2022 and Russia-Ukraine was not helping on the front of cyclical optimism with an energy price spike. However, consumer spending was still solid, and employment was strong. The yield curve was of course a mess. That said, it takes a lot to cause a recession. After the tariff legal decision on IEEPA, we believe economic risks will be lower if that Appeals Court decision can hold up against the SCOTUS “friends of Trump” (see Macro Menu: There is More Than “Recession” to Consider 8-5-25).
In the current market and the recession debate, we see a mixed picture. The fall of 2022 lacked serious payroll pressures, and we are seeing those now. PCE and consumer spending was rolling along impressively in the fall of 2022. That has been under pressure of late with PCE lines in the GDP account weak in 1Q25 and 2Q25. We are seeing some decent retail sales numbers along the way (a fresh set next week) and the latest PCE release was more constructive (see PCE July 2025: Prices, Income and Outlays 8-29-25).
Last but not least, we are seeing solid earnings trends coming out of 2Q25 with constructive guidance. That could change in 3Q25 as the mix of factors and advancing stage of tariff effects get more weight. That is now muddied by the IEEPA ruling and appeal.
For now, the recession risk handicapping is a pitched battle, but the mix of variables are worse than 2022 with the exception of inflation (lower now) while interest rates are lower now and heading lower. Jobs and consumer spending and corporate sector reinvestment and hiring are the main events.
See also:
The Curve: The Road to Easing has been Long. 9-8-25
Footnotes and Flashbacks: Asset Returns 9-6-25
Mini Market Lookback: Job Trends Worst Since COVID 9-6-25
Payrolls Aug 2025: Into the Weeds 9-5-25
Employment August 2025: Payroll Flight 9-5-25
JOLTS July 2025: Job Market Softening, Not Retrenching 9-3-25
Hertz Update: Viable Balance Sheet a Long Way Off 9-3-25
The Curve: Risk Tradeoff - Tariffs vs. UST Supply 9-1-25
Mini Market Lookback: Tariffs Back on Front Burner 8-30-25
PCE July 2025: Prices, Income and Outlays 8-29-25
2Q25 GDP: Second Estimate, Updated Distortion Lines 8-28-25
Avis Update: Peak Travel Season is Here 8-27-25
Durable Goods July 2025: Signs of Underlying Stability 8-26-25
Toll Brothers Update: The Million Dollar Club Rolls On 8-26-25
New Home Sales July 2025: Next Leg of the Fed Relay? 8-25-25
The Curve: Powell’s Relief Pitch 8-24-25
Mini Market Lookback: The Popeye Powell Effect 8-23-25
Existing Home Sales July 2025: Rays of Hope Brighter on Rates? 8-21-25
Home Starts July 2025: Favorable Growth YoY Driven by South 8-19-25
Herc Holdings Update: Playing Catchup 8-17-25
Mini Market Lookback: Rising Inflation, Steady Low Growth? 8-16-25
Industrial Production July 2025: Capacity Utilization 8-15-25
Retail Sales Jul25: Cautious Optimism in the Aisles 8-15-25
PPI: A Snapshot of the Moving Parts 8-14-25
CPI July 2025: Slow Erosion of Purchasing Power 8-12-25
Iron Mountain Update: Records ‘R’ Us 8-11-25
Mini Market Lookback: Ghosts of Economics Past 8-9-25
Macro Menu: There is More Than “Recession” to Consider 8-5-25
Mini Market Lookback: Welcome To the New World of Data 8-2-25
Happiness is Doing Your Own Report Card 8-1-25