
Footnotes & Flashbacks: Asset Returns 7-12-25
The past week was a mild setback for what remains a strong rolling 1-month, 3-months, and YTD return mix.


“Big” returns are relative.
Coming off the best back-to-back years for the S&P 500 since the late 1990s, the 2025 YTD performance in equities is holding up well with bond ETFs all positive. The numbers fall well short of the equity run rates in 2024.
The rolling 3-months off the Liberation Day plunge makes for very impressive returns, but the YTD returns will need to deliver a big summer and fall to match the 2024 performance and an impressive two-year run.
The 13.6% LTM return on the S&P 500 in our peer group of 32 benchmarks and ETFs is running well behind the +25% that was posted in calendar 2024. The bar is set and the market has to push through tariffs to get there.
The YTD median asset performance in the 32 asset lines of 4.7% has its work cut out for it. The YTD S&P 500 of +7.2% is solid and just ahead of NASDAQ while the Russell 2000 still lags in the bottom quartile YTD.

The table above updates the time horizon returns for the high-level debt and equity benchmarks we watch each week. It is nice to see all positive numbers over the 1,3, and 6 months and especially solid numbers in equities and riskier credit looking back 1 year, 2 years and 3 years. Maybe the partisan spin from either side reminds us to look at the data and not just the adjective-spinners with their ready supply of disinformation.
Since the supply and demand imbalances of COVID and the excess fiscal overdrive on the demand side set the stage for a noisy 2022, the cyclically diverse US economy, a generally healthy bank system (with a few notable exceptions in the regional ranks), and growing supplies of credit capital helped drive a few years of broad-based growth and rebounding profitability.
With that in the rearview mirror, one might argue that it was not the time to try out a set of tariff policies that has never been attempted in the postwar era and certainly not in the modern capital markets (we would date that from the late 1970s). But here we are with a lot more theories to be tested in the summer and fall as more tariffs roll out.
The above rolling 3-month rebound off the Liberation Day panic will still face a lot of uncertainty as the working capital cycles start to roll in from earlier tariffs and the inevitable lags start when the Aug 1 reciprocals go into effect. We will also see higher risks of retaliation when Pharma and Semi tariffs rolls in and more countries seek to sell their wares into other export markets.
The multiyear construction projects for many industries to replace capacity with lower cost US non-tariffed goods are years away. That will not be an easy or smooth transition, and many small and mid-sized businesses will suffer. Many are already highlighting the tariff pain (they highlight that they “write the check”). The small business sector gets very little headline press or attention from the policy talking heads.
The rolling return visual
In the next section, we get into the details of the 32 ETFs and benchmarks for a mix of trailing periods. Below we offer a condensed 4-chart view for an easy visual on how the mix of positive vs. negative returns shape up. This is a useful exercise we do each week looking for signals across industry groups and asset classes.

The symmetry above looks very favorable for the rolling 1-month, 3-months and 1-year time horizons. The exception is the past week, which was 10-22 biased negative. That soft week barely moved the needle on the rolling 1-month chart. While not shown above, the YTD return balance as detailed below posted a score of 29-3.
The Magnificent 7 heavy ETFs…
Some of the benchmarks and industry ETFs we include have issuer concentration elements that leave them wagged by a few names. When looking across some of the bellwether industry and subsector ETFs in the rankings, it is good to keep in mind which narrow ETFs (vs. broad market benchmarks) get wagged more by the “Magnificent 7” including Consumer Discretionary (XLY) with Amazon and Tesla, Tech (XLK) with Microsoft, Apple, and NVIDIA, and Communications Services (XLC) with Alphabet and Meta.

The 1-week performance of the tech bellwethers was covered in Mini Market Lookback: Tariffs Run Amok, Part Deux (7-12-25) as the week was mild to mixed with the exception of NVIDIA crossing the $4 trillion line for market cap. We saw 4 of 7 Mag 7 names positive with 3 negative but only NVIDIA was over the +1.0% line. Looking back 6 months, we see Tesla and Apple in double-digit negative return range but both back to positive for 3 months.
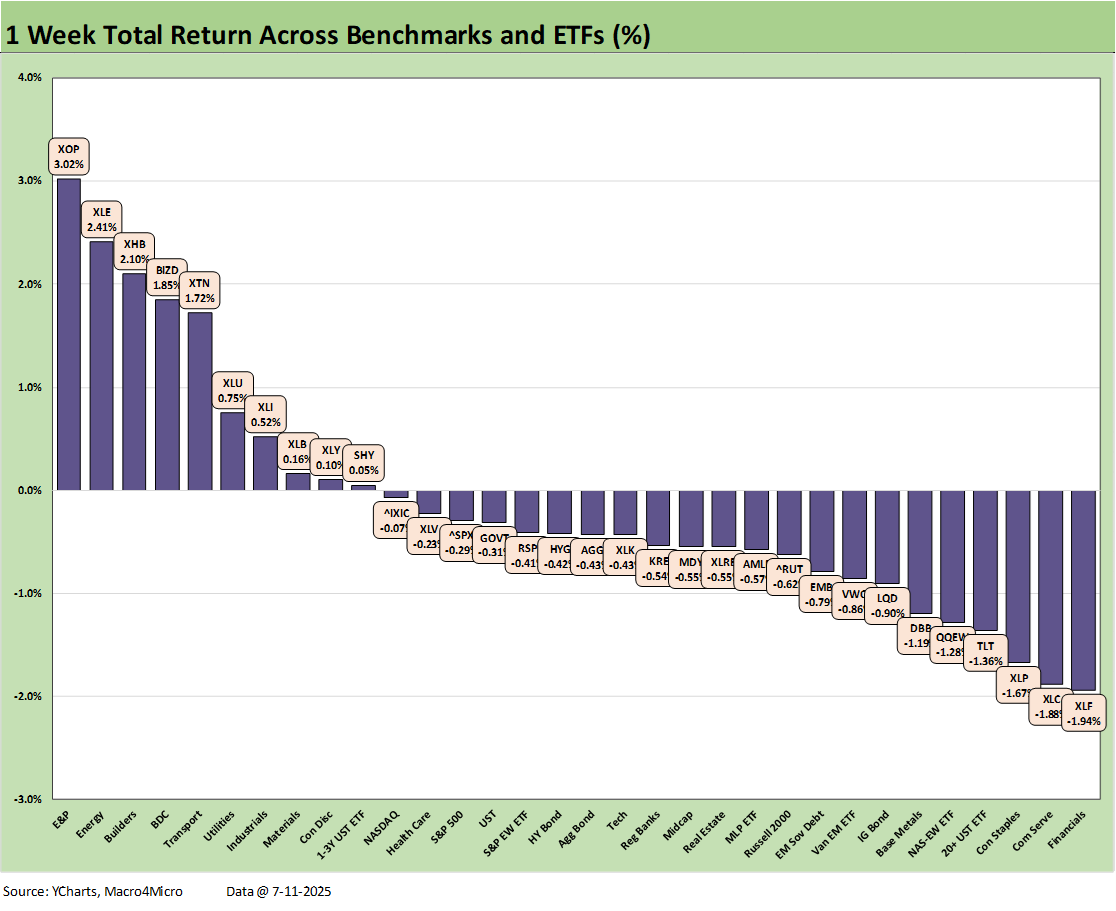
We already looked at the 1-week performance in Mini Market Lookback: Tariffs Run Amok, Part Deux (7-12-25). The 10-22 score was weak in the context of 2025 with some rate sensitive assets bucking the week’s trend and setting off some fresh revisiting of valuation ahead of the 2Q25 earnings season.
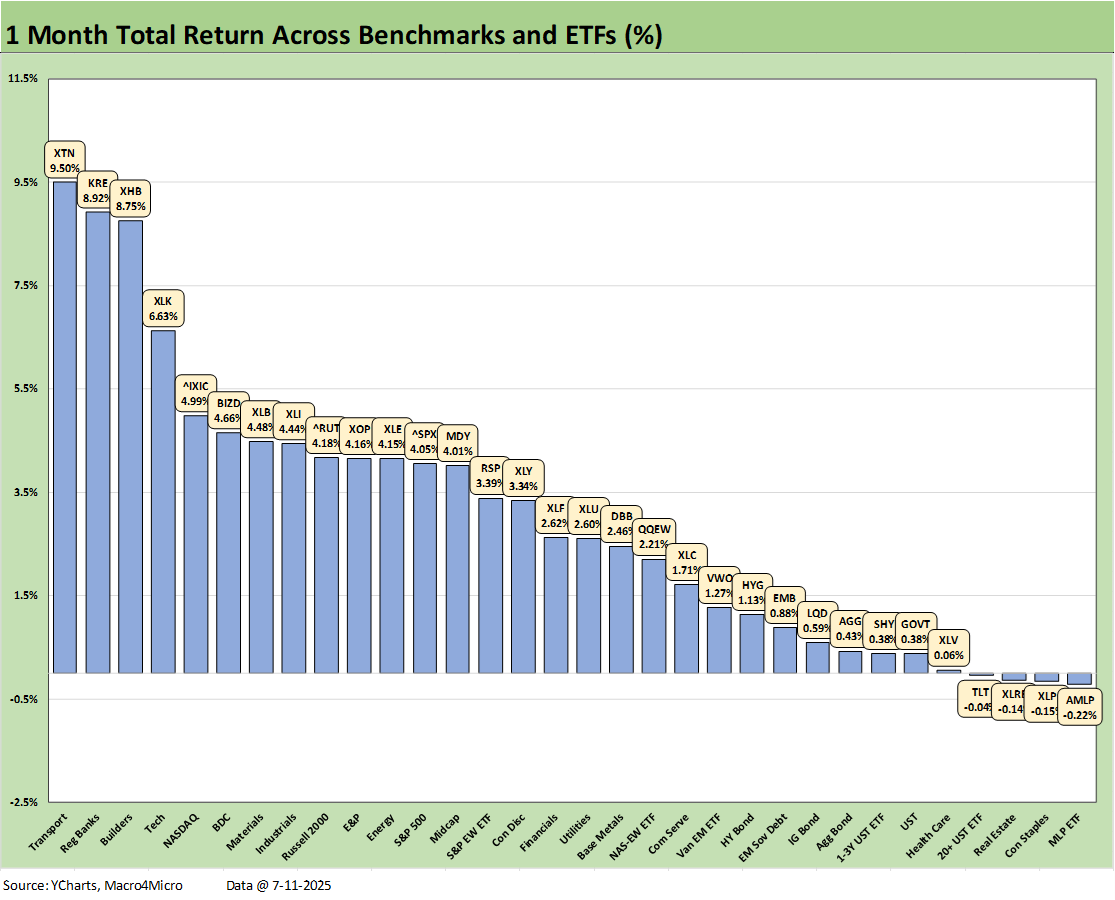
The rolling 1-month returns weigh in at 28-4 with some rate sensitive ETFs lagging (TLT, XLRE, and XLP) and AMLP lagging despite its high dividend yields. The winners include some of the names that had struggled YTD such as Transports (XTN) and Homebuilders (XHB) and two YTD middling performers in Midstream (AMLP) and Consumer Staples (XLP).
We highlight that the small cap Russell 2000 rebounded after struggling in the bottom quartile YTD with barely positive returns. On a YTD basis, Midcaps had also lagged the large caps (S&P 500, NASDAQ) and was modestly behind RUT in the above.
For bond ETFs, we see 4 of the 7 bond ETFs in the bottom quartile and the other 3 at the bottom of the third quartile. In bonds, duration lost, but credit risk won.

The 30-2 score for 3 months makes a strong positive statement with only Health Care (XLV) and the long duration UST ETF (TLT) in negative range. The bounce off the Liberation Day sell-off has generated some major league numbers with the median return across the 32 just over 14%. In contrast, the YTD median is around 4.7% or running at an annualized return more in line with long term nominal returns in equities.
The top quartile saw Tech (XLK) at #1, Regional Banks (KRE) at #2 and Transports (XTN) at #3 with a high 20% range return across only 3 months. We see some favorable market breadth with NASDAQ in the top quartile joined by the Russell 2000 after a rough YTD performance for small caps in the bottom quartile. We see 6 of the 7 bond ETFs in the bottom quartile with only the Sovereign bond ETF (EMB) making it into the lower half of the third quartile.

The YTD scoresheet of 29-3 offers very favorable symmetry with only Health Care (XLV), Consumer Discretionary (XLY) and Transports (XTN) in the red. It took 8.7% to make the top quartile over the YTD period with the median return in the 32 benchmarks and ETFs around 4.7%.
The top quartile was led by Industrials (XLI) followed by EM Equities (VWO) at #2, Utilities (XLU) at #3, the Tech ETF (XLK) at #4 , and Communications Services (XLC) rounding out the Top 5. We highlight the cyclical Materials ETF (XLB, heavy on chemicals) and Financials (XLF) also made the top quartile. For breadth in tech subsectors, we see the Equal Weight NASDAQ 100 (QQEW) in the top quartile, so the tech rally was beyond the Mag 7.

The LTM period saw a score of 27-5 with a mixed bag of commodity-exposed ETFs (XOP, DBB) and interest rate sensitive ETFs (TLT, XHB) joining the struggling Health Care ETF (XLV) in the red.
The LTM period above includes almost 6 months of the 2024 banner year in equities that was Part 2 of the best 2-year run in the S&P 500 since the late 1990s (see Footnotes & Flashbacks: Asset Returns for 2024 1-2-25). The 2023-2024 S&P 500 return of +45% for the running two years and +25% for 2024, respectively, will be very hard to match in 2025-2026.
The performance in 2023-2024 on the way to the LTM 2025 above undermines the weak premise of some of the nonstop rhetoric that the country was “DEAD” until Trump came along. The participants in the economy make such performance appear in the context of market valuations as long as the White House residents do not try too hard to screw it up (they usually try in both parties).
For the markets in 2025, the challenge will be adjusting to massive tariffs that intrinsically disrupt supplier chains and punish expense lines.
Markets:
Mini Market Lookback: Tariffs Run Amok, Part Deux (7-12-25)
Footnotes & Flashbacks: Credit Markets 7-7-25
Footnotes & Flashbacks: State of Yields 7-6-25
Footnotes & Flashbacks: Asset Returns 7-6-25
Mini Market Lookback: Bracing for Tariff Impact 7-5-25
Payrolls June 2025: Into the Weeds 7-3-25
Employment June 2025: A State and Local World 7-3-25
Asset Return Quilts for 2H24/1H25 7-1-25
JOLTS May 2025: Job Openings vs. Filling Openings 7-1-25
Midyear Excess Returns: Too little or just not losing? 7-1-25
Recent Tariff commentary:
US-Canada Trade: 35% Tariff Warning 7-11-25
India Tariffs: Changing the Music? 7-11-25
Taiwan: Tariffs and “What is an ally?” 7-10-25
US-Trade: The 50% Solution? 7-10-25
Tariff Man Meets Lord Jim 7-8-25
South Korea Tariffs: Just Don’t Hit Back? 7-8-25
Japan: Ally Attack? Risk Free? 7-7-25
US-Vietnam Trade: History has its Moments 7-5-25
US Trade in Goods April 2025: Imports Be Damned 6-5-25
Tariffs: Testing Trade Partner Mettle 6-3-25
US-UK Trade: Small Progress, Big Extrapolation 5-8-25
Tariffs: A Painful Bessent Moment on “Buyer Pays” 5-7-25
Trade: Uphill Battle for Facts and Concepts 5-6-25
Ships, Fees, Freight & Logistics Pain: More Inflation? 4-18-25
Tariffs, Pauses, and Piling On: Helter Skelter 4-11-25
Tariffs: Some Asian Bystanders Hit in the Crossfire 4-8-25
Tariffs: Diminished Capacity…for Trade Volume that is…4-3-25