
Footnotes & Flashbacks: State of Yields 7-13-25
A modest adverse UST shift still faces the risk of a massive buildup of tariff timelines ahead.


Trumponomics: Lesson #1: Selling country pays the tariff.
The modest bear steepener for the UST curve this week did not notably change the YTD bull steepener benefits for bonds, but the 30Y UST is back to dancing around the 5% level. We look at the 5Y to 30Y slope history this week, and at +97 bps the 5Y to 30Y is above the long-term median of +71 bps.
The strange times get even stranger after a week of disinformation on who “gets charged” and “who pays customs the tariff” and “who we take in money from” and of course the evolving definition of “reciprocal.”
The tariff waves this past week ended with 30% tariffs on EU and Mexico made public on Saturday (dated Friday) after a 35% threat to Canada on Friday with Canada already facing massive tariffs on steel, aluminum, copper, and autos with lumber in the Section 232 queue (see Mini Market Lookback: Tariffs Run Amok, Part Deux 7-12-25). With copper set at 50%, we now get to look forward to Section 232 tariffs on pharma (Trump threatened 200%) and semis. Separately, we looked at the Asian tariff binge this week (see links at bottom).
The attacks on Powell with the top dog and co-author of Project 2025 joining the fight seek to give Trump one of the institutions he can’t now directly control until a new Fed Chair appointment. Meanwhile, the reality of tariff revenue gets bragged about in one room while the other room denies who pays them.
This will be an important week with CPI/PPI, Retail Sales, Industrial Production and Housing Starts, but the reality check on inflation fears is that the biggest wave of tariffs to date will not even begin until Aug 1 and start a fresh game clock in working capital cycles and the “expense vs. price vs. cost cutting” dilemma.
The following updates our rolling weekly State of Yields commentary.

The above chart plots some key cyclical transition periods from the Carter inversion of 1978 across the Volcker years, the1980s credit cycle peak in 1989 (note the 9.2% 3M UST), the TMT cycle faltering in 2000 (on the way to a massive Greenspan easing in 2001), and the housing bubble in 2006. During the 2004 to 2007 period, leveraged derivative exposure and structured credit was out of control and counterparty risk was soaring.
The chart then jumps from 2006 to 2023, which takes the market beyond the crisis period and the ZIRP years and COVID. Both the post-credit crisis period and COVID provoked the Fed into a wave of market liquidity support and confidence building programs that helped save the capital markets and support the banks. That period brought plenty of QE and normalization distortions to the yield curve shape.
The market saw a massive move lower and bull flattener to end 2023 after the 10Y UST peaked in Oct 2023 as we review below. Steeper and higher was not the forecast to start 2024 as the market expected flatter and lower. During 2024, the curve moved in an adverse direction with a bear steepener until a major rally alongside the Sept 2024 easing. That soon brought us a fresh steepening with some rallies and sell-offs along the way.
The current market is facing a balancing act with tariffs finally rolling into the working capital cycles and thus raising inflation risk. On top of those tariffs already in place, we will see waves of newly set tariffs with the “reciprocal tariff pause” coming to an end this past week. Many of the same tariffs (or close) were assigned with a new Aug 1 start date (for now). The scale of the tariffs should light up a fresh round of headlines in tariff-driven inflation vs. recession risks in coming months.
The relative risk of inflation or stagflation is tied to worries over consumer demand (weaker?) and corporate expense pressure that requires a corporate decision on how to deal with the tariffs that the US buyers pay at the border to customs (Pricing power? Cost mitigation actions?).
The dilemma between inflation and stagnation raises the ultimate specter – stagflation. We have not seen a bout of stagflation since the 1980-1982 double dip, so it will be a new variable for many in the markets in a much more globalized economy.
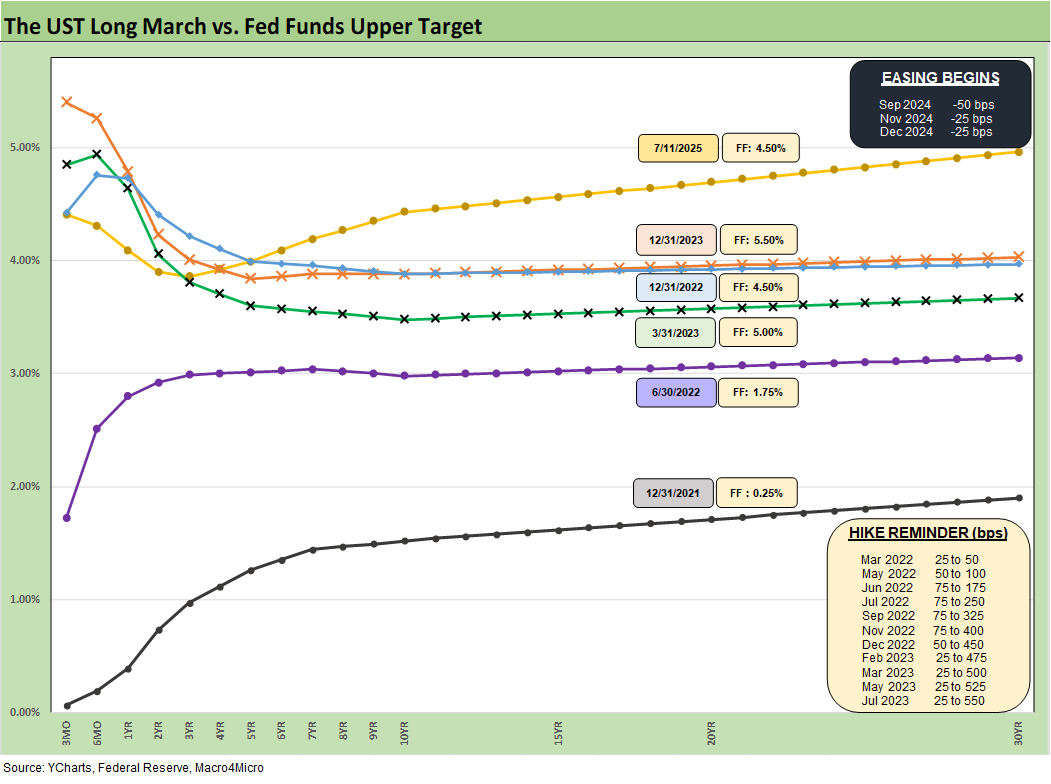
The above replays our weekly chart detailing the migration of the UST curve from 12-31-21 with a memory box detailing the tightening dates and magnitude and more recently the easing. The UST curve seems to intermittently mix bear steepening patterns and flattening rallies since the Sept 2024 lows, but market fear was creeping into the shapeshifting after Liberation Day before calming down with the pause.
The past week saw a wave of assigned tariffs that were in many cases as high or near those announced on Liberation Day. In Brazil’s case, the 50% tariff was 5x higher (US-Trade: The 50% Solution? 7-10-25). We had the Vietnam deal of earlier this month (see US-Vietnam Trade: History has its Moments 7-5-25), but this week should have been shocking if not for the sensory overload of tariffs and the dulled senses. The importers/buyers will get their direct impact soon enough.
Steepener off the Sept 2024 lows…
After the Sept 2024 lows detailed above, we shifted back into a bear steepening along the way while mixing in some mini rallies. The UST curve will not be helped by record supply and potentially shrinking demand, fears around the worst erosion of the dollar in decades, and diminished confidence in US governance (and in many cases competence). Trade hostility will not help and could even be a motive to avoid UST.
FOMC action remains defensive…
The recent FOMC meeting saw another round of no action by the Fed with an increase in the number of votes for no change in 2025 to 7 from 4 in the “Gang of 19” dot plot (see FOMC Day: PCE Outlook Negative, GDP Expectations Grim 6-18-25). The consumer metrics of late (notably income and PCE) turned soft, so June data delivered in July and July data delivered in Aug will be critical input for the market as well as the FOMC in September.
The very weak GDP forecasts and rising PCE inflation forecast medians are generated by 19 economists in the June SEP report and the same for the dot plot. The very poor GDP forecasts are mirrored by the OECD, the World Bank and numerous major top banks. The bank forecasts are delivered by people who get paid by their employers and their clients and they can’t be primaried by Trump.
Powell attacks by Trump loyalists escalate …
Powell gets attacked by Trump and an increasing number of loyalists who are now trying a “termination for cause” angle to wrest control of the Fed from Powell at a critical juncture. The actions are for the sole purpose of inserting a loyalist when Trump tariffs will present a material risk factor as the first genuine stagflation threat in over 45 years.
Trump recently increased his demand for fed funds cuts by 300 bps shortly after raising the cuts target to 200 bps from 100 bps. The market perception of monetary policy risk – notably on the long end – may not be what Trump loyalists expect by taking over the short end under White House de facto control. All they have to do is look at what transpired after Sept 2024 or look at the UST steepening of 2021 when inflation was ticking higher (see 5Y to 30Y slope history further below). They may also be seeking to block any tightening action in the event that tariffs drive inflation higher. Team Trump would rather have inflation than a recession – they just won’t say it out loud.
Among the headliners jumping in to join the Powell lynching this past week was the architect and co-author of Project 2025, and that could bring a lot more MAGA card carriers into the fray with the usual “swarm and lie” tactics. Powell is also being attacked on FHFA letterhead by Bill Pulte, a recent political appointee in March who was a broadcast journalism major (clearly an economics expert!). He is the grandson of the Pulte founder and housing sector icon William Pulte. A political supporter trash talking across agencies seems out of the norm but a reflection of the times. He offered no economic color. The FHFA head’s statements on the FOMC and Powell have been less-than-impressive other than “the economy will boom” (if he resigns). He did not weigh in on tariffs (and who pays them).
Powell and Mnuchin saved Trump in 2020 by reinvigorating confidence in credit markets. That literally saved the credit markets and eased bank line drawdown panics that would have stressed the bank system. Even if the Fed was late to the party to end ZIRP in March 2022 and probably should have moved in summer 2021, the Gang of 19 and the Powell-Chaired Fed helped Biden become the second President in over 60 years to not have any recession months in his Presidential term. Clinton was the only other one. For those of us at working age in the 1970s, the 2022 inflation spike was a walk in the park compared to 1974 (late 1973 to early 1975 stagflation) or the 1980-1982 double dip as inflation started to soar in 1979 and turned into stagflation. We all would like to avoid that in late 2025/early 2026.

The above chart details the material move from the peak UST curve of 10-19-23 down into the UST bull rally of Nov-Dec 2023 and then eventually into the lows of Sept 2024. The Sept 2024 low tick only came after a bear steepener hit the curve through the summer of 2024. We then moved back into bear steepener mode until the tariffs roiled the UST markets and initially sent 2Y to 30Y lower on cyclical fears.
The shift higher from Sept 2024 lows and the steepening from the low point at the end of 2023 is reflected in the chart. We see the 10Y and 30Y notably higher than Sept 2024 with a more normal shape from 2Y out to 30Y.
The challenge is still that front end inversion from 3M. We look at the history of the 5Y to 30Y later in this commentary, but the 3M is shaped by the Fed. The inversion anomaly on the front end during a protracted expansion has been hard to shake with the FOMC holding the line over tariff-related inflation questions.
The stubborn 10Y UST has been a headwind for the housing markets (see New Home Sales May 2025: Slip and Slide 6-25-25, Existing Homes Sales May 2025: Sequential Stronger, YoY Weaker 6-23-25, Home Starts May 2025: The Fade Continues 6-18-25, Lennar 2Q25: Bellwether Blues 6-20-25). We get Housing Starts for June this coming week, and the following week we get Existing Homes Sales and New Home sales.

The above chart updates the weekly UST deltas. We see a modest bear steepener that hurt bond returns this week (see Footnotes & Flashbacks: Asset Returns 7-12-25 ).

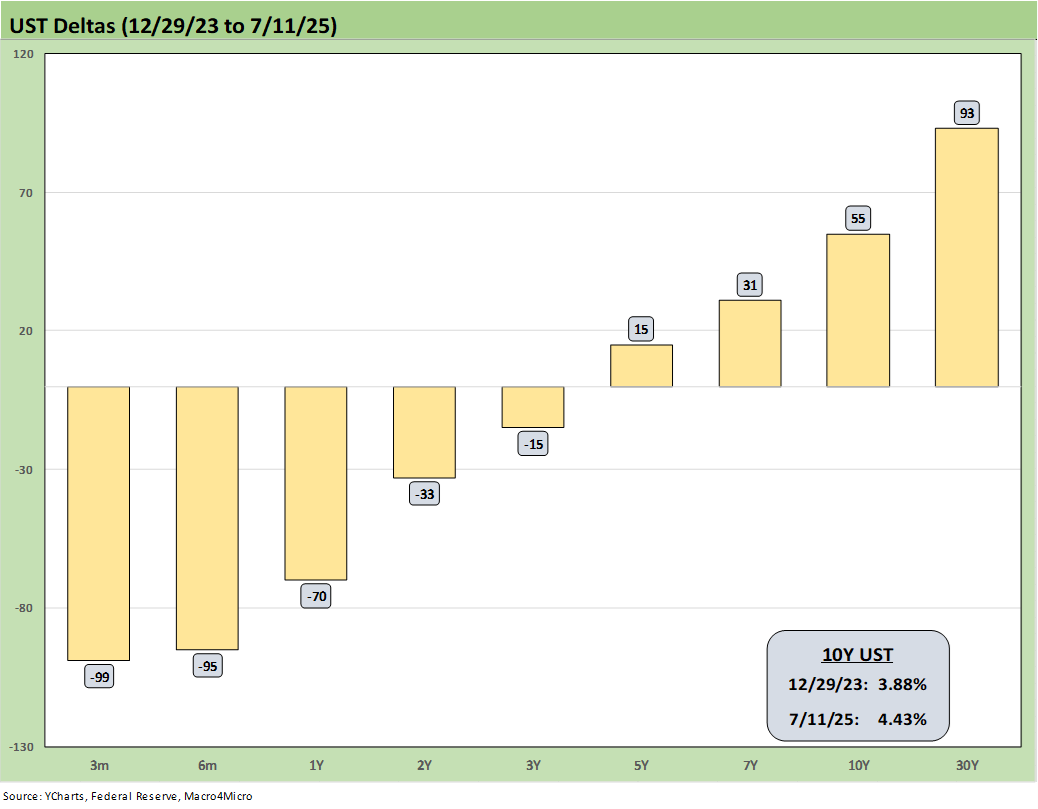
The above chart updates the YTD UST deltas. This is why all the bond ETFs have generated positive returns YTD and some spread compression has helped in the riskier credit asset classes of the bond ETF mix.

The above chart updates the UST deltas since the 9-16-24 lows that came alongside the easing. That has not worked as many market watchers predicted on the shape of the UST curve and number and pace of easing that was supposed to follow.
The FOMC would likely be easing if it was not for Trump’s over-the-top and unprecedented tariff game plan. Powell said as much in his recent Washington testimony. Easing would appear to need a jobs setback that has not appeared in recent releases (See Payrolls June 2025: Into the Weeds 7-3-25, Employment June 2025: A State and Local World 7-3-25). The comments on tariffs have further set off Trump allies as covered above.
The summer period and 2Q25 earnings season should answer more questions on the initial price vs. cost impacts of tariffs. We have already heard and read from many companies that price increases are necessary. For retailers, the worst of the news lies ahead into the back-to-school season and peak holiday period orders.
Low-cost suppliers of goods (including apparel and footwear) were busy reviewing Asian tariff hikes this past week. Countries such as Vietnam were already addressed (see US-Vietnam Trade: History has its Moments 7-5-25) but this past week saw Indonesia and Cambodia see 30% handle tariff set for Aug 1.
India is still pending (see India Tariffs: Changing the Music? 7-11-25). Taiwan as a top trading partner and its dominant role in semis and electronics will also loom large on the cost-to-pricing variables. Taiwan has not been settled (or assigned) at this point (see Taiwan: Tariffs and “What is an ally?” 7-10-25)
Another recent wildcard in macro risk was the military clash with Iran, but that faded quickly. Oil prices are usually tagged as transitory across the years, so tariffs will remain the main event for the summer. The past week oil ended over $68 (WTI), and that is still up from the $60 handle to end May.
The above chart updates the UST deltas from the end of 2023 after a massive rally in rates and risk in Nov-Dec 2023. The follow-on in 2024 expected by the consensus mildly disappointed the UST bulls in the number of FOMC cuts. The market got 4 x 25 (a double in Sept 2024) but not the number of 5 to 6 FOMC 25 bps cuts anticipated). The expectation of a pronounced bull flattening during 2024 also did not play out as expected when a bear steepener prevailed by the end of the year. As detailed in the earlier chart, the 2025 period has fared better for bonds on a modest bull steepener.

The above chart updates the running UST deltas from the 10-19-23 peak date of the UST 10Y when it barely missed the 5.0% line. For those looking for a frame of reference on what a bad move in inflation metrics might mean, these deltas at least offer a recent set of data points during an inflation fighting year such as late 2023 and into 2024 (until Sept 2024 began the easing process). That is why we keep revisiting that timeline. It reminds us what reversion could mean.
These rally deltas could revert in part or in whole with the wrong inflation outcomes. We don’t need to see 2022 again, but the old saying “It happened before, it can happen again” resonates for many.
Losing a rally of -55 bps in the 10Y UST above would hurt the mortgage market even more and would lead to a material valuation headache in equities, M&A economics, and capital project planning. Mortgages have been a drag on housing (new and existing home sales). The risk of inflation heading the wrong way would do more damage. Stubborn rates or higher rates in the short end to 5Y would damage consumer durables financing and related volumes.

The above chart is one of those replay slides we update each week. This one posts the UST curve for this past Friday and the Freddie Mac 30Y Mortgage benchmark rate (noon Thursday release). We include two useful historical periods including the peak homebuilder year end of 2005 and mid-2006 when RMBS quality concerns were catching headlines as the housing bubble was peaking.
We post UST curves for each period in the chart. The past week saw mortgage rates move higher to 6.72% from 6.67% after 6.77% the prior week and 6.81% the week before. The Mortgage News Daily survey was 6.82% on Friday. We have seen minor moves recently, but that comes after a +200 bps range swing since fall 2023.
We include a column above detailing the differential between the Freddie Mac 30Y and the 10Y UST. That differential moved lower this week to +229 bps from +232 bps last week and from +248 bps the prior week. The year 2005 posted a differential of only +100 bps and makes a statement on what the mortgage market was like in 2005. The mortgage market was very hot back then in the housing bubble as mortgage volumes soared during that peak homebuilding year and a very busy period of refinancing was running alongside as a source of funds for homeowners.

We update the UST slope history above for the 5Y to 30Y segment of the UST curve. We see the current slope of +97 bps comfortably above the post-1984 median of +71 bps but well below the Feb 2021 high of +163 bps. That Feb 2021 high in UST steepness is a tough one for the Fed to live down given the signs of so many structural imbalances in the economy with ZIRP rolling along. The UST steepness and fear of a bear steepener remains very much a threat to duration unless the Fed can thread the needle in the summer and fall with tariff impacts rolling in.
The late Feb 2022 invasion of Ukraine by Russia was the nail in the inflation coffin with the oil and energy fallout. March 2022 saw the tightening cycle begin and continue aggressively across the year as highlighted in an earlier chart. We are not expecting Trump to cite Russia in the 2022 inflation spike any more than we expect him to state the fact that the US importer/buyer pays customs the tariff.
The oil X-factor triggers memories of the Oct 1973 oil embargo effects and the 1979 Iranian oil crisis. Such variables matter beyond energy inflation and flows into operating costs (e.g. power), freight and logistics (e.g. diesel and trucking), and in materials (petrochemicals and plastics, etc.). The good news is the market ducked a fresh supply crisis in the recent Mideast fireworks.

The above chart shortens up the 5Y to 30Y slope timeline for better granularity during the period from ZIRP in early 2021, across the tightening cycle of 2022-2023 and now into the slow Fed easing cycle in 2024-2025. We say “slow” since the FOMC is being cautious with it facing the first and only massive tariff cycle in the postwar era. It is all new and the market vs. policy makers can’t even get agreement on the basic facts of who pays the tariff at the border. That is “bizarro” disinformation world.
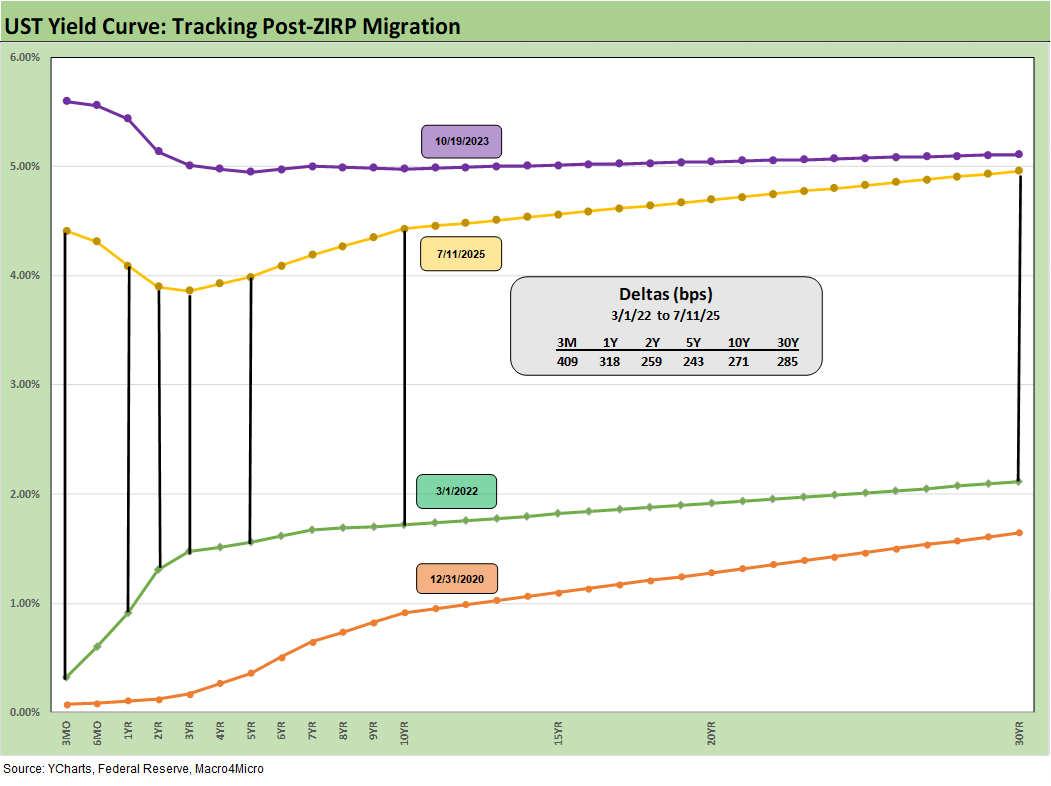
We wrap this week’s State of Yields with an update of the running UST deltas since March 1, 2022 just ahead of the end of ZIRP (effective 3-17-22). We include the 12-31-20 UST curve and 10-19-23 peak UST curve as frames of reference.
Markets:
Footnotes & Flashbacks: Asset Returns 7-12-25
Mini Market Lookback: Tariffs Run Amok, Part Deux 7-12-25
Footnotes & Flashbacks: Credit Markets 7-7-25
Footnotes & Flashbacks: State of Yields 7-6-25
Footnotes & Flashbacks: Asset Returns 7-6-25
Mini Market Lookback: Bracing for Tariff Impact 7-5-25
Payrolls June 2025: Into the Weeds 7-3-25
Employment June 2025: A State and Local World 7-3-25
Asset Return Quilts for 2H24/1H25 7-1-25
JOLTS May 2025: Job Openings vs. Filling Openings 7-1-25
Midyear Excess Returns: Too little or just not losing? 7-1-25
Recent Tariff commentary:
US-Canada Trade: 35% Tariff Warning 7-11-25
India Tariffs: Changing the Music? 7-11-25
Taiwan: Tariffs and “What is an ally?” 7-10-25
US-Trade: The 50% Solution? 7-10-25
Tariff Man Meets Lord Jim 7-8-25
South Korea Tariffs: Just Don’t Hit Back? 7-8-25
Japan: Ally Attack? Risk Free? 7-7-25
US-Vietnam Trade: History has its Moments 7-5-25
US Trade in Goods April 2025: Imports Be Damned 6-5-25
Tariffs: Testing Trade Partner Mettle 6-3-25
US-UK Trade: Small Progress, Big Extrapolation 5-8-25
Tariffs: A Painful Bessent Moment on “Buyer Pays” 5-7-25
Trade: Uphill Battle for Facts and Concepts 5-6-25
Ships, Fees, Freight & Logistics Pain: More Inflation? 4-18-25
Tariffs, Pauses, and Piling On: Helter Skelter 4-11-25
Tariffs: Some Asian Bystanders Hit in the Crossfire 4-8-25
Tariffs: Diminished Capacity…for Trade Volume that is…4-3-25