
Durable Goods Oct25: Core Capex Still in Gear
We look under an ugly headline Durable Goods number that shows core activity in slow-burn mode heading into year end.


Headline durable goods orders fell 2.2% MoM in October after two months of gains. A 6.5% MoM decline in transportation equipment, driven by a normal cycle of aircraft orders, accounts for most of the contraction this month.
Core activity held up as ex-transport orders increased 0.2% MoM in October, marking seven consecutive months of expansion. The year-to-date pace is still modest, with core orders up only about 2.4% in 2025 even as policy has been aimed at supporting business investment.
Total durable goods shipments were up 0.6% MoM and ex-transport shipments up 0.2% MoM, leaving the equipment side of GDP on a slow-growth rather than recession footing.
This morning’s GDP report underscores a split in capex. Real equipment spending grew 5.4% annualized in 3Q, largely driven by information-processing equipment, while industrial and transportation equipment were roughly flat. Together with the October durables data and stagnant manufacturing payrolls, there is little to soothe concerns about a slow grind in traditional manufacturing as the cycle ages, even if further rate cuts improve conditions at the margin.
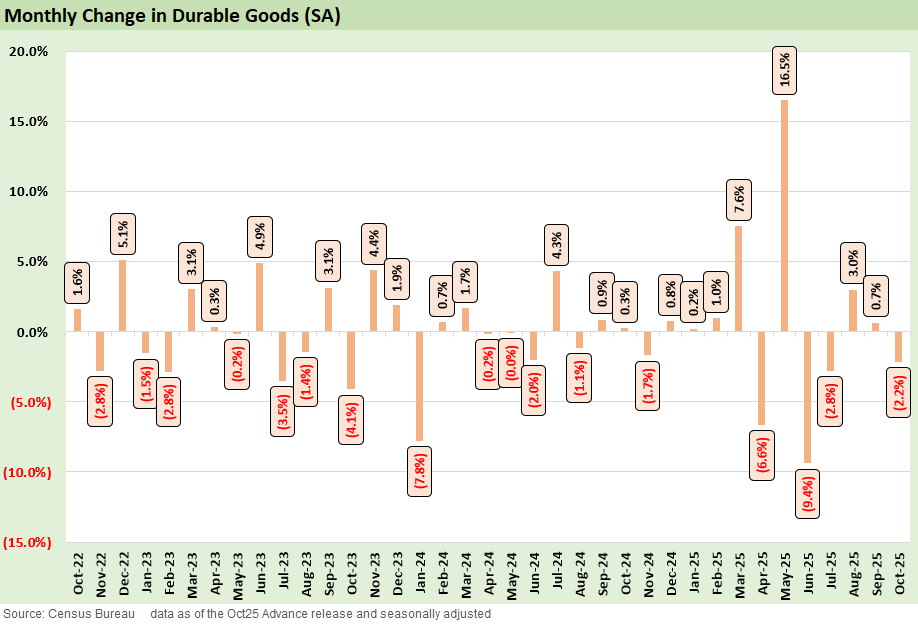
The above chart tracks monthly changes in durable goods orders and captures the 2.2% MoM dip in October after what has been a volatile 2025 for the headline series. Those very lumpy aircraft-related changes are a fact of life given their scale, and showed up again this month, even if on a smaller scale. It is a reminder of the significance of Boeing to the national economy. This month, nondefense aircraft orders down -20.1% and defense aircraft orders down -32.4% were the major swing factor to the headline.
Overall, the 2025 pace is a pretty impressive +7.1% growth in durables orders, with spikes from Boeing mega orders earlier this year driving massive March and May activity. That activity masks what has been fairly unimpressive growth elsewhere though. The ex-transport numbers for October only show a mild +0.2% gain for the month as the rest of the sectors were more mixed. Ex-transport has grown steadily throughout the year, but the net effect shows only +2.4% YTD growth, much weaker than the headline would suggest.
As we gear up for 2026, the bifurcation within capex for manufacturing looks to deepen. Despite the best efforts of trade policy to bolster domestic manufacturing, order activity and payrolls do not point to those efforts bearing fruit. Instead, the super trends around data center needs and AI build out eclipse those for traditional sectors as can be seen in the continued rapid pace of Information Processing investment in this morning’s GDP and related lines in the Computers and Related parts. We expect that divergence to continue into next year, with more questions around whether rising data investments can spur meaningful knock-on activity in traditional areas.
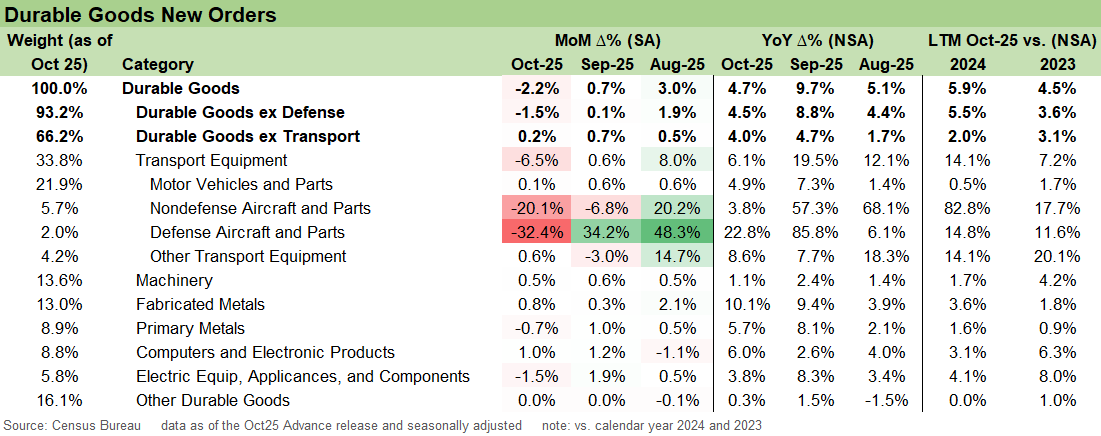
The above chart breaks out durable goods orders by category, including the ex-defense and ex-transport series. October’s weakness was dominated by aircraft, while motor vehicles and parts still eked out a small gain. Even so, the year’s profile there is shaping up as fairly anemic growth. Transport equipment as a whole fell 6.5% MoM in October after an 8.0% MoM jump in August, a reminder that for this segment the story is about a long tail of volatility rather than a simple month-to-month signal.
Outside of transport, the core manufacturing categories were mixed but fairly resilient. The largest two sectors of Machinery and Fabricated Metals both increased at +0.5% and +0.8%, respectively. The consecutive months of expansion are a positive sign for a firmer trend but the expansion still falls short of impressive growth. The other area of strong growth this month is the computers and electronic products, which contains the strongest growing computers segment. That is no surprise given the broader investment trends, and we expect that pattern to remain in place into 2026.
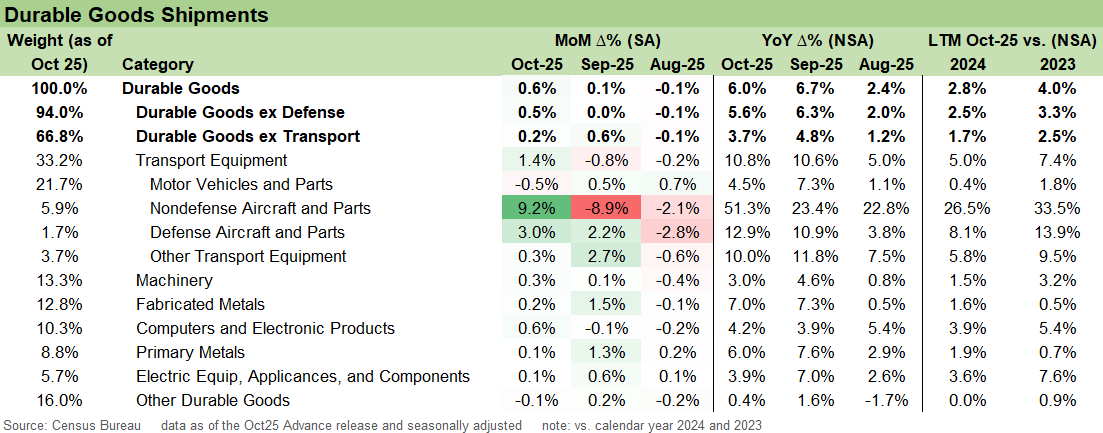
Finally, the shipments data above is the clean link to near-term GDP and revenue trends with a supportive picture for October. The +0.6% this month came in strong as it lags what has been pretty strong headline orders numbers.
See also:
Market Lookback: Last Call for Unusual Behavior 12-22-25
Existing Home Sales Nov 2025 12-21-25
November CPI: Tricky Navigation 12-18-25
Payrolls Nov 25: Into the Weeds 12-16-25
Employment Nov 2025: Bad News is Bad News 12-16-25
The Curve 12-15-25
Market Commentary: Asset Returns 12-14-25
Market Lookback: FOMC Fragments, Rate Debates Murky 12-13-25
FOMC: Dot Plot Scatters for 2026 12-10-25
Employment Cost Index 3Q25: Slowing but Above CPI 12-10-25
JOLTS: Goldilocks’ Ugly Twin 12-9-25
Mini Market Lookback: Data Digestion 12-6-25
PCE, Income & Outlays: Calendar Gap Closing 12-5-25
Credit Markets 12-1-25
Mini Market Lookback: Back into the June 2007 Zone 11-29-25
Durable Goods Sep 2025: Quiet Broadening of Core Capex 11-26-25
Retail Sales September 2025: Foot off the Gas 11-25-25
The Curve: Flying Blind? 11-24-25
Mini Market Lookback: FOMC Countdown 11-23-25
Employment Sept 2025: In Data We Trust 11-20-25
Payrolls Sep25: Into the Weeds 11-20-25
Mini Market Lookback: Tariff Policy Shift Tells an Obvious Story 11-15-25
Retail Gasoline Prices: Biblical Power to Control Global Commodities 11-13-25
Simplifying the Affordability Question 11-11-25
Mini Market Lookback: All that Glitters… 11-8-25
Mini Market Lookback: Not Quite Magnificent Week 11-1-25
Synchrony: Credit Card Bellwether 10-30-25
Existing Home Sales Sept 2025: Staying in a Tight Range 10-26-25
Mini Market Lookback: Absence of Bad News Reigns 10-25-25
CPI September 2025: Headline Up, Core Down 10-24-25
General Motors Update: Same Ride, Smooth Enough 10-23-25
Mini Market Lookback: Healthy Banks, Mixed Economy, Poor Governance 10-18-25
Mini Market Lookback: Event Risk Revisited 10-11-25
Credit Profile: General Motors and GM Financial 10-9-25
 |
|