
Footnotes & Flashbacks: Credit Markets 10-21-24
An uneventful week for the UST curve was the main variance in a week when the credit spread contraction party continued.


The credit spread diet is getting to be a challenge…
Spread tightening has been impressive and ended another good week in HY with a double-digit HY OAS contraction and new lows for IG during a week when the S&P 500 and Dow kept the all-time high streaks going.
We roll into a week with a wave of industrial bellwethers reporting with Boeing and GM likely to be the main event for the medium grade tier manufacturing sectors and some notable cyclical headliners such as UPS among many others with commodity names (e.g., metals/mining) offering some forward color on outlooks for demand expectations.
The lineup of constructive bank and finance reports from the past two weeks offer an anchor for a healthy view on a sustainable expansion as the market will cautiously turn its attention to how it should treat some glaring policy threats that only got worse lately with the tariff rhetoric in the election home stretch (see Trump at Economic Club of Chicago: Thoughts on Autos 10-17-24).

We reviewed the bond ETF returns separately and the trade-off of excess and total returns have been a bit out of alignment of late with favorable spread contraction and adverse UST curve moves since the hot payroll numbers (see Footnotes & Flashbacks: Asset Returns 10-20-24, Footnotes & Flashbacks: State of Yields 10-21-24 ). The steady and impressive spread contraction has been the main story but you can’t fight bond math.

The above chart plots the running YTD excess returns for IG vs. HY, and the relative compensation for risk keeps running the right way with HY spreads now back in the 2007 and 1997 credit peak zone (see HY OAS Lows Memory Lane: 2024, 2007, and 1997 10-8-24). The YTD 3Q24 numbers also stack up well with Oct now continuing the pattern (see Credit Returns: Sept YTD and Rolling Months 10-1-24).

The BB vs. BBB relative excess returns had been converging but then flipping as noted in the chart. That in theory means less compensation for more risk based on ratings. To the extent long-dated BBB tier names get choppy after the election, some mega BBB names will be getting put to the test. This week brings Boeing earnings and guidance, and we also get GM among others.
Boeing is the 1000-pound gorilla of headaches at this point with so much long duration bond exposure. While their problems have only amplified over the course of the year from a very rough start (see Boeing: Different Scales, Different Magnitude 1-10-24), at some point the market might start asking what a major trade conflict with China might look like for them. That would be a forward-looking nightmare for Boeing with China by far the largest buyer of commercial aircraft.
Even if it is clear that China wants and needs the capacity for its regional and metro development ambitions and attracting more trade, the idea of retaliation has a natural target in Boeing and the farm belt as two of the largest exporters to China over the past decade and looking out into the next stretch (see Facts Matter: China Syndrome on Trade 9-10-24). Boeing reports earnings on Wednesday.

The CCC tier keeps on pulling away from the compressed B tier in excess returns as noted above with some of the usual constituent migration, drop-outs (some on maturities inside 1 year), exchanges, and the issuer-specific actions that get busy around rebalancing dates and always make generalizing about the CCC tier tricky.
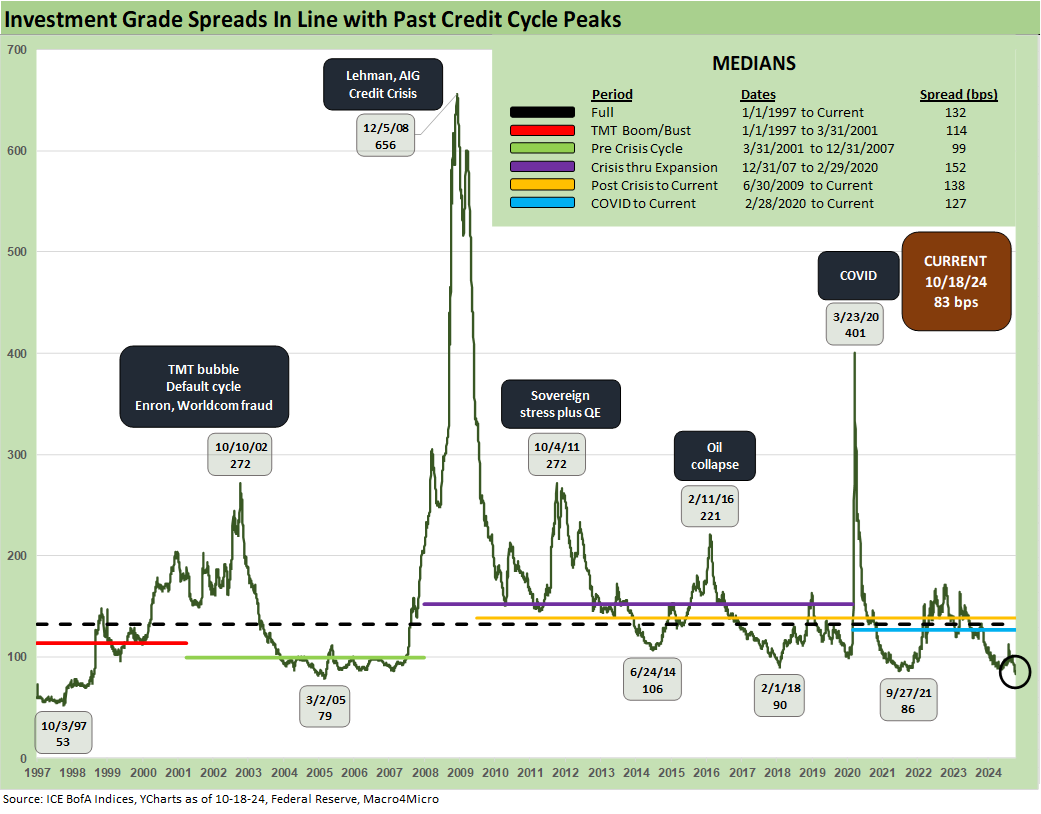
The above chart shows that IG has joined in with HY in getting down around multicycle lows with the current +83 bps only slightly about the March 2005 low of +79 bps. The 1997-1998 average for IG OAS was around +95 bps as a data point. The low OAS average in 1H07 of +86 bps was like the lows in 2H06 at +90 bps and 1H06 at +87 bps.
For some other HY peak credit markets, IG was wider in relative terms vs. pre-crisis lows in June 2014 at +106 bps (ZIRP), +90 bps in Feb 2018 (mild normalization attempts by the Fed during that period), and Feb 2021 at +86 bps (ZIRP). Those dates offer useful frames of reference. The +53 bps low of Oct 1997 remains “other worldly” and 1997 saw +70 bps by year end in IG.

The above chart updates the HY spread history, and the rolling HY OAS contraction of -10 bps for the week and -33 bps for the trailing 1-month has been good news all around. We looked at these histories in a recent commentary (see HY OAS Lows Memory Lane: 2024, 2007, and 1997 10-8-24, HY Spreads: Celebrating Tumultuous Times at a Credit Peak 6-13-24).

The HY vs. IG spread differential of +205 bps is near the lows of 2021 and 2018 but well inside the June 2014 lows even if dramatically wide to the early June 2007 lows as noted.

The BB tier OAS at +178 bps is inside all the pre-tightening cycle lows since the credit crisis of 2008 but modestly above the mid-2007 lows of +171 bps. We had a slightly lower tick in July 2024 at +172 for the lows. We see +186 in Jan 2020 just before COVID and +203 bps back in Oct 2018 lows before spreads unraveled in 4Q18. The long-term median is +301 bps, so the current BB backdrop is extraordinary.

The “BB OAS minus BBB OAS” differential is at +73 bps or comfortably above the July 2024 lows of +55 bps and the +57 bps seen in Dec 2019 in what was a par plus HY market that ran into a COVID swoon shortly after.
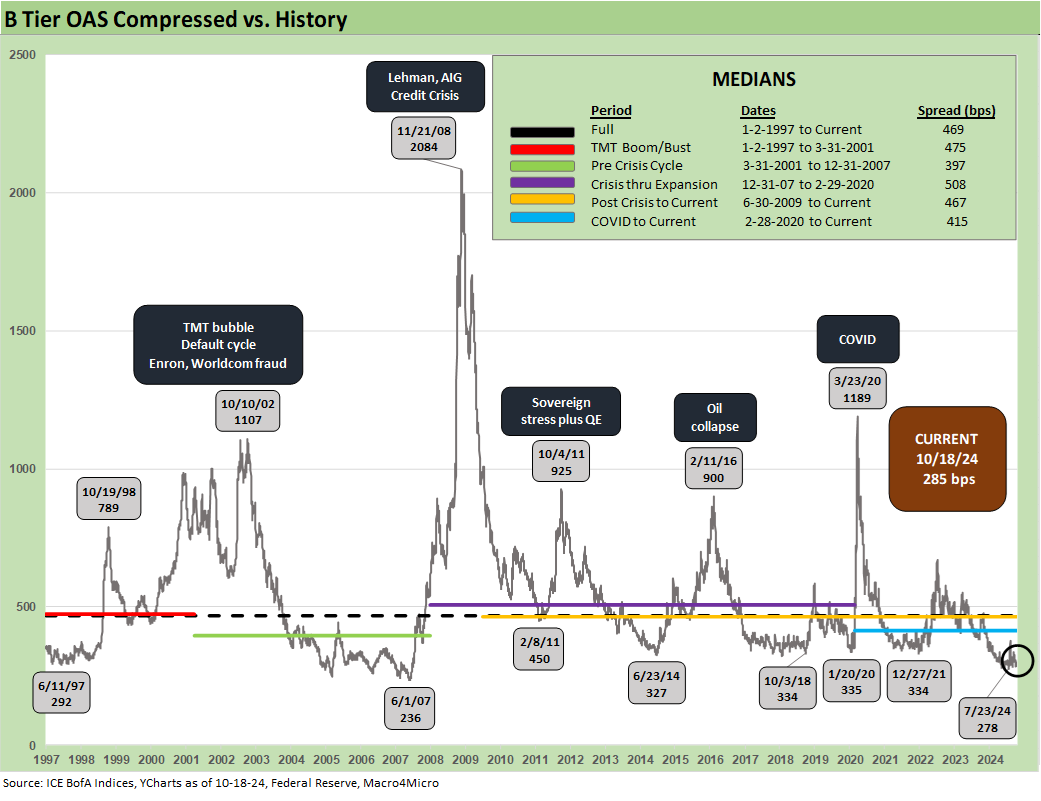
The B tier has been a very impressive contraction story at +285 bps and is slightly above the +278 bps low of July 2024. Looking back at the Dec 2021 and Jan 2020 lows and the spread lows of Oct 2018 and June 2014, the sub-300 bps OAS levels are in a different zone than those days.

We revisit the long term CCC tier spread history and set it against the B tier for a memory lane trip on where we can see the radical disconnect between B and CCC tiers at various market trigger points. We have looked at the B vs. CCC tier relationship in past commentaries with more color on the compare-and-contrast of those days when CCCs showed much more volatility and a much riskier CCC mix (see The B vs. CCC Battle: Tough Neighborhood, Rough Players 7-7-24.).
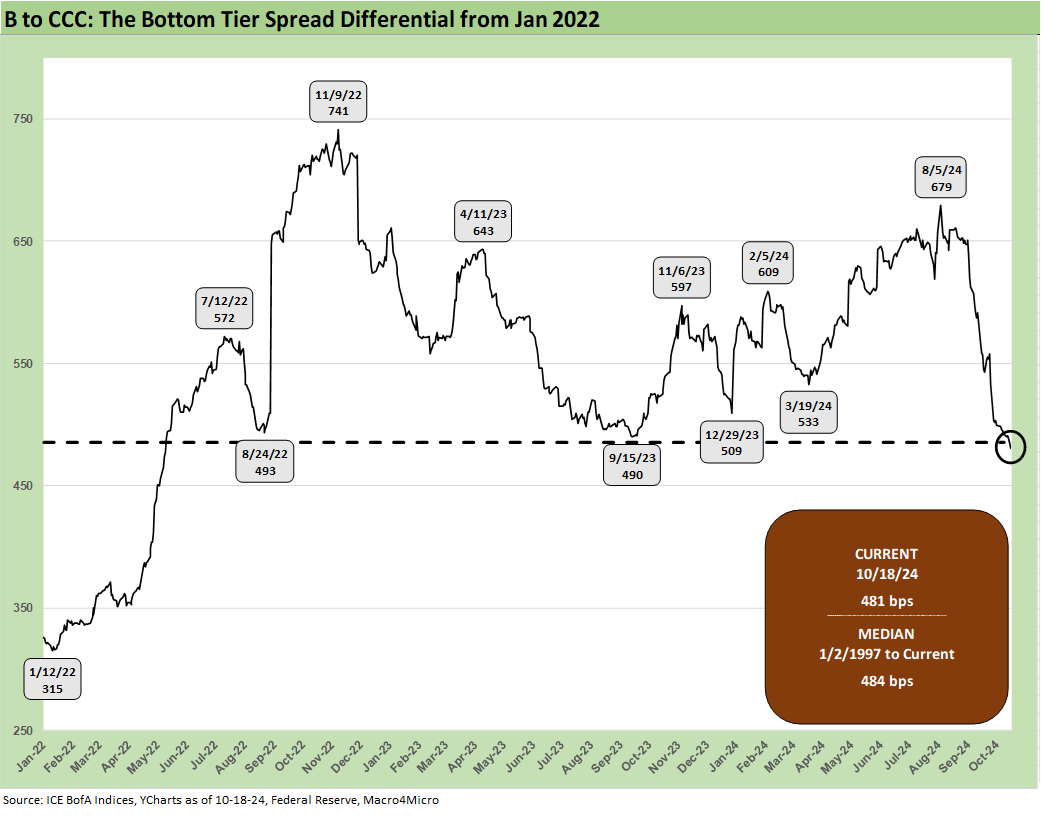
The above chart updates the “CCC OAS minus B OAS” differential. We saw a wild ride higher and lower since late 2023 with the current level hanging around the post-1997 differential.
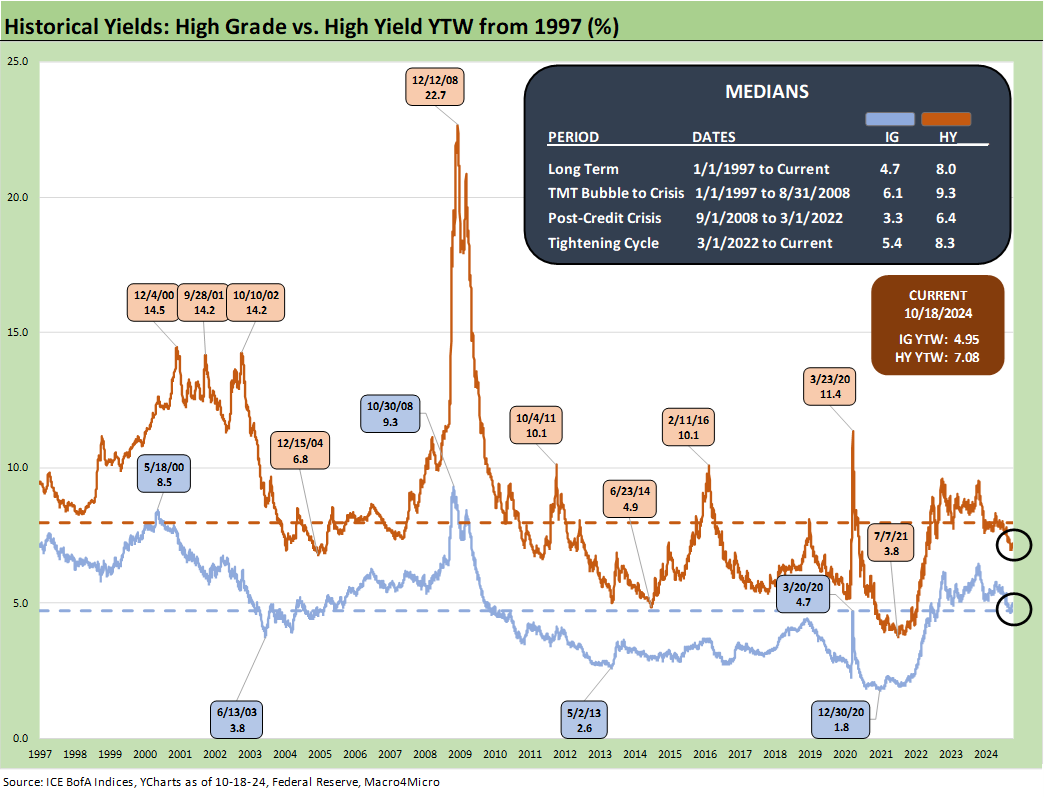
The above chart updates the IG and HY index yields across a range of time horizon medians. We see the pre-crisis yields of 6.1% for the IG index and 9.3% for the HY index as the most relevant comparison to the post-tightening cycle yields and now into the new easing cycle.
The markets outside the ZIRP and normalization timelines offer a more rational frame of reference. If you are planning on a crisis such as 2008 and COVID in 2020 to elicit such a Fed ZIRP response, then your other major problem will be the current tight spreads.

The above chart plots the IG Index yield for Friday close and sets that against two credit cycle peak periods in late 1997 and mid-2007. We also plot the UST curves for the same dates. The anomaly of the current curve and the exceptionally low interest rates of this period are certainly clear as some people talk about runaway interest rates. You don’t get ZIRP back and sub-3% 10Y UST unless inflation is gone and something is wrong in the economy. Ongoing record deficits will need a lot more demand and be able to clear the market.

The above chart does the same exercise as the prior chart but for HY index yields. The index yields are again on the horizontal lines and broken out in the box. Tight spreads and low UST curves do not create the most attractive symmetry looking ahead into 2025 if Trump goes the broad and high tariff route with mass deportations. Election Day should lead to some fresh risk pricing debates subject to how the votes, legal challenges, and potential insurrection activity play out.
See also:
Footnotes & Flashbacks: State of Yields 10-21-24
Footnotes & Flashbacks: Asset Returns 10-20-24
Mini Market Lookback: Banks Deliver, Equities Feel the Joy 10-19-24
Housing Starts Sept 2024: Long Game Meets Long Rates 10-18-24
Trump at Economic Club of Chicago: Thoughts on Autos 10-17-24
Retail Sales Sep 2024: Taking the Helm on PCE? 10-17-24
Industrial Production: Capacity Utilization Soft, Comparability Impaired 10-17-24
Footnotes & Flashback: Credit Markets 10-14-24
Footnotes & Flashbacks: State of Yields 10-13-24
Footnotes & Flashbacks: Asset Returns 10-12-24
CPI Sept 2024: Warm Blooded, Not Hot 10-10-24
HY OAS Lows Memory Lane: 2024, 2007, and 1997 10-8-24
Footnotes & Flashbacks: Credit Markets 10-7-24
Footnotes & Flashbacks: State of Yields 10-6-24
Footnotes & Flashbacks: Asset Returns 10-6-24
Mini Market Lookback: Cracking the 300 Line in HY 10-5-24
Payroll Sept 2024: Rushing the Gate 10-4-24