
New Home Sales July 2024: To Get by with a Little Help from My Feds?
With plenty of homes for sale both completed and under construction, July brought a needed solid month with favorable May and June revisions.


Maybe Trump the “builder” and Harris can find some specifics to debate on housing?
We ponder how the Harris plan (details to come) could be a great debate topic, so she can show her mettle vs. the often fact-free and concept-lite Trump in a sector where he should have some indirect experience thinking through single family economics.
The housing sector needed some good news on volume in the summer, and a sharp upward revision of May and June new home sales joined a solid sequential rise in July that brought good news for those builders looking to sell down inventory and possibly get home starts volumes closer to stabilization. Mortgage rates will remain under scrutiny with the FOMC easing ahead.
Some material upward revisions of around 10% in the critical region of the South for the past 2 months (+38K June, +36K May) then saw July US new home sales tick up +10.6% from revised June numbers while bolstering YoY levels for the total US July numbers to +5.6%.
Given the number of homes in the “for sale at end of period” for both “completed” and under construction,” the builders needed some good news, which Powell also delivered at his speech in Jackson Hole. That sent the major public homebuilders and the small public retail brokerage peer group into big stock price days on Friday.
This coming week we will get a range of data with Personal Income & Outlays (PCE inflation) along with the second estimate on 2Q24 GDP with a lot of eyes on any PCE revisions.

In this commentary, we update the latest in new home sales in a market where the homebuilders have ranked among the best performing equity groups across 2023 into 2024. The industry is going to have the potential to see a move lower in the UST curve that might support mortgages in the fall. The FOMC hope lit up the screen and the builder stocks this past week.
The chart above shows the 739K new home sales posted in July. That is comfortably above the long-term median and all other time horizon medians we break out in the box with the notable exception of the housing bubble and implosion that spanned 2001 to 2009. That housing boom and mortgage origination excess saw a 989K median that featured a July 2005 peak of 1,389K.
The mortgage headwind still a drag on affordability but sequentially improving…
Mortgage rates directly flow into affordability through monthly payments, and that is the linchpin for the fall. For the summer winddown, the ability of the homebuilders was important in cleaning up some stubbornly higher inventory levels. The recent soft numbers relative to market expectations earlier in the year have flowed into weaker starts numbers as builders watch their working capital management.
Completed homes for sale are at a high while “under construction” for sale are getting slowly whittled down. The “under construction” homes sold during the period were higher than those “under construction” for sale. The actual sale of completed homes during the month was triple the completed homes for sale, so we don’t see any issues there. That is especially the case if rates come down. This was a strange period where a lot of spec building was necessary even for builders who would typically be overwhelmingly “build to order” in normal times.
As we detail below, some major initiatives Harris has proposed include housing and healthcare. These are two topics that are hugely impactful on household finances. We discuss the housing issues further below.
The sustained expectation of a 10Y UST decline holds the key to 30Y mortgages getting down into the 5% handle range. A move into 5% handle mortgages is a very big ask with 10Y UST levels already quite low across history (see our “Footnotes publications” on the State of Yields each week). If the 30Y does in fact make it down to a low 6% or higher 5% range, that will give the builders even more room to maneuver while taking down monthly payments and costs through their range of incentives (mortgage buydowns, fees, pricing, etc.). Builders very successfully navigated a very tough environment already at much higher mortgage rates.

The chart above updates the 10Y UST and Freddie 30Y Mortgage benchmarks. That has been a tough ride for existing home seller decision-making, but the builders have done a great job driving margins and cash flow even in the face of the adverse moves (see Homebuilder Equities: “Morning After” on Rate Optimism 7-12-24, Homebuilders: Equity Performance and Size Rankings 7-11-24).
Housing and Healthcare would be a great debate topic: Harris has prioritized both, Trump ducks Healthcare and is mute on Housing policy. Let the games begin.
Let’s see if the health care topic or housing get submitted or raised or ducked by either party in a debate. There is also the question of whether the moderators will do their jobs this time. Then we will know whether ABC is as useless as CNN. That is especially the case when Trump says to any specific question, “Dying nation, China is killing us…radical leftists, Communists, Marxists and Fascists are everywhere.”
When asked about either health care or housing, Trump will not offer any details. That is a good reason to bring it up. Trump can hit Harris on mortgage rates being high, but Harris can hit back on having a plan and citing how well the builders have done while emphasizing buyers need more affordable supply, lower prices and mortgage relief through regulatory change and fiscal support. She can state that she will pursue that course while Trump will go golfing. If Trump will not answer, Harris can take a stand.
“Listen Donald, I am proposing a plan to help potential homeowners that your billionaire buddies can pay for in cash 100 times over. Why don’t we have more tax revenues to go in that direction of entry level homes for the working class?”
“Donald does not want to talk specifics on housing or health care! What’s up with that? He is not a serious man.”
That would be interesting. Trump would lose the right to say, “Harris does not talk specifics.” Meanwhile, Trump clearly lives mostly in a world of adjectives and insult nouns. Housing needs are a real focus and not a talk-around. As someone who grew up in a 1,000 square foot house (including the garage), it is not a tough question for people to know what a working-class house costs and what the problems are in this market. Both candidates claim to be the ones looking out for the average Joe (In the Harris case, the average Jack and Jill).
Knowing what the costs are in this market for such a house is not too hard. It gets published every month by price tier by the Census bureau. The Census data is in the Department of Commerce with the BEA and BLS that Project 2025 wants to collapse, purge, and downsize while tightening White House direct control of the data). Trump’s main specifics on the housing topics has been that deporting more than 10 million people would free up some space and bring prices down for residential real estate, whether rental or ownership. He also has paid lip service to environmental and permitting rules.
Deportation as a housing inflation control mechanism is, if anything, novel. But the questions then are “What is the cost of mass deportation, what labor inflation risk lurks, and which countries will go along with it? This past week Trump indicated that he would “tariff” and shut down trade with nations that do not cooperate. That has Mexican trade and supplier chain risk written all over it (see Trade Flows: More Clarity Needed to Handicap Major Trade Risks 6-12-24, JOLTS June 2024: Countdown to FOMC, Ticking Clock to Mass Deportation? 7-30-24).
Maybe the debate audience can see if Trump knows what the conforming Freddie Mac loan limit is in Palm Beach or Dallas or what a high price carveout is above that. The same for Harris in the CA Bay area. Some remote familiarity might be good when housing costs and monthly payments are a problem.
As a frame of reference, 11% of new home sales (based on units) were under $300K in July and 17% were in the $300K to $399K range, which was the highest share. Trump freaks out over numbers, but then again so do most Democrats until their aides write their proposals. If Harris wants to talk housing, she has an opportunity here to expose “Trump the finance guru.”
Housing details are boring and require close review. If Trump wants to answer a specific question with a specific answer or with something resembling a number, that would in turn mark the equivalent of a Loch Ness sighting. Harris still needs to face that test. That would be a nice showdown with someone Trump calls “dumb” all the time.
Policy specifics will matter from both sides….
The news on housing as a priority for the Harris campaign signals that we will see a wider range of ideas once the Harris proposal terms get below the headlines. We will look at those ideas when more granularity is provided. I would hope the legislative architects and policy wonks spend some time on the NAHB website (National Association of Homebuilders) for a checklist that covers a wide range of topical areas critical to the housing cost equation. The NAHB cites factors that drive up the costs of building a home, thus pushing prices higher to meet long term average margin expectations. Simply put, take costs out as mortgage rates decline and housing supply will grow with favorable economics to both builders and buyers.
Harris would not face a lot of headline risk on housing if she cites a few key NAHB items. After all, it is all laid out for them. Then she can add in her tax credit and fiscal angle. All you need to know is where the median price of a new home stands in the mix, what the problems are for entry level product tiers (mortgages have been coming down and will likely keep coming down through Election Day). The housing market also had plenty of problems in 2018 with the builders being one of the worst performing asset classes before the Fed rode to the rescue in 2019 and 2020 (see Histories: Asset Return Journey from 2016 to 2023 1-22-24).
So far, the main ideas in Washington D.C. around housing have been about reducing and taxing the investment capital flowing into home purchases (the “Stop Predatory Investing Act” was introduced last year, the HART Act in 2024). The left wants less dollars from investment funds buying fewer homes.
That legislation is more about the progressive sheet music crowd without them peeling back layers around which policies would impair expansion of the housing stock and others which would reduce exit bids for homeowners. That is intrinsically bad for liquidity in the existing housing market. A worry is that homebuyers are being pushed out of the market when mortgage rates are high. In fact, more housing supply would be a blessing over the longer term, so restricting capital inflows is a bad idea once you look at the secondary and tertiary effects. Public capital plus private capital will drive more supply of housing.
The proponents say institutional builders’ gouge on rents. Adding a million entry level housing units with government support for household buyers would revert that “gouge theory” back to the laws of supply and demand for single family at a time when multifamily is coming off a big supply cycle.
The search for a residence needs more alternatives and supply in single family, but the yardstick cannot be solely framed as a traditional suburban model of ownership (“Donna Reed Show” meets “Father Knows Best” meets “Leave it to Beaver”). There are many different financial profiles and consumer preferences across buyers vs. renters that vary widely by region/MSA.
Some policy architects have proposed adding a 40-year mortgage benchmark to lower monthly payments or adding terms to new mortgages that allow buyers to assume the mortgage with a home purchase rather than refinance. The latter idea is a big ask. Even trying such a plan with current outstanding mortgages is arguably an impossible ask and would wreak havoc with financial lenders and flag the risk of mortgage investor damage. After all, a contract is a contract. The government would lose anyway in court.
The policy questions are straightforward enough:
Does the legislation undermine the ability to increase new housing supply?: Expanding the new home inventory whether to buy or rent adds alternatives and thickens the plot in the rent vs. buy decision. It is not up to Congress to make the decision for those seeking a residence (rent or own) by reducing their options. We hope that the attack on capital from investment funds is just a “progressive signaling” exercise given the main sponsors in the Senate. A lot can be done in policy or cost-distorting regulation as well as fiscal support, but it takes household capital to buy homes and investment capital (builders or funds) to build them at a high rate and reduce the demographically driven shortage.
For D.R. Horton (DHI) with its build-to-rent business (built to sell to investment capital) and on the smaller side of the ledger with LGI Homes (LGIH) doing bulk sales to investors has a place in favorably managing the supply-demand profile for a “place to live.” We choose DHI and LGIH as examples since they have the lowest overall average sales prices in the major builder peer group. Penalize them and the supply potential is lowered.
Does the legislation impair the ability of the homeowner to get a fair bid on the property?: The ability of the homeowners to find the best buyer available at a reliable transaction price (ability to transact and at the pace needed by the seller) dictates the ability to free up home equity for a liquidity need (relocation, a “move up” purchase of a new or existing home, or to pay for college, etc.). Reducing the supply of capital is intrinsically bad. The Harris plan came with headlines citing tax credits, downpayment assistance and other points. The number cited was 3 million units getting thrown around.
To be clear, the homes don’t get built by the good house fairy. The availability of labor, subcontractors, supply chains, mortgage financing, etc. are all big parts of that. Fiscal support for vocational and training programs would bring a lot of high paying jobs as we have so often heard on builder conference calls over the years. Subcontractors would invest with confidence (the “builders” don’t do the building from people or equipment on their books). That would be a skilled jobs boom across many small and midsized businesses in the supplier chain with multiplier effects into a wide range of supporting services.
If Harris made housing the cornerstone of her economic campaign priorities and executed in an economically rational manner, that would earn a place in the history books (and voters’ hearts). Obama had his health care home run, Trump had his tax cuts (which he damaged with tariffs), Biden had infrastructure and CHIPs (the jury is still doing the “12 Angry Men” thing on electric vehicles). Harris would support lower prices as more than a talking point that could soon fade in the absence of a defensible economic case if not handled in a balanced manner.
With massive tariff increases on the agenda from the Trump side and this week’s threat to “tariff” (a new oft-used action verb) any country that does not take back the mass deportation of immigrants back to their country, the stress level of supplier chain cost predictability will only rise and maybe the yield curve and UST rates along with it in 2025. That is, unless a recession kicks in on the back of the tariffs and trade wars.
The combination of lower mortgage rates will in theory free up existing sales inventory and transactions. More supply of existing homes for sale in the market will in theory pressure home prices lower. That can influence the price of both new and existing homes with the monthly payments coming down on lower mortgages. That is the home run scenario for a housing policy. Policy makers need to consider the factors staring them in the face and to consider the production chain and critical role of the builders.
Back to July home sales…
Below we run through a few more of our metrics charts on new home sales that we look at each month. We try to tag team our perspective on industry trends in the macro releases with what we are hearing from the builders at sea level as detailed in some of our single name work (see links at bottom for recent articles).
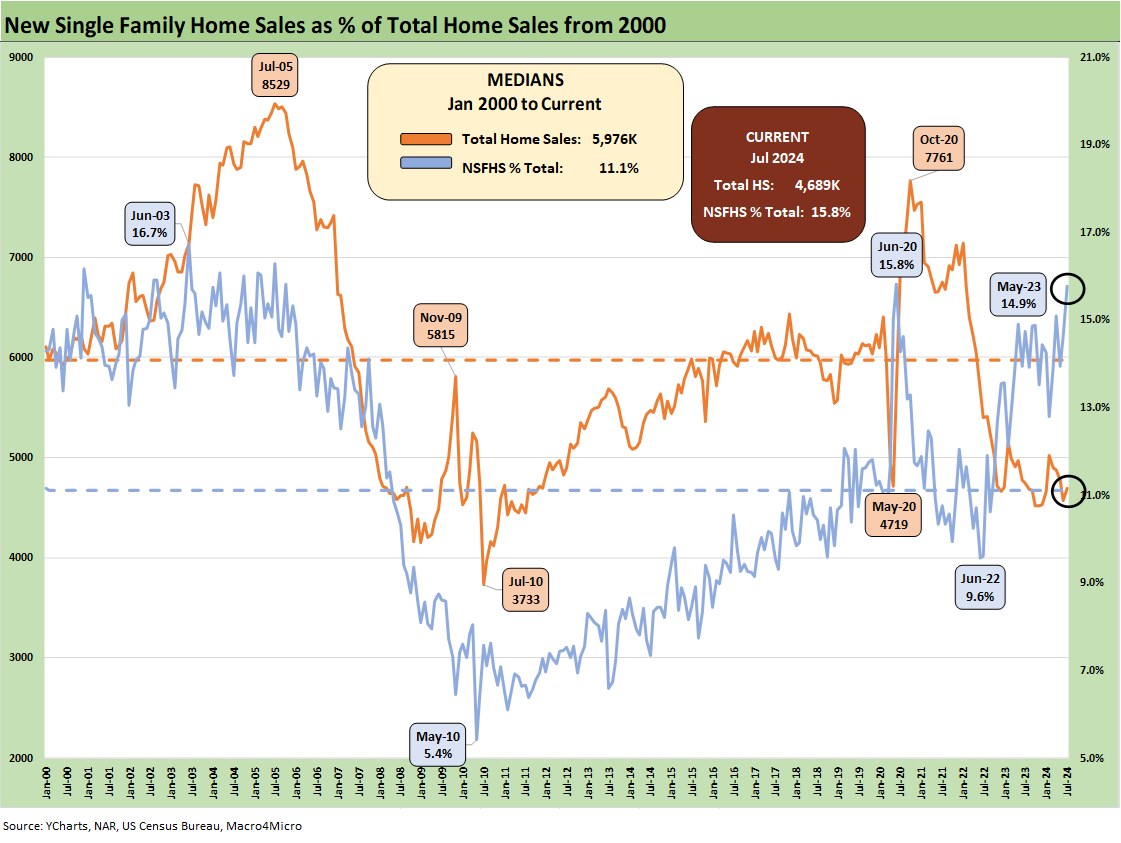
The above chart frames the time series for new home sales as this monetary cycle has seen builders taking a greater share of total home sales. We see the new single family home share around 15.8% or more than 4 points above the long-term median. For this purpose, total existing home sales + total new single family home sales = total home sales.
We updated the long-term median for a spreadsheet and Census data issue, and the median was lowered to the 11% handle range from the 12% range. Builders’ share of total home sales is still well above the norm for all the reasons we have been routinely discussing.
Builders have been able to use their arsenal of incentive strategies to pick up share with existing inventory tight (but getting looser) and major builders able to use their captive or JV mortgage operations to buy down mortgage rates into lower near-term financing costs for buyers who need financing. The incentives are a marketing cost in substance, but margins have still stayed strong for most builders, and many have improved.
We have covered the existing home sales inventory challenge in the past, and the topic gets swept up in the higher shares of existing homeowners with 60% of them at 4% or lower and around 30% of mortgage holders at 3% or lower. Those carrying low mortgage rates get tagged as economically “locked in” given the need/desire to wait for lower rates before unlocking all that home equity.
The other side of the existing home sale could be a move up trade, an empty nester move, a plan to monetize home equity for other expenses, a need to deal with a relocation move tied to employment, in the event of divorce, etc. Low monthly payments have been a household cash flow blessing for most, but circumstances and needs change for homeowners.

The above chart plots volume vs. median prices. The affordability challenge takes higher prices and mortgage rates together to compound the problem with the very high sensitivity of monthly payments to the mortgage. For “Not seasonally adjusted” median prices, we see a $430K median for new home sales this month, up from $417K in June. The LTM low was $408K in May 2024. The trailing LTM high was $441K in Aug 2023. These prices always come with the asterisk of regional mix and product tier. The average (vs. median) sales price was $515K in July, highlighting the long tail to the high-end prices in luxury.

The above chart gives a more granular time series on median prices since Jan 2020, or just before COVID. As we mention in other parts of this commentary, the Jan 2020 to current numbers saw a slew of restatements and methodology changes in May 2024. The changes had the effect of lowering the Census 2022 prices from inflated levels in the pre-May disclosure.
We use the Census data here, but we take our cues from the builders on actual ASP trends. D.R. Horton is the industry leader with a lower ASP than major peers while Pulte is a higher ASP operator with impressive national breadth. Across the major builder peer group, those that show high geographic concentrations in the West typically lead in ASPs although Toll posts a million-dollar ASP based on its metro area mix region as well as product mix.
We have been covering the adverse post-2020 prices trends for buyers for quite a while in our macro work and single name work, and the laws of supply and demand have not changed over the cycles or the centuries of where the supply and demand lines connect.
The highest margins for most of the builders was in 2022, but that is subject to fiscal years and built-to-order players vs. spec heavy builders. The timing of contracts rolling off in 2022 saw orders collapsing for a while and then the order recovery resuming fairly quickly. Looking at names such as D.R. Horton, Lennar and Pulte in the top 3 gives a good national perspective with NVR at #4. Toll Brothers operates in a world of its own in the luxury segment.
A combination of “flight to the burbs” during COVID in later 2020 and early 2021 had sent supplier chains into disarray at the same time related services (lending, freight and logistics, real estate brokerage) went into a period of serious strain. Supply was tight, demand was high, cycle times were long, and mortgage rates low until later 2022. It is not rocket science in terms of the home price impact – as in higher.
The low mortgage rates that came out of the COVID panic had materially boosted demand for new and existing homes and mortgages, whether for purchase or refinancing. Then came inflation and the tightening cycle and the upward migration of the UST curve to near 8% mortgage rates that we are all too familiar with at this point before the recent declines.

The above chart offers one more angle on the new home sales price history from just before the tightening cycle. The Census data on new home sales and prices went through a raft of changes and restatements this year, but we always have a directional check from the builder peer group with their timeline trends of average sales prices, volumes, and margins.
We could see prices stay in a range-bound plateau for some time until more new supply can come on the market or more existing home inventory. Builders will stick to closely managing their starts with their deliveries and sales expectations until the variables shift.
The Harris plan has the flavor of shifting those variables in lower price tiers. Even if supply looks set to get a lot of incentives, down payments and debt to income ratios and the usual factor in mortgage underwriting cannot be isolated. That means the Fed and how inflation expectations and UST borrowing needs (and where on the UST curve bonds get issued) will evolve in the fall and post-election period.

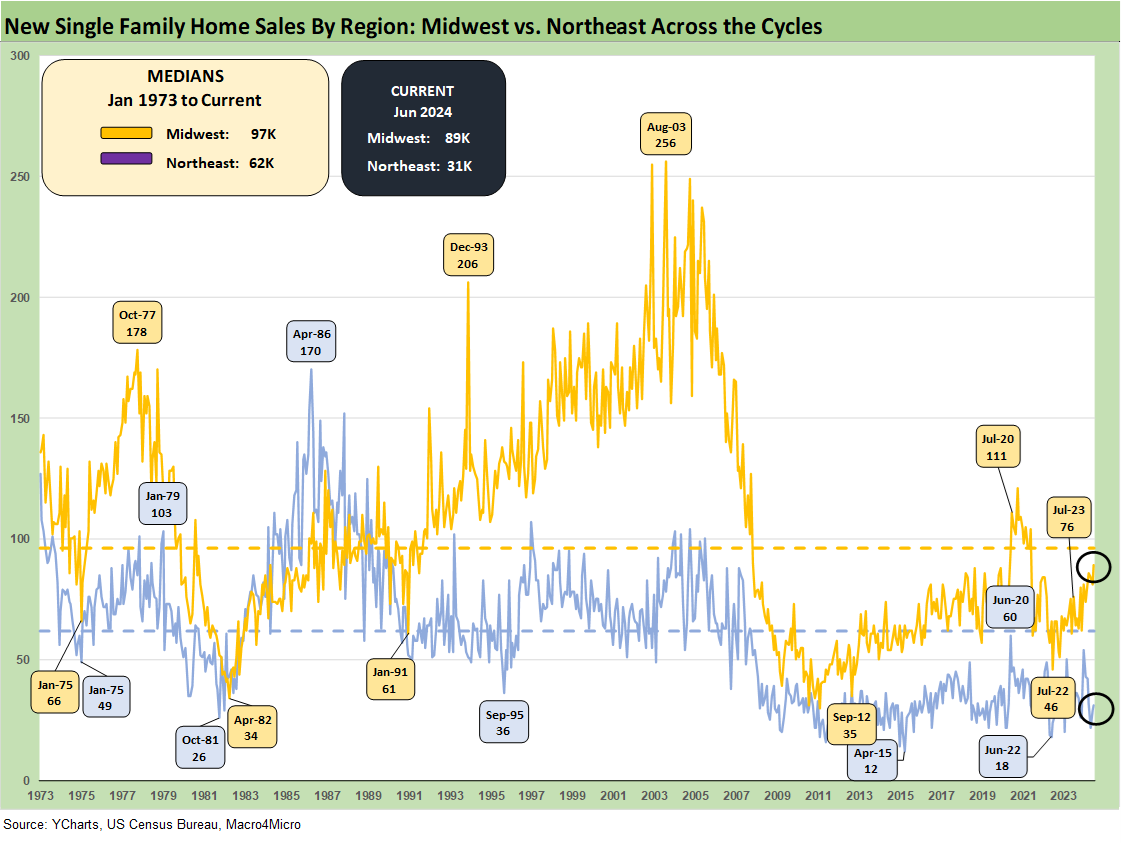
The above chart updates the volume history for the #1 region (South) and #2 region (West). The South, with its Texas and Florida anchors, comprised almost 84% of July US home sales. The South was over 57% and the West over 26%. The Midwest + Northeast (next chart) combined for over 16% with the Midwest at 12% and the Northeast over 4%.
Housing and Homebuilders:
Existing Home Sales July 2024: Making a Move? 8-23-24
Housing Starts July 2024: The Working Capital “Prevent Defense” 8-16-24
Credit Crib Note: PulteGroup (PHM) 8-11-24
Credit Crib Note: D.R. Horton (DHI) 8-8-24
New Homes Sales June 2024: Half Time? Waiting for Mortgage Trends 7-24-24
Existing Home Sales June 2024: Supply Up, Prices Up, Volumes Down 7-23-24
Housing Starts June 2024: Still All About the Deliveries 7-17-24
Homebuilder Equities: “Morning After” on Rate Optimism 7-12-24
Homebuilders: Equity Performance and Size Rankings 7-11-24
Credit Crib Note: KB Home 7-9-24
Lennar: Key Metrics Still Tell a Positive Macro Story 6-20-24
Credit Crib Note: NVR, Inc. 5-28-24
Toll Brothers: A Rising Tide Lifts Big Boats 5-23-24
Credit Crib Note: Taylor Morrison 5-20-24
See also:
Payroll: A Little Context Music 8-22-24
All the President’s Stocks 8-21-24
Footnotes & Flashbacks: Credit Markets 8-19-24
Footnotes & Flashbacks: State of Yields 8-18-24
Footnotes & Flashbacks: Asset Returns 8-17-24
Retail Sales: Third Wind? 8-15-24
Industrial Production: Capacity Utilization Trends 8-15-24
Total Return Quilt: Annual Lookback to 2008 8-14-24
CPI July 2024: The Fall Campaign Begins 8-14-24
Glenn
Maybe "price controls" would help lower home prices so everyone could take the 25K helicopter money and afford a house.
Take care as November comes nearer sure things will get even more crazy
Regards