
Mini Market Lookback: Banks Deliver, Equities Feel the Joy
Earnings ramp up after big banks deliver a crucial piece of the puzzle for steady fundamentals ahead of a post-election risk recalculation.


I collected hundreds of billions from China, and I don’t care what you say. Seller pays. Everybody knows that.
With voters and investors approaching a literal and metaphorical D-Day on E-Day, the solid performance of the banks constitutes a very important X-factor by offering reassuring color on the borrower base in cyclical context and fortifying confidence around credit contraction risk.
For IG and HY credit, the week was a hard one to find fault with on minimal moves in the UST curve over the course of the week (depending on data source and timing of mark). IG spreads were very slightly tighter and HY posted up another solid compression week as both IG and HY are down into the zone of multicycle lows (see HY OAS Lows Memory Lane: 2024, 2007, and 1997 10-8-24).
The UST trend of late brought more upward pressure on mortgage benchmarks, but the net duration impact on bond asset returns for the week was low relative to some recent weekly performances.
For equities, it is hard to argue with the longest weekly winning streak of the year for the S&P 500 with 9 of 11 S&P 500 sectors positive, the NASDAQ and Dow positive, and the US-centric Russell 2000 putting in the highest positive move of the group. With 47 record highs, the S&P is closing in on its 50th record high of 2024 as the Dow hits a record #40 all time highs this past week.

We will dig into more asset returns, UST curve, and credit spread numbers from more angles in our later Footnotes publications, but the good news for investors this week was that the performance of risky assets has stayed steady even as the political news gets more volatile and Election Day draws closer with early voting underway. The highlight of the week for us was the Bloomberg interview of Trump at the Economic Club of Chicago (see Trump at Economic Club of Chicago: Thoughts on Autos 10-17-24). Any objective rational person concerned about the market or the economy should watch it from beginning to end. You make the call.
We plot the credit spread comparison above as the lead chart this week. One of the bigger distinctive asset class stories of the past few weeks has been the move in credit spreads back closer to the days of the 2007 credit bubble and late 1997 credit cycle peak.
Those markets were each very distinctive with 1997 benefitting from an easing cycle and curve rally and the economy having a few more years of the economic cycle to run on the way to a TMT bubble implosion starting in 2000. The market then sent Greenspan into a frantic easing cycle in 2001 into early 2004 that set the stage for the housing bubble and structured finance binge that brought the 2007 credit cycle peak (see Greenspan’s Last Hurrah: His Wild Finish Before the Crisis 10-30-22).
In 2007, a fuse was burning down to a systemic crisis. This current market is quite different than 2007 from a wide range of vantage points (monetary cycle, quality mix, industry concentrations, etc.) as discussed in other commentaries (see HY Spreads: Celebrating Tumultuous Times at a Credit Peak 6-13-24, Wild Transition Year: The Chaos of 2007 11-1-22).
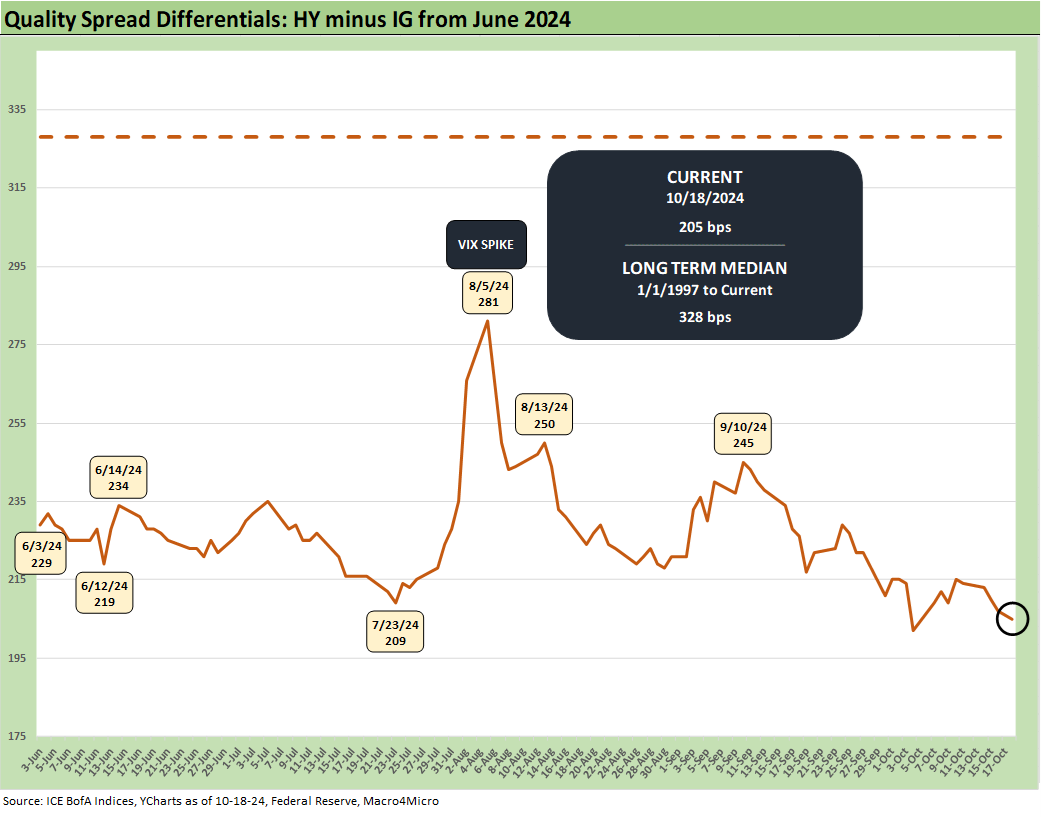
As noted above, the quality spread compression between HY and IG is running dramatically below the long-term median. The fear factor in the HY market remains low even if seasoned vets in HY understand the volatility exposure that can be tied to equity swings. Strong banks, steady credit availability, and low forward-looking default expectations are helpful. Credit contraction is the ultimate recession catalyst, and that is very reassuring at this point. The bank lender surveys are a much smaller part of the picture than they used to be, but the October quarterly survey is due soon.
The fact that the low end of HY presents a much different profile than past cycles mitigates some of the worst quality spread differential gap risks into the weak B and CCC tier with so many of the “crazy late cycle deals” migrating over to private credit. That creates a better technical backdrop in the context of HY bond fund outflow panics but also implies a lower overall default risk profile for the HY bond issuer base.
As we have cited in past commentaries, debt-funded capex (and cash flow bleeding) sectors such as the “shale oil” and emerging E&P sector and earlier TMT cycle in the late 1990s are less prevalent. Such issuers as E&P borrowers and leveraged fiber players lived by access to credit to fund the expansion capex and stem the bleed when the revenue models did not quite pan out.
The correlation pain in those industries was high and especially in E&P where they basically were all driven by the same short list of variables (oil and gas prices). Such names are not dominating the mix story in 2024 on the way into 2025. Private credit may even offer some restructuring candidates some lifelines on liquidity while not being dependent on the major banks.
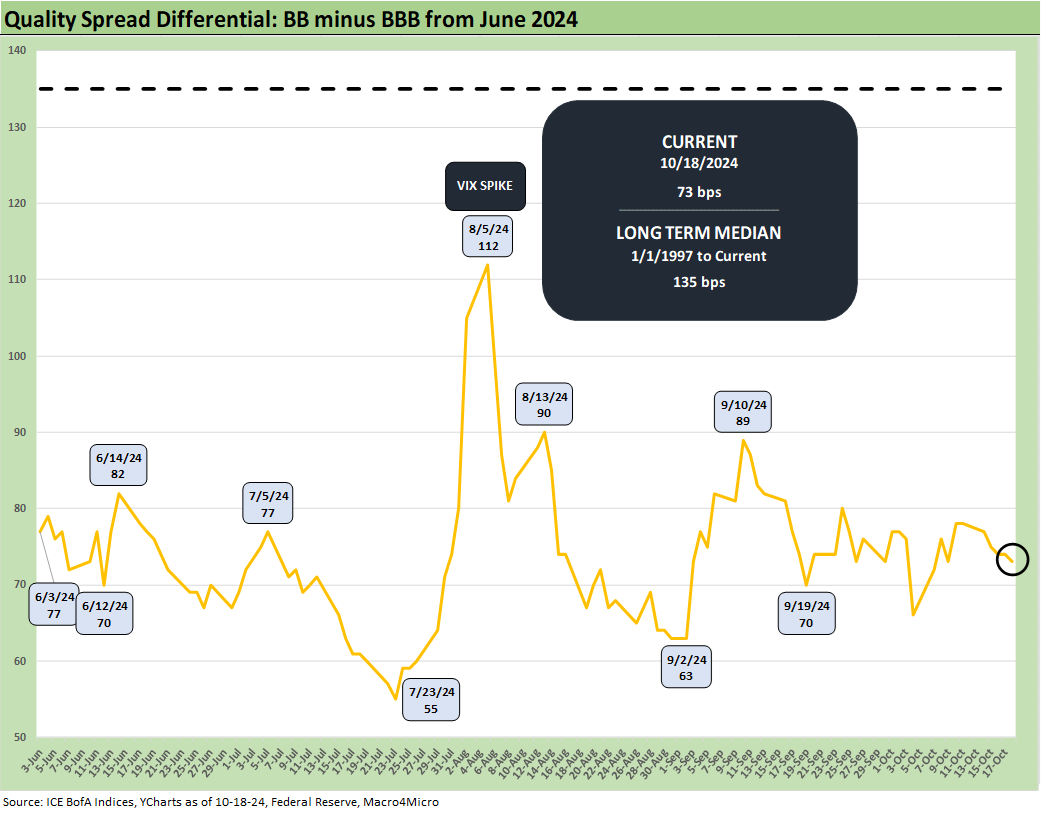
The above chart updates the BB vs. BBB tier quality spread differential. That gap is off the multicycle tights seen in July 2024 as noted in the timeline and are extraordinarily tight to the long-term median of +135 bps. Even the VIX volatility spread widening of early August saw peak differentials well inside the long-term median.
Yields and UST shifts quiet down for a week…

The steady setback in recent updates took a break this past week. The chart above shows the 1-week UST deltas. The overall trend line for duration has been negative after the rally of the 10Y UST to a 3.6% handle started to backpedal to over the 4.0% line after the banner payroll data and more constructive fundamental news in recent weeks (see Payroll Sept 2024: Rushing the Gate 10-4-24). As we detail below, we see the 7 bond ETFs with 6 positive and 1 very slightly negative this week.
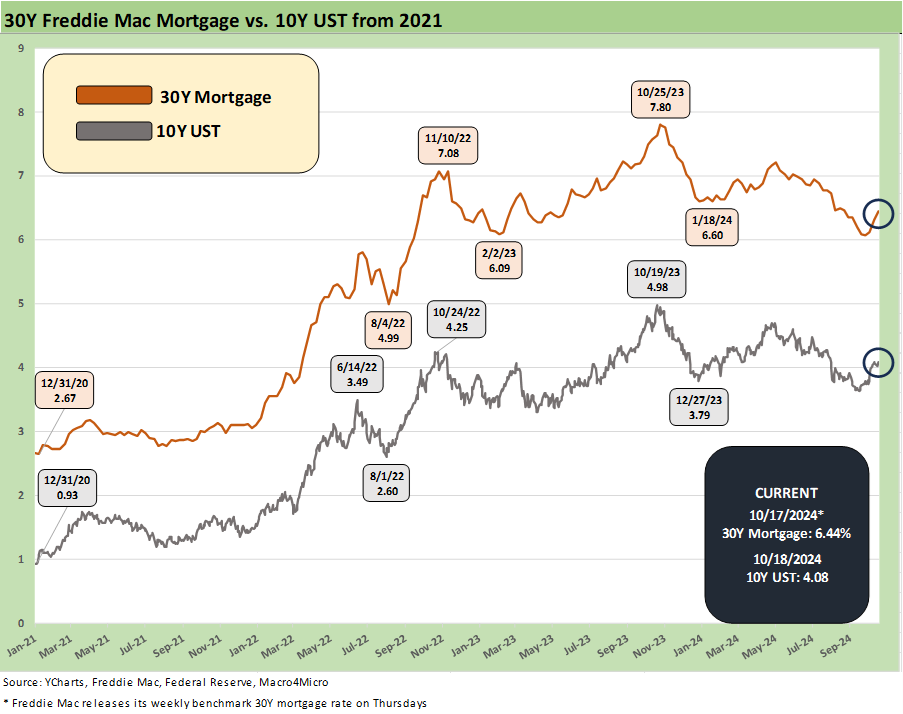
Mortgage rates reflect the recent setback along the UST curve and 10Y backup from the recent sub-3.7% lows to over 4.0%. Homebuilders have pushed right through the setbacks as we saw again this week (see Housing Starts Sept 2024: Long Game Meets Long Rates 10-18-24). We are still a long way from last year’s 7.6% at this time.
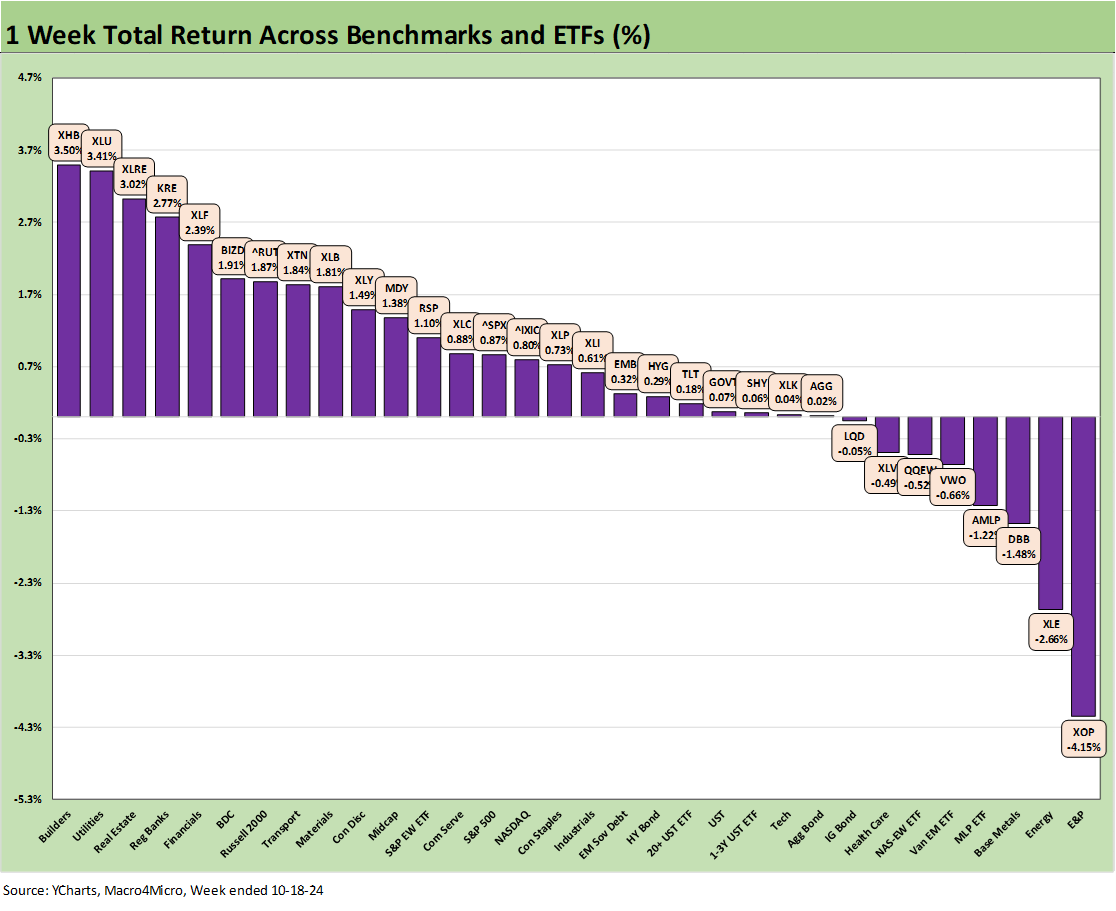
The weekly asset class returns as detailed above weighed in at a 24-8 score on positive vs. negative returns. The winners on the week had more of an interest-rate-sensitive flavor with the Homebuilder ETF (XHB) on top followed by Utilities (XLU) and Real Estate (XLRE).
The most notable events of the early earnings season were solid numbers from the megabanks and reassuring bank commentary on the corporate sector and consumer quality. The color on consumers so far has eased some of the fears around the likelihood of higher provisions and credit losses. We see that reflected in the top 5 with the Regional Bank ETF (KRE) and broad Financials ETF (XLF).
The best performing broad index was the small cap Russell 2000 (RUT) which was well ahead of the S&P 500 and NASDAQ. The small cap rally has been holding in longer and in more impressive fashion after the more rapid flameout seen in late 2023 following the rally in Nov 2023 that generated most of the small cap numbers for that year (see Footnotes & Flashbacks: Asset Returns 12-3-23).
On the bottom of the rankings, we see energy taking a relative beating as the market digested lower risks of Israel attacking Iranian energy infrastructure and the market started to get more skeptical on China demand. The bottom 5 include 3 energy ETFs across E&P (XOP), Energy (XLE), and Midstream (AMLP) plus the Base Metals ETF (DBB) and EM Equities (VWO).

The week for the tech bellwethers is broken out above. We line up the tech equity returns in descending order of total returns for the week. The week saw a mixed bag with Taiwan Semi reporting great numbers and reigniting some chip optimism. We highlight that the NASDAQ 100 Equal Weighted ETF (QQEW) was in the red for the week and in the bottom quartile of the weekly asset return group as noted earlier in the earlier return chart.
For the week, the Mag 7 stocks had 6 of 7 (ex-Meta) in the positive range. Only 3 of the Mag 7 beat the S&P 500 with AAPL, NVDA, and TSLA. For TSLA, that name is still negative for the YTD 2024, 1 year, and 3 year running returns.
Pricing post-election risk factors await the vote and the uncertain legal timelines…
There is going to be no hiding from the political X factors in coming weeks, and the handicapping process will be “more or less” over soon even if the election could end up at the Supreme Court again. State certification and Congressional follow-up could be a problem on partisan maneuvering. There is also the justified concern that an array of bearded, drooling, tattooed, AR-toting meatheads will be showing up at doors. The challenges to the faith in rational government and the continued ability of the US to operate like a Democracy in fact (vs. in branding) will be put to the test.
The checklists on policy views from the two candidates are pretty much on record at this point even if in limited shape around some topics such as taxes and Ukraine and others. Everyone seeks to play tough on China, which based on history is a risk in geopolitical and trade reality even if a domestic political imperative. The lack of a clear platform from the GOP on major economic sectors such as health care is a problem. As in 2020, the GOP platform is essentially “whatever Trump wants” if he is reelected. The desire to terminate the ACA is still taken as a given by most objective observers and denials are not credible.
For Harris, tax increases are the core of her policy with a headline (but very general) policy position on housing that has big ambitions but not enough infill on how the supply side of the equation can be tackled. Trump has no plan on housing other than freeing up space via mass deportation. That one from Trump appears to lack some cause-and-effect legwork on the connection to single family home supply (That is being polite). As stated in the past, expulsion and relocation for lebensraum (“living space”) did not end well in the 1930s.
If Trump loses, the potential for a fresh constitutional crisis is a guarantee and partisan claims will be “loud and proud” that there are legions of illegal voters hiding under everyone’s bed and in their closets (presumably with a supply of desiccated cat and dog sticks). The House and Senate will get their ultimate blind loyalty test or will find their escape pod in the event of a Trump loss.
If Trump wins, then the markets will have to get serious in thinking through how to factor in massive increases in tariffs. Trump spent the past week making tariffs almost a religious cornerstone of his political platform and a de facto social contract. Tariffs are now more than just an economic policy plan in formulation. The tariff policies do not depend on Congress while any Harris plan does. That is a major difference that does not get enough airtime. If Trump gets the free reign on tariffs, 2025 will be a very challenging year of decision-making for corporate sector planning in industries such as autos while retailers will be gasping for air on the potential impact.
See also:
Housing Starts Sept 2024: Long Game Meets Long Rates 10-18-24
Trump at Economic Club of Chicago: Thoughts on Autos 10-17-24
Retail Sales Sep 2024: Taking the Helm on PCE? 10-17-24
Industrial Production: Capacity Utilization Soft, Comparability Impaired 10-17-24
Footnotes & Flashback: Credit Markets 10-14-24
Footnotes & Flashbacks: State of Yields 10-13-24
Footnotes & Flashbacks: Asset Returns 10-12-24
CPI Sept 2024: Warm Blooded, Not Hot 10-10-24
HY OAS Lows Memory Lane: 2024, 2007, and 1997 10-8-24
Footnotes & Flashbacks: Credit Markets 10-7-24
Footnotes & Flashbacks: State of Yields 10-6-24
Footnotes & Flashbacks: Asset Returns 10-6-24
Mini Market Lookback: Cracking the 300 Line in HY 10-5-24
Payroll Sept 2024: Rushing the Gate 10-4-24