
Footnotes & Flashbacks: State of Yields 10-21-24
The UST curve had one of its quieter weeks with minimal movement but the stubborn 10Y continues to fight back against duration bulls.


For my next trick, I’ll cut rates in half, grow the economy, and reduce the deficit…
A dead-calm week for the UST curve brought very little shapeshifting as the post-UST rally setbacks that had recently morphed into a steepening left the bond market more about fundamentals and spread compression and less about inflation and the Fed.
The coming week brings an extraordinary range of earnings releases from cyclical and secular bellwethers across autos (GM, TSLA), freight/logistics (UPS, rails, trucking), and aerospace & defense (Boeing, Lockheed), metals/mining (Nucor, Rio Tinto), Semis (Texas Instruments), and many others as guidance color will be more helpful in gauging where we are heading than a lighter economic release calendar.
The focus on the election will intensify as the deep divisions of ideology and social priorities will eventually give way to a refocus on the inflation threat of tariffs and gauging what soaring deficits will mean for market clearing levels on UST.

The above chart updates the UST histories across the cycles since the 1978 Carter inversion. We include the UST curves from periods outside the ZIRP and normalization years. That means the period before the crisis and since the end of ZIRP.
The post-crisis curve selection includes the UST peak of 10-19-23 and the recent Friday close. What is evident with just a glance is that UST rates are extraordinarily low in multi-decade, multicycle context. Pushing a bull market view on the long end at a time of record deficits and record funding demands (and a record interest expense bill) is hard to reconcile when one Presidential candidate has promised to cut interest rates in half while growing the economy.

The above chart updates the running UST curve shift from the 10-19-23 peak and from the start of the year. We break out the deltas and also detail the UST rates in a separate box. After the YTD UST deltas were rising for much of 2024, we saw the market go into bull mode for some weeks. Then we saw the recent backup in long rates even as the Fed eased into what is now a YTD steepening from 5Y to 30Y.
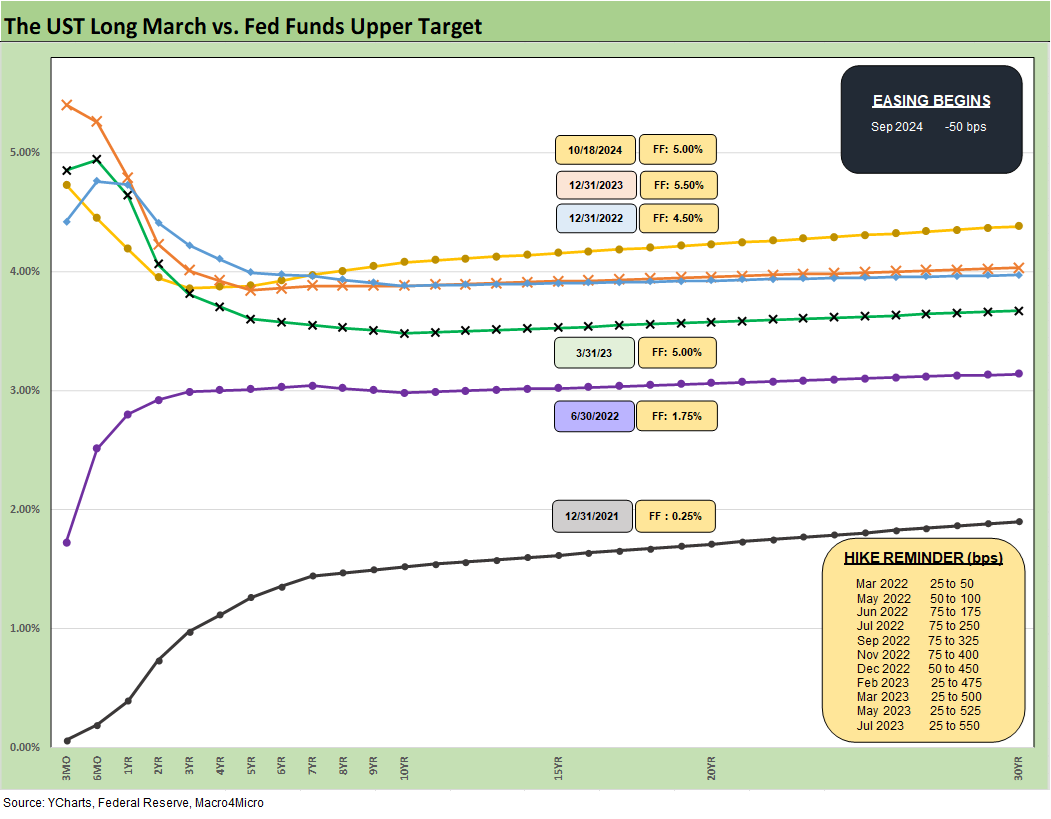
The above chart shows some useful visuals on the YTD migration across the tightening cycle. The fact that the 10Y UST converged for the 12-31-22 and 12-31-23 UST curves despite the 100 bps differential in fed funds offers an empirical reminder that the FOMC and 10Y UST do not have to move together. It is a simple point from recent tightening dynamics, and the question is whether that will change with easing. As we have seen since the payroll data, the 10Y UST already has not been cooperating by moving back up to the 4.0% area.

The above chart updates an uneventful UST delta week for the curve. We looked at some of the UST curve issues and bond ETF performance already in Footnotes & Flashbacks: Asset Returns 10-20-24 and Mini Market Lookback: Banks Deliver, Equities Feel the Joy 10-19-24 . There are a lot more moving parts ahead even before more thought is given to the inflation effects of tariffs and mass deportations and questions around global currency trends and what that will all mean for the dollar and offshore UST demand.

The above chart offers another visual angle on the UST delta for the YTD period. We see the steepening with the front end declining and migrating higher from the 5Y out to 30Y.

The above chart updates the UST deltas from the 10-19-23 peak date on the UST 10Y. The Nov-Dec 2023 period was especially impressive with a major win for duration, a stock rally, and impressive credit spread contraction (see Footnotes & Flashbacks: Asset Returns 1-1-24, Footnotes & Flashbacks: State of Yields 1-1-24). The 2024 period has been more mixed on duration in fits and starts while credit spreads contraction has picked up in recent weeks.
We break out the YTD performance for the broader array of asset classes and benchmarks and ETFs separately (see Footnotes & Flashbacks: Asset Returns 10-20-24). The 2024 period and especially the LTM period has been very successful for equity allocations.
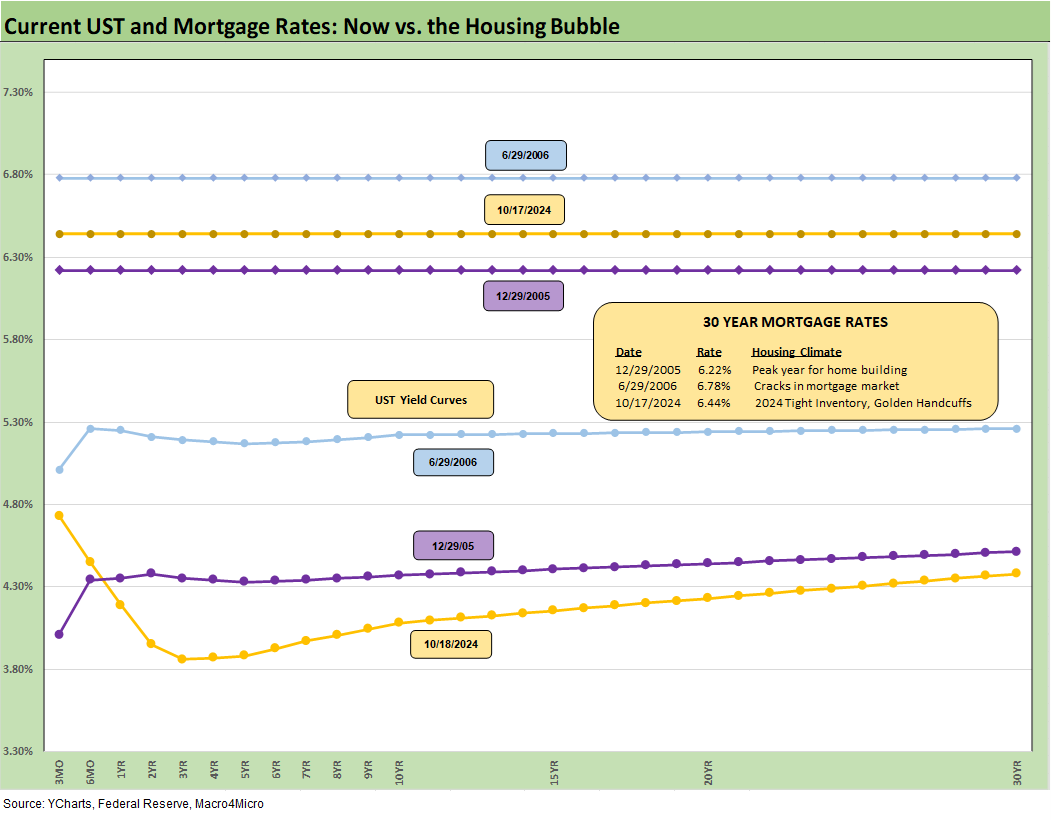
The above chart updates the Freddie Mac 30Y mortgage benchmark on the horizontal lines. We include some useful historical comparisons from the housing boom and bubble period including the end of 2005, which was the peak homebuilding year, and mid-2006, which was a period when the markets were starting to feel RMBS quality anxiety.
We also include the UST curves for each date. The current UST curve with its front-end inversion still leaps out as an anomaly. We have often looked at the ability of the homebuilders to work around the mortgage constraints (see Housing Starts Sept 2024: Long Game Meets Long Rates 10-18-24, New Home Sales Aug 2024: Waiting Game on Mortgages or Supply? 9-25-24). We do not see that changing as we move into the home stretch of 4Q24 and builders plan their 2025 community strategies.

The above chart updates the UST slope from 3M to 10Y from 1984. We include the range of UST slopes we like to monitor in the box within the chart including the current slopes and long-term medians. For the 3M to 10Y, we are still looking at -65 bps vs. the post-1984 median of +160 bps. That leaves a lot of room to maneuver.

The above chart just shortens up the timeline of the slope history from the start of 2021 for a better closeup on the pattern of the moves across the tightening cycle. We see the peak slope of May 2022 at +227 bps on the path to a peak inversion of -189 bps in May and June of 2023.
The road back to the current level of -65 bps is still dramatically inside the +160 bps median. The inversion had narrowed to -62 bps when the 10Y peaked on 10-19-23, and the Nov-Dec actions by the FOMC from here will decide where the 3M UST migrates. The 10Y UST is up to the market. The growth forecasts for 4Q24 are not getting dialed back much from what we can see.

The above chart wraps this update with the UST deltas since the start of March 2022 when ZIRP came to an end (effective March 17). We include the 12-31-20 and 10-19-23 peak of the UST as frames of reference.
That front profile is a very challenging inversion to unwind from the long end at this point, but underscores the room on the short end to manage rates lower by the Fed. Getting the 10Y to 30Y to follow fed funds will take less inflation, bad cyclical news, and a belief in the market that the demand will be setting new records every quarter and every year to match the continued record supply.
See also:
Footnotes & Flashbacks: Asset Returns 10-20-24
Mini Market Lookback: Banks Deliver, Equities Feel the Joy 10-19-24
Housing Starts Sept 2024: Long Game Meets Long Rates 10-18-24
Trump at Economic Club of Chicago: Thoughts on Autos 10-17-24
Retail Sales Sep 2024: Taking the Helm on PCE? 10-17-24
Industrial Production: Capacity Utilization Soft, Comparability Impaired 10-17-24
Footnotes & Flashback: Credit Markets 10-14-24
Footnotes & Flashbacks: State of Yields 10-13-24
Footnotes & Flashbacks: Asset Returns 10-12-24
CPI Sept 2024: Warm Blooded, Not Hot 10-10-24
HY OAS Lows Memory Lane: 2024, 2007, and 1997 10-8-24
Footnotes & Flashbacks: Credit Markets 10-7-24
Footnotes & Flashbacks: State of Yields 10-6-24
Footnotes & Flashbacks: Asset Returns 10-6-24
Mini Market Lookback: Cracking the 300 Line in HY 10-5-24
Payroll Sept 2024: Rushing the Gate 10-4-24