
Homebuilders: Updating Equity Performance and Size Rankings
We look at recent builder equity performance ahead of the CPI rally and line up the builders by height across ASPs, Sales, and Market Cap.


We track the recent homebuilder equity setbacks that are quickly getting reversed today by the CPI-driven surge of optimism on what lies ahead for the UST curve (see CPI June 2024: Good News is Good News 7-11-24 ). Before the bullish tone erases the recent weakness in the builders, we thought it worth getting out in print and then getting into the new waiting game.
In a market where home prices are materially higher from the pre-COVID period and mortgage rate monthly payments remain an onerous burden, we line up the builder peer ASPs (average selling prices) from Toll at $1.0 million down LGI Homes at $361K (right behind industry giant D.R. Horton).
We line up the homebuilder revenue rankings using the most recent quarter “home sale revenues” (i.e. ex-land and other business lines) for some flavor of the relative size as D.R. Horton and Lennar are in a distinct class in industry scale.
We then wrap with a snapshot of market caps with the qualifier that those numbers were just lit up with the CPI buzz and will get a nice bounce on average in the 6% to 7% area today even if the relative relationship across the names do not change much.
As far as the 30Y mortgage carryover effect goes from one CPI number, the assumption that the 10Y UST will keep following theoretical FOMC cuts may prove too optimistic with such a steep inversion.
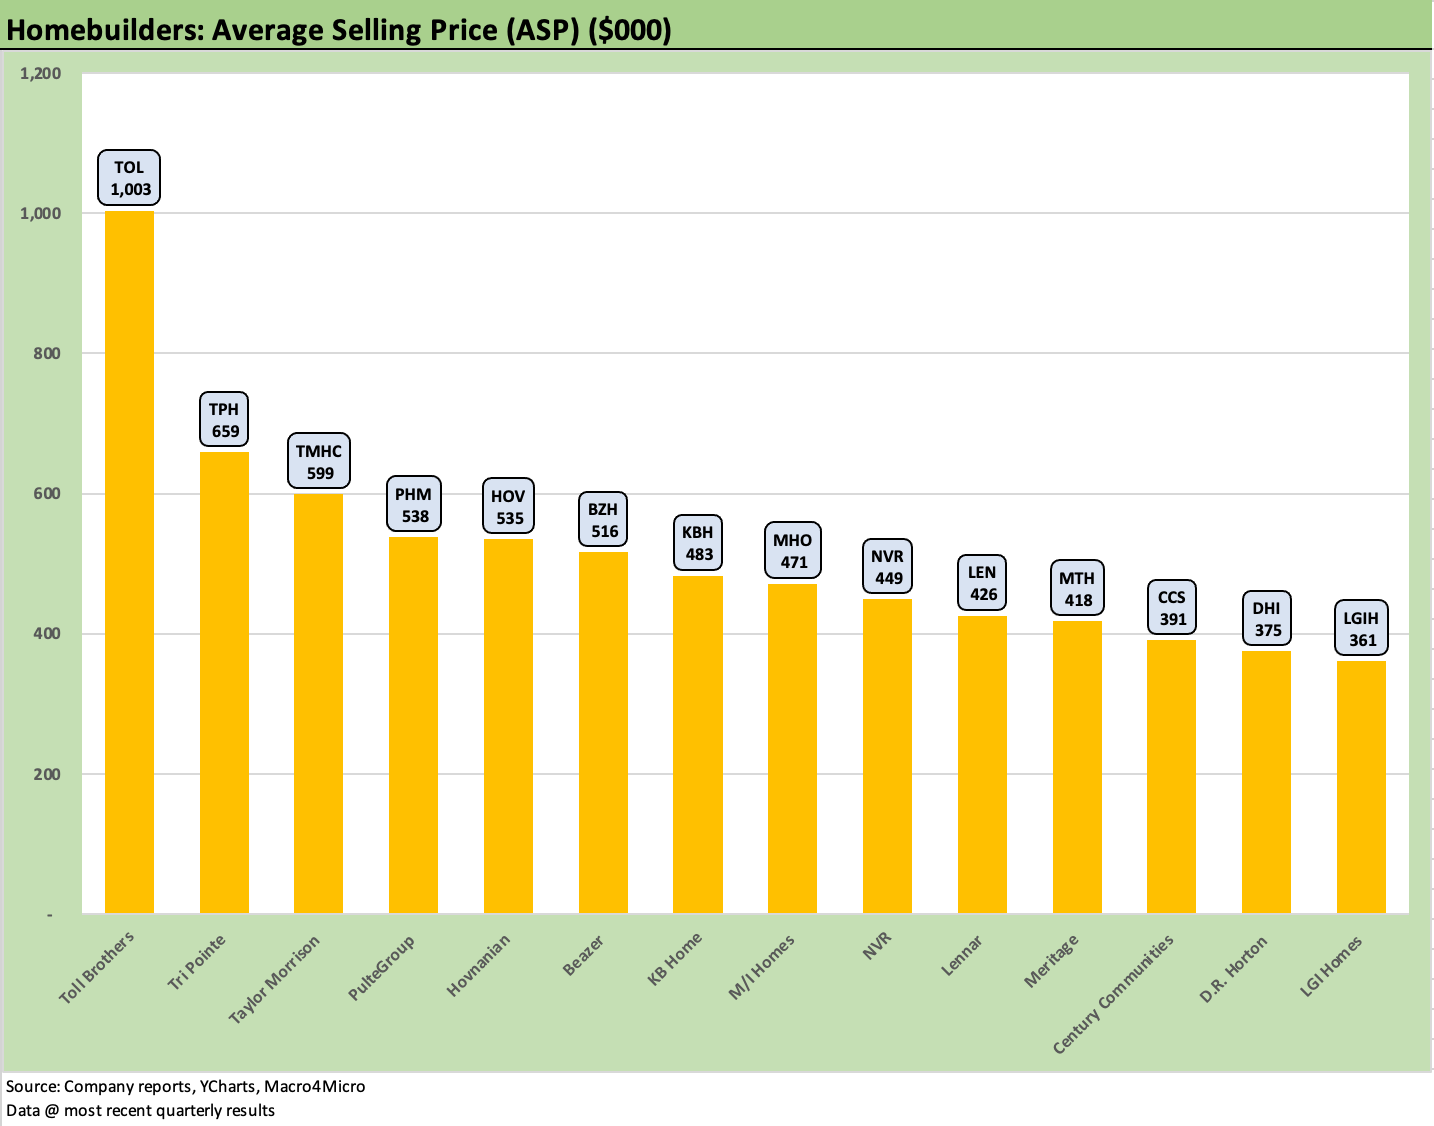
The above chart just seeks to highlight the very wide range of price tiers across the major builders and the variety of product tiers and regional mix variances where builders large and small (public and private) can focus. Toll Brothers is in a class by itself based on its role as the premier luxury home leader (see Toll Brothers: A Rising Tide Lifts Big Boats 5-23-24). On the low ASP end of the list, we see some very impressive operators in the ranks such as D.R. Horton with its expansive national footprint.
High ASPs for major builders typically involve a high presence in California, which is what we see with Tri Pointe (TPH) and Taylor Morrison Homes (ticker TMHC, see Credit Crib Note: Taylor Morrison 5-20-24). The ASPs are a function of product tiers (from entry level to luxury with first and second move-up between), geographic mix, and community planning by metro area. Whether a builder focuses on first time buyers is a major pricing tier issue even though there are some very well-heeled “first time buyers.” Some homebuilders have very distinctive brand power and core strengths in certain segments such as luxury at Toll or active adult at Pulte with its national footprint and product tier diversity (see PulteGroup: Strong Volumes, Stable Pricing 4-25-24). It runs the gamut.
Perhaps the most interesting ranking and data point is that DHI is #13 in ASPs among the major builders. DHI is one of the “Big 2” builders and has been a juggernaut in its core business since the housing bubble crisis. DHI has posted steady growth even without major M&A while Lennar was a big acquirer along the way. One thing that is clear in the ASP rankings is that higher ASPs do not translate into financial strength as evident in a comparison of a builder such as D.R. Horton vs. names such as Hovnanian and Beazer. We see 5 of the Top 7 in the speculative grade realm with only Toll and Pulte in the IG tier.

The above chart frames the home sales revenue for the “Most Recent Quarter” (MRQ) run rate for the home sales line (ex-land and other). The number represents an easy shorthand chart to frame the relative ranking of homebuilding revenues narrowly. “Home sales” is one of several line items for some of the bigger players in the space such as D.R. Horton with its multiple business lines (see D.R. Horton: Ramping Up in 2024 Despite Mortgages 4-19-24).
For a name such as DHI, the MRQ home sales line excludes their financial services business, the consolidated revenue of Forestar, and the single family rental and multifamily operations. We wanted something of an apples-to-apples format from a recent period that reflects the rebound in orders for numerous builders.
The drop-off in revenues from #1 DHI and #2 Lennar (LEN) is material on the way to #3 PulteGroup (PHM). DHI leads in a number of the Top 5 markets and is the king of Texas (see D.R. Horton: Credit Profile). DHI has regularly flagged that it is #1 in 15 of the Top 50 markets and #1 in 4 of the Top 5 markets. LEN rules the roost in Southern Florida but through M&A in the post-crisis years has acquired a very strong presence in the West while also expanding its position in the East and Florida.
A favorable aspect of the range of fiscal years seen in the homebuilding sector (FY dates 9/30. 10/31, 11/30, and 12/31) is that you get regular updates from the management teams in the trenches on current conditions. Calendar year reporting is still the most common, but the #1 builder (DHI) is a Sept FY reporter and #2 (Lennar) is a Nov FY reporter (see Lennar: Key Metrics Still Tell a Positive Macro Story 6-20-24).

The above chart updates the running time horizon equity returns for the 14 major public builders and the Homebuilding ETF (XHB) through last night’s close (7-10-24) ahead of today’s big rally after CPI. We include the S&P 500 and the Equal Weight S&P 500 ETF (RSP). We dropped M.D.C. holdings from the list after its acquisition by Sekisui House in April. We typically line companies up in descending order of 1-year for the updates, but we line them up here on a YTD basis in this exercise.
We thought we should get this together before the latest wave of rallies kicked into gear today after the favorable CPI numbers. We will update the stock chart separately tomorrow after the returns all flow in for today’s close. We thought this was a good look at how the market sentiment was recently shifting. It will be worth keeping in mind if mortgage rates on the long end (or the Fed on the short end) do not fully cooperate.
As we go to print, we see builders bouncing back in style with major names running from +6% to 12% with KBH at +10.3%, Meritage at +9.5%, M/I at +8.5%, Century Community at +8.2%, and Tri Pointe at +7.9% as samplers. The biggest moves were in some beaten down names such as LGI Homes (LGIH) at +11.5% and on the existing home broker side we see Anywhere Real Estate (HOUS) at +17.6%.
As recently as late May, the LTM numbers for this group of builders posted total returns ahead of the S&P 500 for 13 out of 14 and all were positive. Only the small growth story of LGI Homes (LGIH), where that growth has faded, was below the broad market in late May LTM returns. Looking at the YTD numbers above, we see 6 single name builders with positive YTD returns while the XHB makes it 7. We see 8 single names in negative range. Looking back over 3 years as a starting point well before the tightening cycle is a good relative comparison for the builders, who have overwhelmingly beaten the benchmark.
As evident in the chart’s 1-month horizon, the recent weeks have shown a negative return bias on mortgage rate worries and valuation. For the 1-month period, only NVR managed to stay positive. That will change with today’s close but is worth keeping in mind as the UST curve shapeshifting gets debated. For now, the price action today will wipe out most of the 1-month negative returns.
As we cover in our weekly Footnotes publication on Asset Returns (see Footnotes & Flashbacks: Asset Returns 7-7-24), the builders had been materially outperforming the market benchmarks for quite a stretch with the homebuilder ETF (XHB) frequently ranking #1 in total returns in our group of 31 benchmarks and ETFs (that universe rose to 32 in 2024).
For 2023, XHB was #1 in total return ahead of the Tech ETF (XLK) and a range of Magnificent 7 heavy benchmarks and ETFs. The XHB remained well out in front for 1Q24 LTM return ranking again ahead of the Communications Services ETF (XLC) at #2, the Tech ETF (XLK) at #3, and NASDAQ at #4. As of the end of 2Q24, the homebuilders slipped in the LTM rankings to #5 behind some tech benchmarks.
XHB fell to last place for the rolling 3 months period to end June 2024 as the spring selling season and macro indicators have been showing signs of slowing with the expectation of lower mortgages not materializing on a sustained bases (yet) as expected earlier in the year. We expect the magic number will need to be below 6% to really ignite more action in existing home sales and ease the incentive pressures on builders. The XHB was the last place performer for the trailing 1-week and 1-month time horizons among our 32 benchmarks and ETFs.
After such a dazzling performance, the builder equities were becoming a profit taking drill, and it takes a lot of faith in an FOMC cut or two driving the long end lower

The above chart updates the market value of equity for the 14 builders with DHI and LEN comprising a major slice of the industry total. We use a late afternoon, pre-close pricing. The combined market cap of DHI and LEN totaled over $90 billion or almost the size of the next 12 combined. DHI’s market cap is 2x that of #4 Pulte. PHM has been in a battle for #3 in market cap with NVR, who is materially smaller in revenues than PHM and ranks #5 in the earlier revenue rankings (see Credit Crib Note: NVR, Inc. 5-28-24). The Top 5 (including NVR, Pulte, and Toll) are over 80% of the market cap total for these 14 public builders.
See also:
Credit Crib Note: KB Home 7-9-24
Footnotes & Flashbacks: Asset Returns 7-7-24
Footnotes & Flashbacks: State of Yields 7-7-24
New Home Sales: Pumping the Brakes 6-26-24
Existing Home Sales May 2024: Weary Climb 6-21-24
Housing Starts May 2024: Starts vs. Deliveries Balancing Act 6-20-24
Lennar: Key Metrics Still Tell a Positive Macro Story 6-20-24
Credit Crib Note: NVR, Inc. 5-28-24
New Home Sales April 2024: Spring Not Springing Enough 5-23-24
Toll Brothers: A Rising Tide Lifts Big Boats 5-23-24
Credit Crib Note: Taylor Morrison 5-20-24