
Footnotes & Flashbacks: Asset Returns 10-20-24
Israel and China handicapping were key drivers this week while the UST curve stayed very quiet and a few more all-time equity highs were notched.


The timeline is really going to heat up from here…
Equity benchmarks have kept the headlines filled while the bond asset class had to settle for the relative absence of bad duration news with overall credit spreads continuing to compress to multicycle lows.
The scoresheet in equities remains decidedly favorable with some exceptions as commodity-based subsectors are wagged by mixed sentiment on China stimulus policy and handicapping Israel’s Iran retaliation in target selection and severity.
The market continues to set aside the increasingly strident Trump views on tariffs which have shifted from economic policy to a personalized and almost religious zeal for tariffs that are broad and deep and awaiting clarity on any “specific asks” from trade partners.
The important distinction is that Trump can operate unchecked by Congress on tariffs (as he showed in his one term) while any major Harris programs are Congress dependent.

The above chart updates the rolling time horizon returns for the major debt and equity classes we monitor. The trailing 1-month returns tell the bond story with 3 out of 4 posting negative returns on the backup in the curve. That comes despite multicycle lows in spreads that allowed HY and IG spreads to get down in the neighborhood of multicycle lows (see HY OAS Lows Memory Lane: 2024, 2007, and 1997 10-8-24). The HY bond benchmark managed to achieve a slightly positive return and offset the curve impact.
For equities, the steady flow of all-time highs on the S&P 500 (see Mini Market Lookback: Banks Deliver, Equities Feel the Joy 10-19-24) have been running alongside a more consistent and healthy performance by the Russell 2000 small caps that is reassuring on the breadth of the rally. The mix of strong performers by industry groups as we detail further below in the ETF review offers a reminder that this is not just a tech-dominated story of the sort seen in earlier periods.

The above chart updates the 1500 and 3000 series, and the solid and steady equity performance shows a healthy balance across Financials and Industrials with Growth also in the narrow 1-month band and Value modestly behind. Real Estate has felt the negative effects of the UST move in valuation this past month but is still showing very solid performance for 3 months and 6 months.
Energy has been a laggard for 3 and 6 months and is still sitting on the bottom for the trailing 1-year period as oil prices have underwhelmed despite the Russian challenges and Iran tensions with a material swing in the supply-demand balance one Saudi decision away. WTI is back under the $70 line to end the week after hitting $77 almost 2 weeks back.
The rolling return visual
In the next section, we get into the details of the 32 ETFs and benchmarks for a mix of the trailing periods. Below we offer a condensed 4-chart view for an easy visual on how the mix of positive vs. negative returns shape up. This is a useful exercise we do each week looking for signals across industry groups and asset classes. We also have a YTD version that we include in the broader commentary on the time horizons further below.

The above chart updates the running returns of the Tech bellwethers defined as the “Mag 7 + Taiwan Semi + Broadcom” with comps set against the S&P 500, NASDAQ, the Equal Weight S&P 500 ETF (RSP) and Equal Weight NASDAQ 100 ETF (QQEW). We looked at these numbers earlier in Mini Market Lookback: Banks Deliver, Equities Feel the Joy, and the key development of the week was strong numbers from Taiwan Semi that reignited some excitement in the semi space even if the Mag 7 had only 3 names ahead of the S&P 500.

The above chart was also already addressed in Mini Market Lookback: Banks Deliver, Equities Feel the Joy, and the energy setbacks and question marks around the China rebound are evident on the bottom 4 of the list on the right with E&P (XOP), Energy (XLE), Base Metals (DBB), and Midstream (AMLP) on the bottom. The Israeli retaliation is now being handicapped as “not nuclear” and “not oil infrastructure” and that also has narrowed the inevitably unpredictable escalation risks.
As discussed earlier, the absence of more bad news on the UST curve seems to have helped the interest rate sensitive names while Financials 3Q24 numbers have supported Regional Banks (KRE) and Financials (XLF). We have seen the BDC ETF (BIZD) lagging for 3 months and YTD, but we see a relative rally this week on the heels of bank earnings and strong signals on credit from HY and small caps in framing how the private credit side might be playing out.

The 1-month returns weigh in at 23-9 with 6 of the 7 bond ETFs in the negative range. Bonds are in the bottom 4 with long duration UST 20+ Year ETF (TLT) in dead last with the duration pain also seen in IG Corp (LQD), GOVT, and AGG. EM Sovereign (EMB) was a little less negative with short duration UST 1Y to 3Y ETF (SHY) next on the negative list. The HY ETF was barely able to break into the positive zone with spread tightening of -33 bps in a sign of how the UST move hurt total returns.
On the positive side of the return mix, the stimulus headlines help drive EM Equities ETF (VWO) well into the #1 slot followed in the top quartile by a diverse mix of industries across Tech (XLK), Transport (XTN), Industrials (XLI), Financials (XLF), NASDAQ (IXIC), Utilities (XLU), and Materials (XLB).
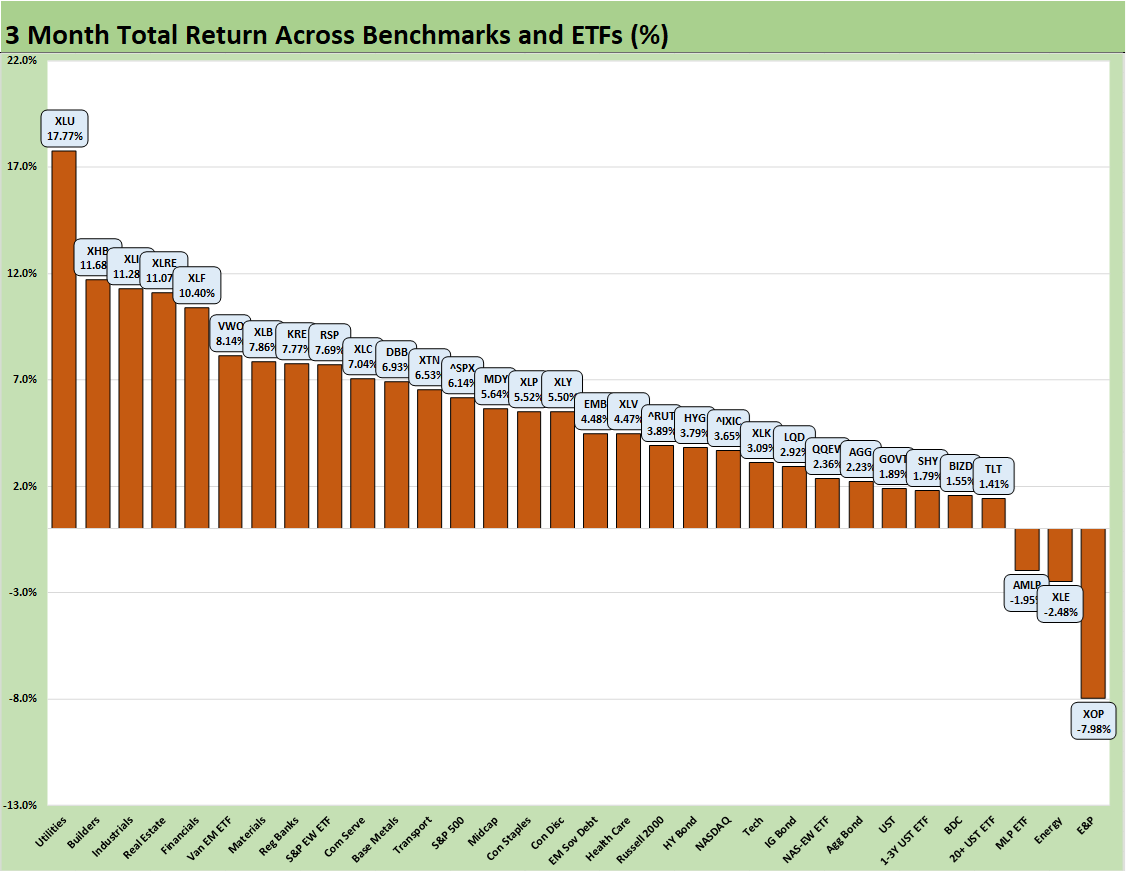
The 3-month score is 29-3 with only 3 energy-based ETFs in the red across E&P (XOP), Energy (XLE), and Midstream (AMLP). All the bond ETFs are positive but with 4 of the 7 bond ETFs still in the bottom quartile. We see the more credit intensive bond ETFs for IG (LQD), HY (HYG), and EM Sovereign (EMB) in the third quartile. The BDC ETF (BIZD) is sitting just above TLT in the bottom quartile.
The interesting twist on the top quartile is that it includes no broad benchmarks and no tech. We see that as positive in the context of cyclical diversity and the breadth of the rally. The Equal Weight S&P 500 ETF (RSP) outperformed other broader indicators with the S&P 500 and Midcaps only a few notches lower. The Russell 2000 is ahead of NASDAQ in the third quartile.

The YTD numbers flag an impressive year for equities with the median asset line around 14% and a score of 31-1 with only the long duration UST ETF (TLT) in negative range at -2.2%. We see 6 of the 7 bond ETFs in the bottom quartile with the last one (HYG) just across the line at the bottom of the third quartile.
The top 3 of Utilities (XLU), Homebuilders (XHB), and Financials (XLF) has been part of a recurring theme across numerous time horizons. For the winners, you need to get to #4 before finding a tech-centric ETF with the Communications Services ETF (XLC) but then the Mag 7 influence is clear at #5 (S&P 500), #6 (NASDAQ), and #8 with the Tech ETF (XLK).

The 1 year includes the duration and risk home run of Nov-Dec 2023 with only E&P in the negative zone at -9.6% for a score of 31-1. We see 6 of the 7 bond ETFs in negative range despite double digit returns on 5 of the 7 with GOVT just missing at +9.6% and the short duration UST ETF (SHY) at +6.3%. The EM Sovereign bond ETF hit the top numbers of the bond ETFs at +20.9% and only made the third quartile.
Among the winners, the Homebuilders (XHB) have been one of the “stories of stories” at over +73%, far ahead of the #2 Regional Banks (KRE) and #3 Financials (XLF), #4 Utilities (XLU), and #5 Industrials. The Homebuilder ETF return was essentially 2x the S&P 500 over the LTM period despite high mortgage rates that were coming down YoY but still stubborn.
A top 5 group for the LTM period with no tech in the mix is impressive although the next tier has plenty of tech and tech-wagged benchmarks such as #6 through #9 with NASDAQ, Tech (XLK), S&P 500, and Communication Services (XLC).
The LTM returns across the 32 benchmarks and ETFs show a median of almost 26% for a very impressive stretch that included a cyclical high in the 10Y UST one year ago on 10-19-23.
See also:
Mini Market Lookback: Banks Deliver, Equities Feel the Joy 10-19-24
Housing Starts Sept 2024: Long Game Meets Long Rates 10-18-24
Trump at Economic Club of Chicago: Thoughts on Autos 10-17-24
Retail Sales Sep 2024: Taking the Helm on PCE? 10-17-24
Industrial Production: Capacity Utilization Soft, Comparability Impaired 10-17-24
Footnotes & Flashback: Credit Markets 10-14-24
Footnotes & Flashbacks: State of Yields 10-13-24
Footnotes & Flashbacks: Asset Returns 10-12-24
CPI Sept 2024: Warm Blooded, Not Hot 10-10-24
HY OAS Lows Memory Lane: 2024, 2007, and 1997 10-8-24
Footnotes & Flashbacks: Credit Markets 10-7-24
Footnotes & Flashbacks: State of Yields 10-6-24
Footnotes & Flashbacks: Asset Returns 10-6-24
Mini Market Lookback: Cracking the 300 Line in HY 10-5-24
Payroll Sept 2024: Rushing the Gate 10-4-24