
Market Commentary: Asset Returns 3-8-26
Asset returns saw a wild week with oil soaring and parts of OPEC shutting down. It will get wilder this week.


Trump: “I got this. I saw Argo twice.”
The week was a wild one even if that phrase is getting old after the tech equity volatility gave way to a war with Iran that has shut down the Strait of Hormuz and turned the Gulf into a shooting gallery of drones, missiles, bombing runs, and potentially speedboat suicide missions.
The S&P 500 saw a near shutout for the week with 10 of the 11 sectors in the negative zone and only energy putting up positive numbers. From Friday (2-27) to Friday (3-6-26), the market saw WTI oil was up by just under an incremental $28 ($67.02 to $90.90 per oilprice.com). Oil futures showed a record % increase for a single week. As we go to print tonight, oil soared again but this time above $100 to around $113 by late evening. That is around a $46 per bbl increase since Friday (2-27-26).
Retail gasoline jumped by almost 16% on the week to $3.45 by 3-8-28 (from $2.98). Retail gasoline will light up tomorrow. We will get CPI and PCE inflation this week, and there will not be excessive focus on those headline numbers with so much turmoil dead ahead. That said, the “other” consumer hot button in the CPI lines still matter – a lot. The health care insurance line was showing deflation last month. That tells a story of too much model theory and not enough reality over at the BLS.
The complexity of the problem Trump faces now goes beyond a massive spike in oil. The pain gets into more damage being done to infrastructure and attacks across the Gulf that are now leading to a shutdown of some major operations of the #1 LNG supplier (Qatar) and moves to shut in oil production by Kuwait with a storage crisis on its hands. On a side note, this would be a bad time to start a trade war with Canada, the largest oil supplier to the US. On another side note, there’s a mini war stirring around attacking desalination facilities…water wars have begun. That could get ugly (see Black Man Spy - Malcolm Nance | Substack).
The markets face more explosive risks to sort out ahead given Trump’s demands for “unconditional surrender” by Iran and Trump’s demands to choose the next Iranian leadership team. That set of conditions dooms this outcome to protracted conflict and boots on the ground. This is not Venezuela. Trump got his answer tonight on the new Supreme leader of Iran. He was not wearing a red hat.
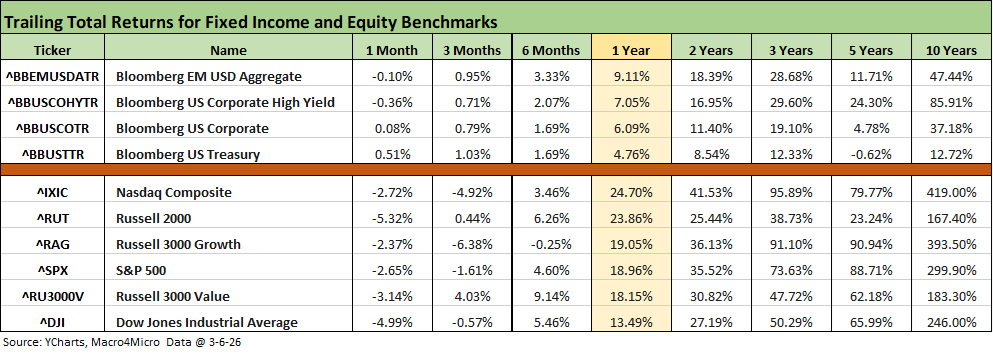
The above table updates our broad benchmarks for debt and equity and the 1-month timeline brings very little good news with equities all in the red and a split of low positive and negative returns in bonds. HY had a mild widening on the week but with a +13 bps move on Friday feeding a +27 bps move for the month. At +313 bps for the HY Index OAS, that is still dramatically inside a long-term median of around +454 bps. Bonds are feeling the adverse move on the UST curve with the 10Y UST going the wrong way and the FOMC handicapping getting reassessed on the inflation threat from energy.
The rolling return visual
In the next section, we get into the details of the 32 ETFs and benchmarks for a mix of trailing periods. Below we offer a condensed 4-chart view for an easy visual on how the mix of positive vs. negative returns shape up. We see it as a useful exercise in looking for signals across industry groups and asset classes.
We also recently added a “Tech Check” chart with 28 asset lines from benchmarks to ETFs to single name stocks.

The above chart collection hammers home the rough ride over the past week and 1-month with the 3-month running returns holding in well based on the performance before the tech chaos and now the Iran turmoil. The bull market that drove the impressive 1-year score of 31-1 positive is a good memory but 2026 is now facing some major tests now and even more dead ahead.
The Magnificent 7 heavy ETFs…
Some of the benchmarks and industry ETFs we include have issuer concentration elements that leave them wagged by a few names. When looking across some of the bellwether industry and subsector ETFs in the rankings, it is good to keep in mind which narrow ETFs (vs. broad market benchmarks) get wagged more by the “Magnificent 7” including Consumer Discretionary (XLY) with Amazon and Tesla, Tech (XLK) with Microsoft, Apple, and NVIDIA, and Communications Services (XLC) with Alphabet and Meta.
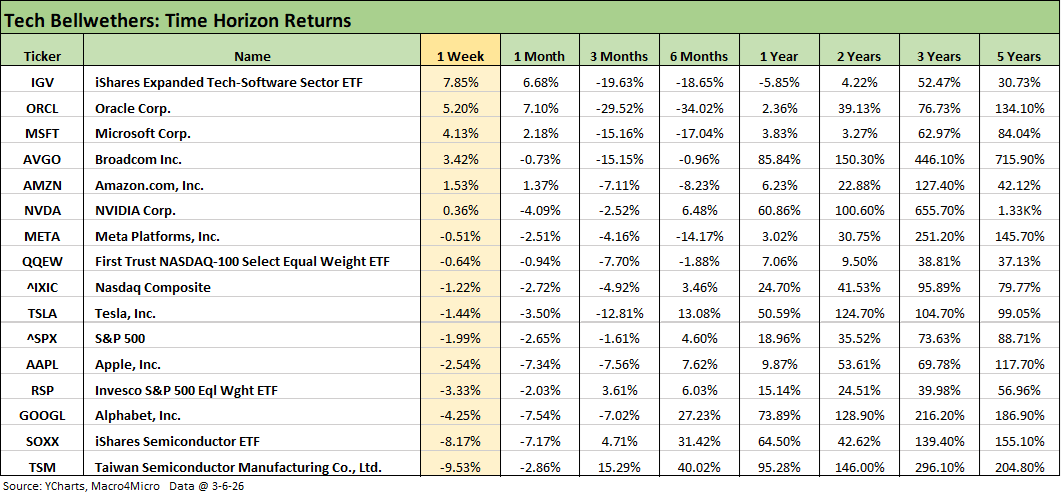
The above table details the returns across the tech bellwethers and a collection of benchmarks and tech-centric ETFs. We see Nasdaq and the S&P 500 in the red for the 1-week, 1-month, and 3-month time horizons, so that ranks as unimpressive. We see 3 of the Mag 7 positive for the week and 5 of the Mag 7+3 (with ORCL and AVGO) positive for the week.
We see a strong comeback by the Software ETF (IGV) for the week, but IGV is deeply in the red for 3 months, 6 months and modestly negative for 1 year. The Semiconductor ETF (SOXX) was hit hard this week at -8.2% and negative for 1-month. The overwhelming mix of asset lines are negative for 3 months with TSM a positive outlier at +15.3% for the rolling quarter.
The commentary below is essentially a cut and paste from our LinkedIn post from Saturday where a routinely post weekly returns.
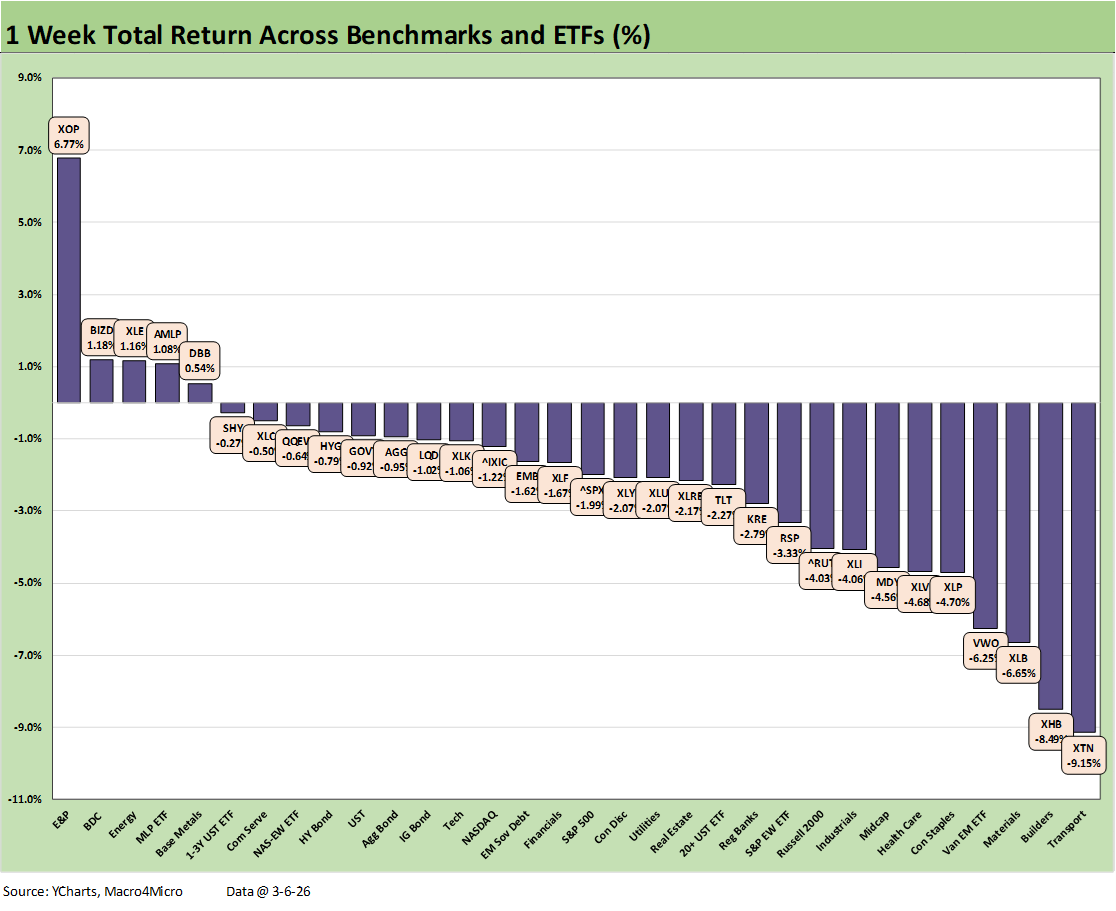
There was zero mystery to asset returns this week other than “How bad?” The ugly jobs number on Friday was almost an afterthought, but that trend will be a critical variable later in the election year.
Returns across our 32 benchmarks/ETFs posted a 5-27 score with 3 of the 5 positive in energy (XOP, XLE, AMLP) plus Base Metals (DBB) while BIZD saw some relief. All bond ETFs were negative while airlines (in the XTN) and Homebuilders (XHB) were slammed.
The escalation, misinformation, disinformation, speculation, and recurring adjudication (IEEPA refunds and legal challenges to new tariffs) require skepticism to temper the White House jawboning to bolster confidence. When we hear “unconditional surrender” and what amounts to “I pick the new leader” we know we are in a zone of extreme behavioral unpredictability.
One of the talking media heads cited Truman on the topic of unconditional surrender (Note: Casablanca Conference in 1943 was FDR). If you asked Trump about Casablanca, he might reply “Ingrid was hot. A little old for me though”. Unconditional surrender demands can have the opposite effect of bringing wars to an end quickly. It also implies “boots on the ground.”
Trump’s escalation running alongside his promises to open the Strait of Hormuz with naval support and tanker/cargo insurance fell flat. Peeling back even a single layer undermines it, especially with his insurance promise (it would need a US guarantee to be viable in this situation, require legislation, or at least be a better capitalized entity).
We have been listening to an impressive expert on the Middle East military, logistical and intelligence issues on Substack that we recommend. He lived and breathed the issues in the military and intelligence world since Desert Storm. The granular details are worth the time. The mainstream media is useless at this point on this topic. Malcolm Nance is also entertaining (see Black Man Spy - Malcolm Nance | Substack).
Qatar is leading the charge on delivering facts, and we see a major OPEC player and global leader in LNG and fertilizer as more reliable to gauge the sea level realities. Qatar has emphasized time lags in restarting LNG operations. It is not news that LNG has been critical in the economies of Europe and Asia. The presence of low-cost power in Qatar has attracted a wave of data center building in the area, which means reverberating secondary and tertiary multiplier effects. That is a topic for another day.
Kuwait spoke of shutting in production given the lack of adequate storage. US oil markets remember the storage crisis of COVID when there was no place to store oil. That led to a negative oil price in the futures market of around -$37 per bbl (Cushing was filled or spoken for and flashing “no vacancies”). In the Kuwait case (and others), they face trapped supply and that worsening imbalance is flowing into global oil prices.
The commentary below is essentially a cut and paste from out LinkedIn post from Saturday:
The Iran fallout has flowed into mixed effects on the recent tech equity trends as investors sort out the energy stress (e.g. crucial power cost issues, construction lags, etc.), inflation risks, UST curve shapeshifting potential, and how the global supplier chain might see some turbulence (note the South Korean market’s “worst day ever”). A steeper UST curve and lag on FOMC easing would weigh on valuations (that “long duration equities” label that we hate).
The simple question of whether capex forecasts will be tempered or even materially reduced by cyclical worries is at least worth reassessing. That is especially the case if macro stress curbs consumer appetites. The negative payroll numbers did not help. Markets also need to ponder the relative aggression of IT budgets and potential speculation on how much AI will bring in the form of productivity improvements.
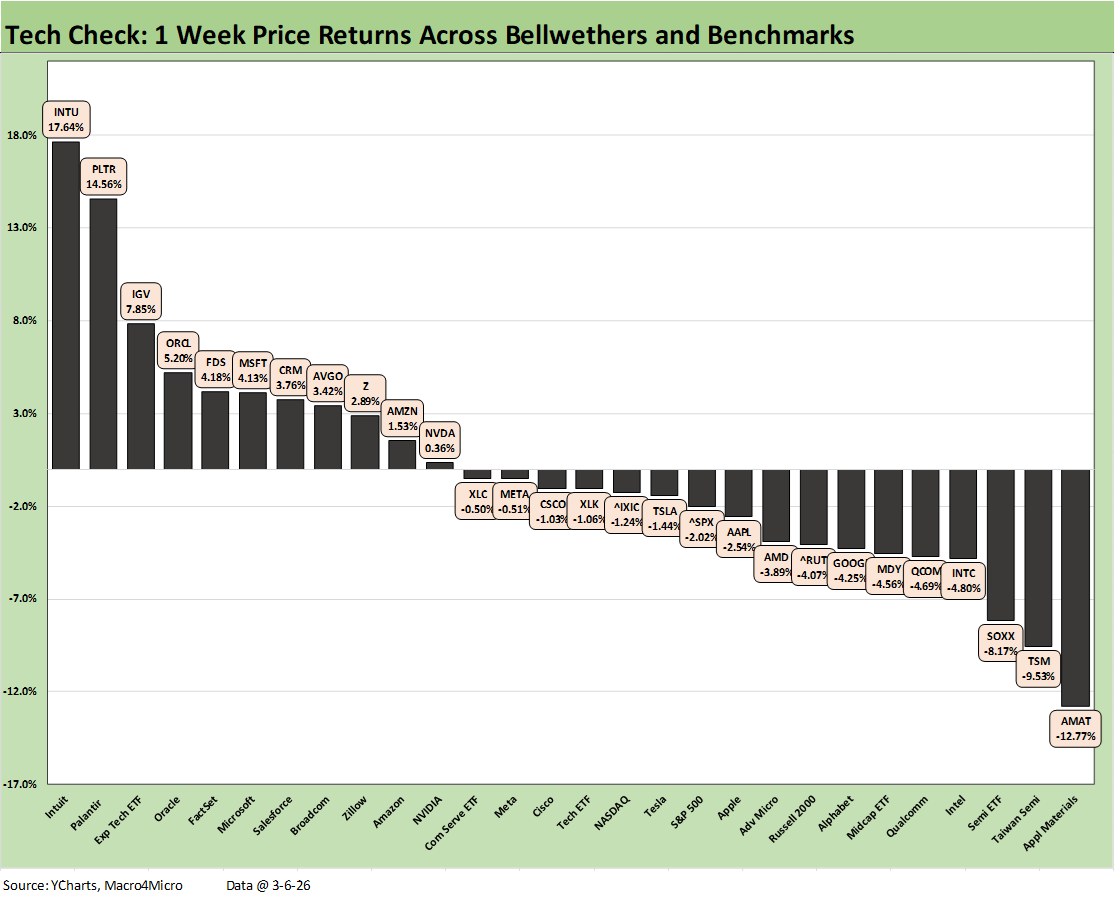
For the past 1-week return profile detailed in the chart, our “tech check” mix of 28 asset lines rang up a positive vs. negative score of 11-17. We see 4 of the Mag 7 in the red with a 5-5 split on the Mag 7+3 (with ORCL, AVGO, TSM). We see the recovery continuing for the theoretically AI-exposed SaaS-heavy businesses services companies we added to the tracking list (INTU, FDS, CRM, Z).
If one insists on finding a pattern in a 1-week move, the worst performers for the week included some names that would be highly sensitive to modest bearishness on total capex spend and global expansion follow-through.
Applied Materials as a capex play sits on the bottom, and TSM joins some semiconductor names. That included the Semiconductor ETF (SOXX). The market took a timeout to sort through what could spiral from here if the Mideast situation goes full-on dark side. The Software ETF (IGV) moved into rebound mode for the week after some recent beatings.
The data center end markets are like a case study in extreme capex needs, and that goes for everything from “what fills them” to the power demands and the investment needed to make the AI wave happen.
The extreme noise in the South Korean equity markets got a lot of attention on these topics as the Kospi posted up “the worst day ever” at -12% on Wednesday led on the downside by tech names. The ability of a radiating spiral from the Iran War multiplier effects could prompt some headline revisions in capex levels from “the bears” if this all gets worse across the US and the world. Europe and Asia will feel the LNG supply and cost fallout along with oil. As they stand now, those capex numbers in AI and related markets look more like sovereign GDP numbers.

The 1-month time horizon for the 32 benchmarks and ETFs weighed in with a positive-negative score of 11-21 with a wide Hi-Lo gap of over 24 points with E&P bouncing to #1 and Transports (XTN) tanking to dead last as airlines were pounded.
We see all the bond ETFs high in the rankings but only 4 were positive. That was another sign of the painful price action in equities when 1.39% for a bond ETF put TLT in the top quartile. Banks and Financials (XLF, KRE) took a beating as did Homebuilders (XHB), the small cap Russell 2000, and Midcaps.
There is little surprise that energy related ETFs were strong with 3 of the top 4 (XOP, XLE, AMLP) while Utilities (XLU) came out at #2. The electricity and piped utility gas inflation and now the oil and gas spike will make for some interesting policy debates around how to ease the high energy inflation metrics that will now get even worse with the Iran fallout hitting gasoline prices.

The 1-month “Tech Check” weighed in at 10-18 for the rolling 1-month with 3 of the 4 SaaS-based business services companies we dropped into the mix bouncing back. That includes FactSet (FDS) at #2, Intuit (INTU) at #3, and Salesforce (CRM) at #6. Zillow (Z) remains in the tank in last place. Palantir (PLTR) has rebounded from the selloff back to #1. Only 2 of the Mag 7 (MSFT, AMZN) posted positive returns and 3 of the Mag 7+3 (ORCL also positive).
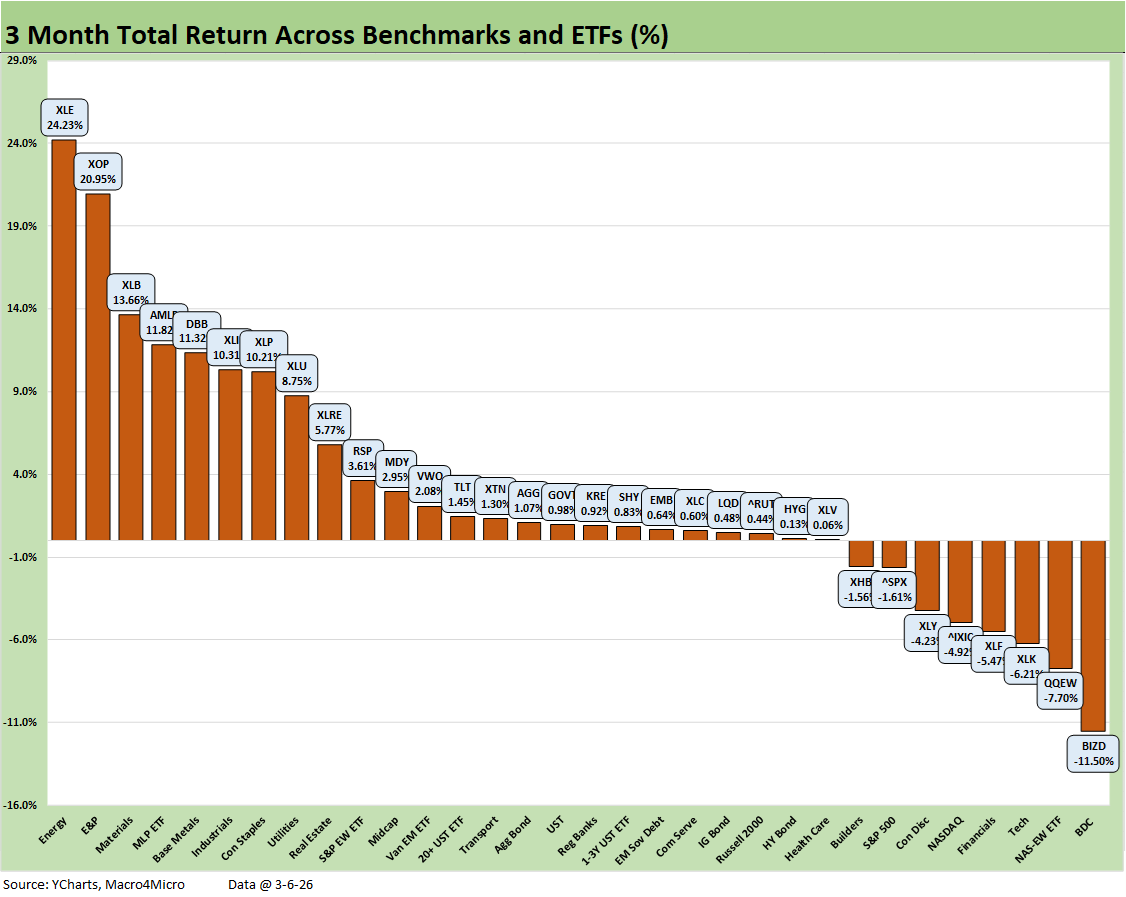
The 3-month mix posted a 24-8 score with all 7 Bond ETFs positive. We see no tech-based asset lines in the top quartile with the 3 energy names including XLE at #1, XOP at #2, and Midstream (AMLP) at #4. The rotation themes were in evidence with the top quartile featuring Materials (XLB), Base Metals (DBB), Industrials (XLI), and Consumer Staples (XLP). As usual, Utilities (XLU) performed well at the bottom of the top quartile.
The bottom quartile featured tech-heavy assets and financials with the BDCs (BIZD) dead last for 3 months and also for 1-year in the next chart. Equal Weight NASDAQ 100 (QQEW) was second to last and the Tech ETF (XLK) was 3rd to last.
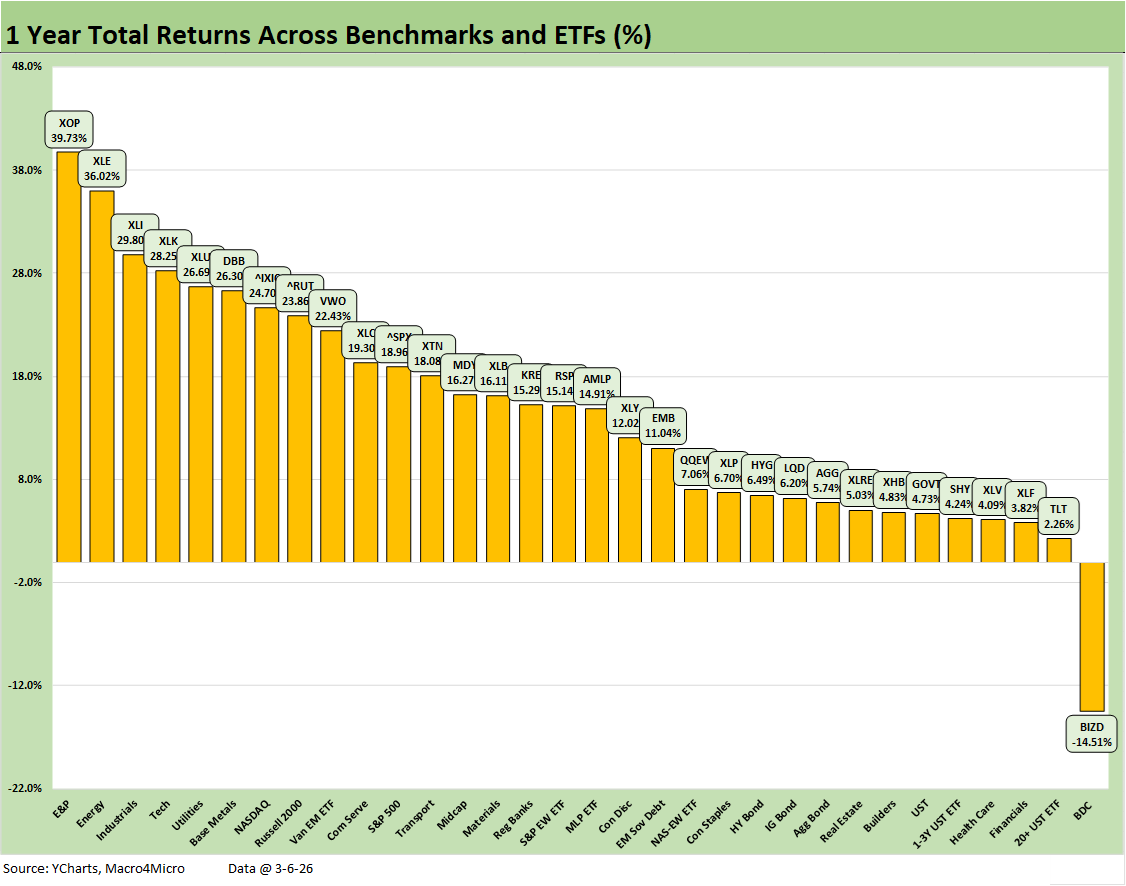
The 1-year time horizon is still riding a solid multisector performance across much of 2025 with a score of 31-1. Only the BDC ETF (BIZD) generated a double-digit negative return at -14.5% as BDCs were plagued by bad headlines and arguably bad due diligence, bad auditing, and excessive asset gathering impulses outpacing quality loan growth.
See also:
Payrolls Feb 2026: Into the Weeds 3-8-26
Employment Situation Feb 2026: Payrolls Get Ugly 3-8-26
VIX: Market Still Not Getting the Vapors 3-6-36
Meanwhile…Back in Economics and Tariffs 3-2-26
Market Commentary: Asset Returns 3-1-26
US Trade with the World: Import-Export Mix 2-25-26
Fun Facts: State of the Union Prep Kit 2-24-26
Market Commentary: Asset Returns 2-23-26
New Home Sales Dec 2025: Fresh Game Clock 2-21-26
PCE Income & Outlays Dec 2025: Inflation Reversal? 2-20-26
4Q25 GDP (Advance Est.): Less Distortion This Time 2-20-26
2025 trade Deficits: Reality vs. Rhetoric 2-19-26
Industrial Production Jan 2026: Capacity Utilization Trends 2-19-26
Home Starts Dec 2025: Wrapping a Weak 2025 2-18-26
Market Lookback 2-17-26
CPI Jan 2026: Reassuring Numbers, Missing Pieces 2-13-26
Existing Home Sales Jan 2026 2-12-26
Payrolls Jan 2026: Into the Weeds 2-11-26
Employment Jan 2026: Good Headline, So-So Mix 2-11-26
Retail Sales Dec 2025: Muted Year-End 2-11-26
Market Lookback: Monkey Business 2-9-26
Switzerland-US Trade: A Deficit that Glitters 2-3-26
US-Taiwan Trade: Risks Behind the Curtain 2-1-26
Trade Deficits: Math Challenge 1-30-26
China Trade: Shrinkage Report 1-28-26
Mexico Trade: Gearing up for More Trade Trouble? 1-27-26
Canada-US Trade: Trump Attack N+1 1-25-26
Policy Mud on the Wall: Consumer Debt, Residential Mortgages 1-15-26
2025 Spread Walks and Multicycle Return Histories 1-5-26
Annual Return Differentials: HY vs. IG Across the Cycles 1-3-26