
VIX: Market Still Not Getting the Vapors
We plot a VIX timeline since 1997. The Iran reaction is mild in context with some common (if turbocharged) elements from the past.

We revisit the wild ride of VIX across a period stacked with “events” from 1997. We look across the tech bubble and eventual implosions, the Greenspan hyper-easing, the Iraq War period of rising oil prices in 2003, the housing excess and related structured credit excess and mortgage pyrotechnics, the bank systemic crisis and counterparty shock that gave us bailouts and years of ZIRP, the shale boom and oil/gas binge-and-purge, the COVID pandemic and return to ZIRP, the inflation spike into a tightening cycle, and now the tariff and trade chaos alongside a fresh Middle East war between the US/Israel and their largest, most extreme enemy.
VIX as a volatility metric can wag risk pricing for a brief period and spill into credit, but the operating and financial risk fundamentals at the macro level, across industries and down to the issuer profiles are still the main event. Oil prices are still below numerous periods in the new millennium and that includes very recent periods. From the March 2003 invasion of Iraq through 2026 with Iran, the market watchers can look at the oil price charts and consider what came after for the broader economy. It offers a soothing lookback when volatility flares up. There are a lot of months with oil in the $80s, $90s and over $100 per barrel. WTI crossed the $90 line today and some dire supply warnings are coming from Qatar and Kuwait.
It is important not to disrespect the supplier chain shock potential. That flows into macro and micro financial performance, inflation, and Fed policy. Supply-demand imbalances cut across the usual energy layers (oil, gas/LNG) and power cost impacts. We will see effects on materials from chemicals to tech components. While oil always grabs the headlines, the Qatar impact from LNG to fertilizer and related inputs are also radiating out across global economies in Asia and Europe. China is facing rising risks while Ukraine and Russia policy is getting more attention. Zero sum effects are a worry.
When you consider the checklist in the first bullet point above, it is no wonder it takes a lot to shake the market when the events are understandable. That is the case now even if moving parts are not fully grasped in terms of the cascading effects and unpredictable reactions of an inherently volatile US leader. The Iran War is at least operating in a well-traveled area of oil and gas price uncertainty and the protracted economic grind of war and contingent terrorist threats. The market has seen plenty of both.
The tail risk is the current backdrop flowing into trade wars (Trump embargo threats and the EU using the anti-coercion bazooka). EU and Canada in trade wars with the US is not in the pricing yet. The demands for Iran’s unconditional surrender and Trump able to approve Iran’s leaders certainly would require boots on the ground (many and for a long time). Kurds being armed and Turkish anger are other risks “not on the VIX checklist” at this point.
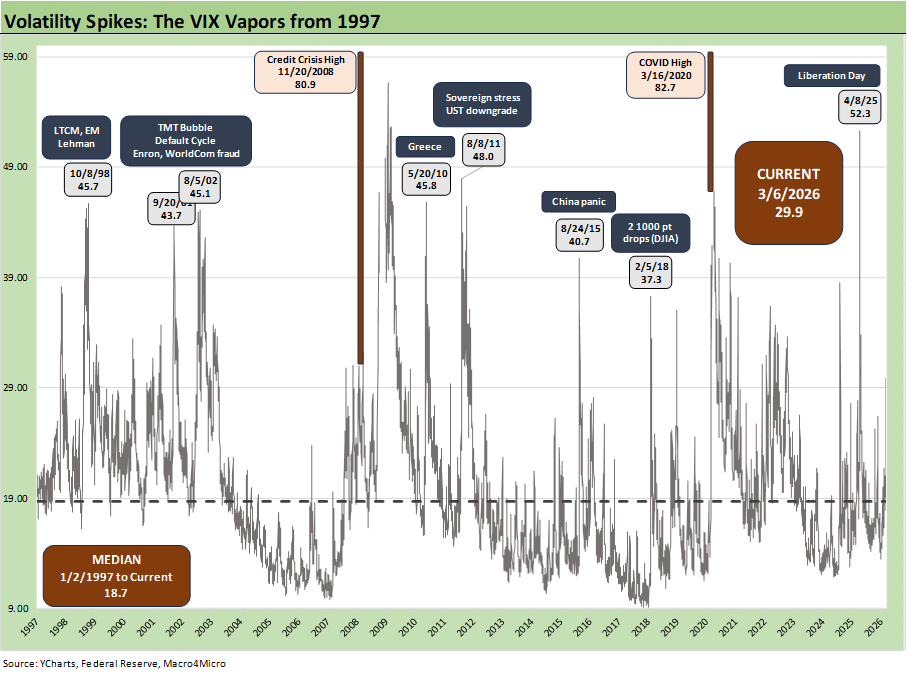
Note on chart format: We use a scale for the VIX chart up to 60 so the moves in the 20 to 50 range do not get visually minimized by the two outliers above the 80 line that came with the credit crisis in fall 2008 and the VIX peak that unfolded with the COVID pandemic panic of March 2020.
VIX spikes in theory react to surprising events that carry material effects that could flow into securities markets and the financial system. We see the current VIX reaction as very muted compared to what unfolded with the Liberation Day fiasco. Liberation Day had the combined effects of being economically damaging, conceptually clueless, and a case study in fact denial. Some would say that should not have been a surprise given the rhetoric, but it was dramatically dialed back as it took a toll on markets. The murky part was the behavioral analysis and lack of checks and balances. That was new to the US.
We highlight that this chart reflects the market close on each day and not the intraday highs, which on numerous occasions were much higher than the closing level.
March 5 closed at 23.7, but Friday saw a jump to 29.9 as more bad news on supply and capacity shut-downs stream out of Qatar and Kuwait among many other sources with less of a political axe. The sea level (literally) pragmatic, realistic assessments have little in common with White House attempts to “jawbone” some confidence.
In the context of this VIX timeline, the post-Iran move is low relative to many past headline events. The VIX move so far is less about shock and more about gauging the scale of the damage across the macro picture (notably inflation, energy setbacks, and FOMC action). The drag on the consumer from higher prices looms large for gasoline at the pump but also how that flows into food, freight/ logistics and surcharges, etc. The negative payroll numbers out today seem more like a sideshow. We will look at those in a separate comment.
A great big trade risk spike dead ahead?
With Trump threatening Spain with an embargo as punishment for not supporting the Iran attack, the EU anti-coercion instrument would seem to apply there. The threats from Trump against Spain and thus the EU fits the reasons for why the EU was formed and the ACI was approved. If the EU does nothing, Trump will have mortally wounded what the EU stood for. Then he wins, and the EU loses.
With energy markets under siege and Qatar a leading player globally in the fertilizer chain, a clash with Canada in the USMCA review ahead could create some troubling scenarios. If Trump is threatening the EU (Spain embargo) and Canada (USMCA review) both in 2026, the plot just gets thicker.
Kuwait has joined the chorus on supply alarm and their storage crisis is not new to the US markets. Back in 2020, the inability to move oil with a COVID demand crisis ran into a storage challenge but with the flip side effects of a negative WTI futures market. This time, the storage challenge would lead to shutting in capacity due to the inability to move the oil out of the Strait of Hormuz. Some oil trade rags and industry leaders (including Qatar) have cited $150 oil price risk and material lags to restarting some operations.
Quick recap of spikes in the VIX chart…
Below we revisit some of the big events along the timeline of the VIX history in the chart.
October 1998: The Russian default in Aug 1998 was obviously bad news, but the portfolio impacts and excessive leverage in the system (e.g. LTCM) created a bad case of nerves on the suspected fallout (rumored or otherwise). The Fed intervened to a degree but essentially forced the major banking and securities parties to bail out LTCM in a private market solution (only Bear said “no!”). Among the potential victims the market worried about in Oct 1998 was Lehman. The main rumors were tied to Lehman’s theoretical CDS exposure to defaults. That crisis at Lehman did not come to pass based on their documentation tweaks on Russian exposure among others (which various back channels confirmed). EM contagion was a real worry in 1998 and the FOMC eased in the fall to mitigate market risk (see Credit Cycles: Historical Lightning Round 8-8-24).
Aug 2002: The summer of 2002 saw chaos in the HY and IG credit markets as WorldCom set off a multiplier effect panic. That came after WorldCom’s June shocker headlines that the company had been capitalizing billions in expenses and overstating its earnings (aka committing fraud). The series of market shocks started with Enron in late 2001 and spread to a range of other Chapter 11 cases in TMT and power (including utilities) and other controversial headlines (e.g. Tyco). Events in 2001 and 2002 were bad enough to bring down one of the largest and most successful accounting firms (Arthur Andersen) and brought waves of investigations and new regs (Sarbanes-Oxley). That stretch of time in 2002 crushed confidence, credit contracted and defaults were spiking (see Greenspan’s Last Hurrah: His Wild Finish Before the Crisis 10-30-22).
Nov 2008: The VIX closed above the 80 line in the aftermath of the credit crisis, Lehman collapse, and AIG bailout. Multiple banks merged with the Fed’s active involvement. The timeline since the emergency kicked into gear in mid-Sept 2008 saw the market more broadly come around to how life-threatening the “bank crisis” was to the functioning of the economy (credit contraction risk, household credit card lines, LOCs and trade credit, ABS market functionality, etc.). Simplistic revisionists still understate how many dominoes were lined up to fall if action had not been taken.
May 2010, Aug 2011: The EU-based sovereign crisis was in some ways a PTSD flashback to the bank crisis. The idea was “if the sovereigns go, the banks go.” Many marveled at how a nation such as Greece could set off such a panic in May and June 2010, but the reality was, “when you looked at Greece in 2010, you see Italy and Spain.” The “whatever it takes” ECB mantra calmed the EU markets down by summer of 2012 for a big credit market rally, but the evolving risk checklist and fears around sovereign exposure saw VIX peak in Aug 2011 with HY spreads hitting cyclical highs in the fall. The US downgrade and budget brinkmanship all weighed in.
August 2015: The China equity markets were in a meltdown and that was hitting global market valuations with the #2 economy wandering into some uncharted territory to that point. In context, a VIX of over 40 in Aug 2015 was well below where Liberation Day shook out in April 2025. The 2015 market panic period also saw oil prices collapsing and outsized E&P concentration in the HY credit markets driving defaults across 2015 and into early 2016.
Feb 2018: The 37 handle VIX in early 2018 and the spectacular moves in equities (multiple 1,000 point declines) are long forgotten except in some charts. Trump extols his first term as the “best economy in history” (ever, ever), but the rise of tariffs as a priority, the NAFTA renegotiation, and slowing economy into 2019 do not agree with his memory. The year 2018 proved to be a challenging ride with all the major equity and debt benchmarks posting negative returns for the calendar year with cash outperforming (see HY Pain: A 2018 Lookback to Ponder 8-3-24, Histories: Asset Return Journey from 2016 to 2023 1-21-24). When 2019 started off under pressure, Trump was screaming for negative fed funds rates, and the FOMC delivered part of the easing he needed in 2H19. Powell basically bailed out Trump’s 2019 economy with 3 cuts in 2H19.
March 2020 and COVID: We are not surprised that COVID posted the highest VIX of the timeline with a modestly higher level than what the VIX posted during the systemic bank crisis of late 2008. The bank crisis was at least something you could frame and conceptualize even if the quantification of the loss exposure and government relief action was essentially impossible. For COVID, it was “all new” even if some of us had heard stories from relatives (or read books) about the misnamed “Spanish Flu.”
The solutions for COVID were heavily event-driven with a vaccine launched by Nov 2020. With the earlier credit crisis playbook in hand, the Fed could mitigate liquidity risk in the COVID environment to guard against bank line and credit card drawdowns. ZIRP returned, liquidity backstops were in place, and ABS support was revisited. The stage was set for risky asset rallies with ZIRP and a UST bull flattening that supported liability management (“refi and extend”), lower coupon costs for borrowers, and lower mortgage rates for households.
Liberation Day April 2025: The move to 52.3 for VIX was more about the shock of what Trump announced and how he announced it (see Reciprocal Tariff Math: Hocus Pocus 4-3-25. Reciprocal Tariffs: Weird Science Blows up the Lab 4-2-25). We have had a lot to say on the topic, but overall the barrage of pure fabrication and disinformation from the start to even this past week does not help confidence (see Meanwhile…Back in Economics and Tariffs 3-2-26).
Market disrupting events come and go. The overriding focus should still be on how it translates into economic growth, jobs and national security. Given the array of events now unfolding, all of those are subject to considerable second guessing. The direction of events from here unfortunately will be wrapped up in war, geopolitics and the unpredictability of the major moving parts in commodities, inflation and currencies. The potential for escalation of trade conflict is a rare overlay.