
Trade Deficits: Math Challenge
With a fresh rise from 2024 to a record LTM Goods trade deficit through Nov 2025, assumptions on reshoring are shaky.


Trade policy architect at work.
We run through the high-level trade balance, import, export, and total trade volume data across the major data categories. The numbers do not show an outcome in line with the rhetoric or the zeal.
The LTM trade data shows a record high goods trade deficit through Nov 2025 despite the highest tariffs since the Great Depression and all the import/export noise that continues to get noisier.
If six of the last eight years delivered record goods trade deficits (including 2025 based on LTM data through Nov.), and a lot of disruptions in profitability, unit costs, and product prices, maybe this tariff policy fixation is not working as planned.
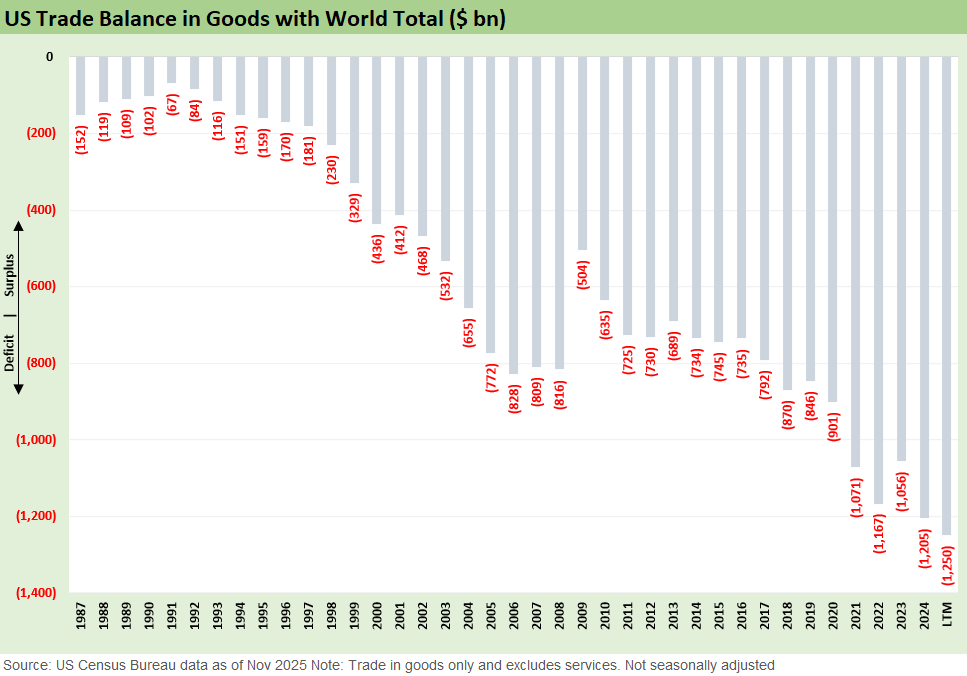
The above chart updates the Goods trade deficit since the late 1980s (pre-NAFTA), and there is not much mystery in the trend line. We see a fresh record high in the goods deficit. Another record deficit for 2025 will follow a record in 2 of the 4 years in Trump 1.0 (2018, 2020) and 3 of 4 years under Biden as Biden kept the Trump Tariffs even if he amended some to get rid of the “National Security” label.
That means six of the last eight years have hit (or are on track to hit, in 2025) record deficits (3 Trump, 3 Biden) with tariffs now a cornerstone policy under both Trump and Biden. The 2025 tariff mix escalates that policy with the highest tariffs since Smoot Hawley.
This trend line may may raise the obvious question:
Do tariffs even serve the goals of Trump’s economic theories on tariffs?
The false (or erroneous) statements by Trump on how tariffs work (e.g. “selling nations paid hundreds of billions in Trump 1.0”) do not really matter at this point. The facts are outside the political discourse like numerous other issues (who won the 2020 election etc.). We cannot even get Trump to admit who writes the tariff check. That ship of facts has sailed and sank.
Trade deficits are not “subsidies” or America writing a check, but Trump believes that. In the meantime, the trend line in 2025 has flunked Trump’s own ground rules for his end game – that is, reducing the trade deficit. The solution will likely be more tariffs as EU gets closer to a real deal, Canada attacks worsen, and Mexico gets revisited in the USMCA review.
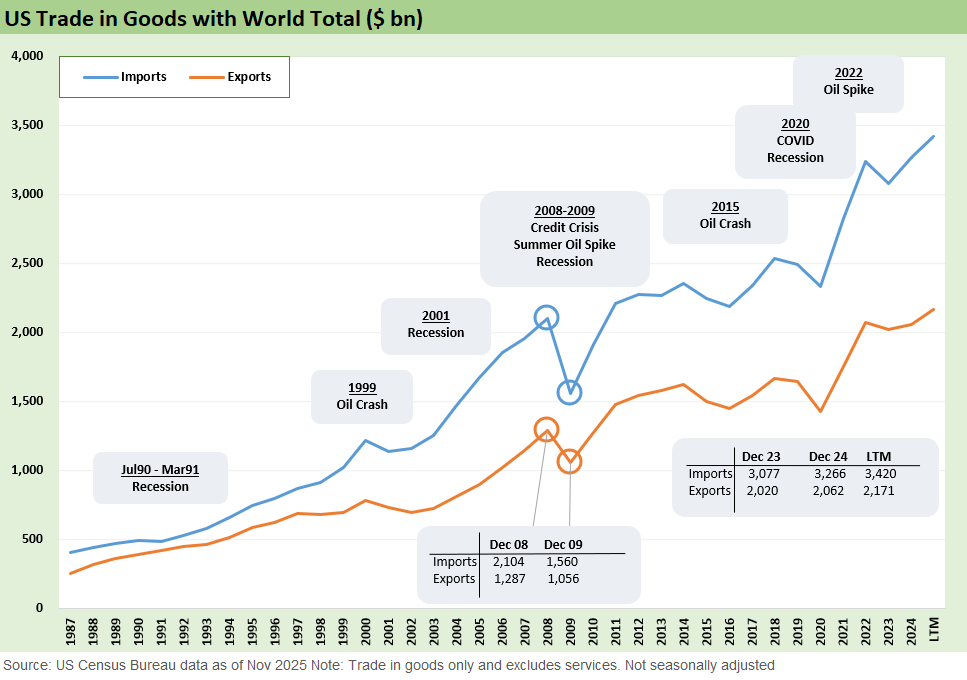
The above chart details the latest time series for imports vs. exports. The long-established trend line over time for trade volumes is “up and to the right.” We add some highlights noted along the way. Beyond the simple reality of growing US and global economies, there is the simple reality that the largest economy with the most aggressive consumer base of spenders is “buying more stuff” as the economy grows. The US buyer/importer tends to enjoy buying what they want at reasonable prices.
Similarly, those that “make the stuff” or “stock the stuff” on the shelves prefer to make or buy the goods at lower unit costs. That status quo has been disrupted in 2025 after supplier chains were slammed by a wide range of tariffs. Seller operations and related freight/logistics and distribution networks had in many cases been built over decades. For some (notably in small businesses), the cost shocks were existential.
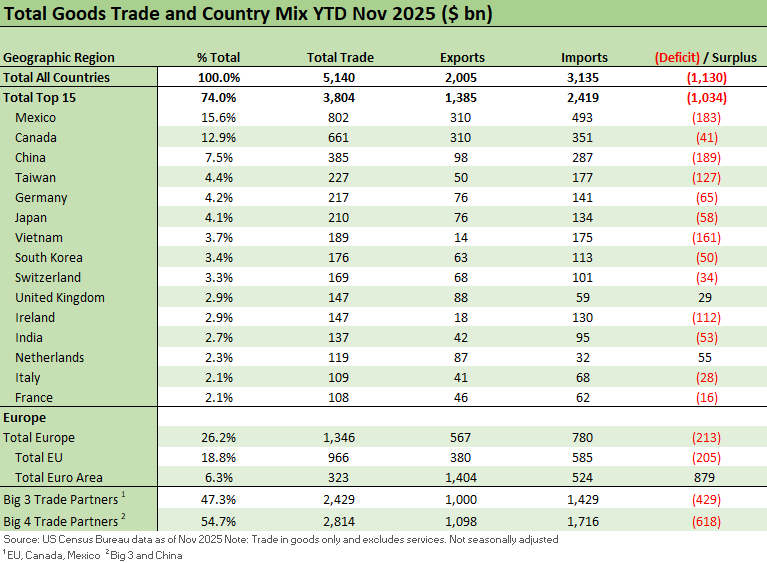
The above table updates the YTD trade partner rankings showing total trade volumes. the moving parts of imports and exports, and the trade balance with that partner. Taiwan and Vietnam are two of the more interesting trade partners stories below the Big 4 trade partners even if everyone likes talking about Switzerland and the drama around that story (gold and watches get too much airtime).
We see 13 of the top 15 with trade deficits. UK and Netherlands are the only trade surpluses. Brazil is below the top 15 trade partners an posted a surplus, but we all know how that one ended. Trump slapped 50% tariffs on them for not dropping charges against his “coup bro” (Bolsonaro). As a frame of reference, Trump had assigned 10% tariff on Brazil on Liberation Day, but then he wanted to free his pal for attempting to stay in power. It happens (in countries without stacked courts).
Trump has since backed off some tariffs given the consumer fallout (e.g. coffee). Brazil still had record exports as an economy in 2025 despite the US attacks as Brazil grew its export base away from the US and notably with China. EU and Canada are looking to pursue a similar strategy with more reliable trade partners even if product line by product line.
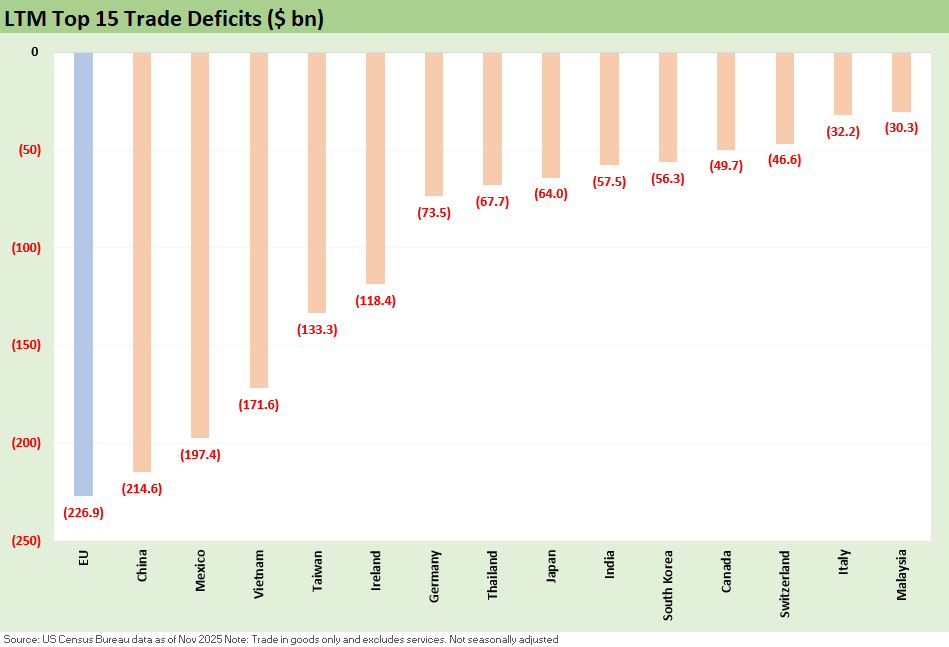
The above chart details the top 15 trade deficits. We see the usual suspects with 3 of the Big 4 at the high end (EU, China, Mexico). Canada is well down the list and even posts a surplus ex-oil (see Canada-US Trade: Trump Attack N+1 1-25-26). Vietnam is a recurring nation in the top tier of trade deficits (see US-Vietnam Trade: History has its Moments 7-5-25).
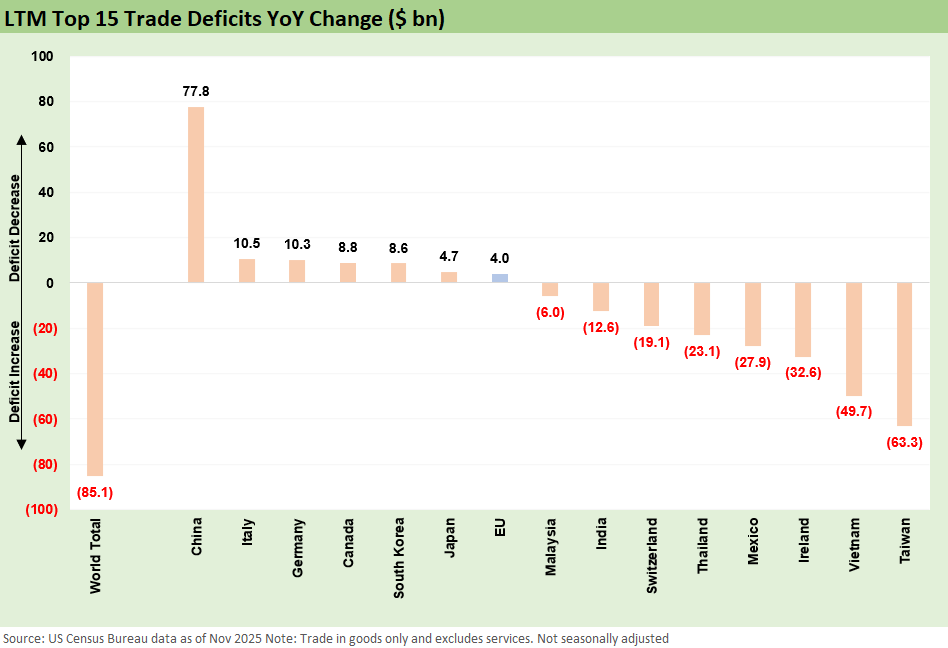
The above chart plots the change in trade deficits (positive is a decline in the trade deficits). We see the dramatic decline in the China trade deficit on the left but the massive increase in the Taiwan deficits on the right. We will look at the Taiwan product deltas in imports and exports in a separate note.
The fact that China’s deficit is much lower and Taiwan much higher has some material overlap with the “geopolitical topic of the postwar age” in the “one China policy” that had been worked out with the UN and the US back in the 1970s. That is a separate topic for another day, but Taiwan is perhaps the most critical trade partner risk on the list give it tech supplier chain domination.
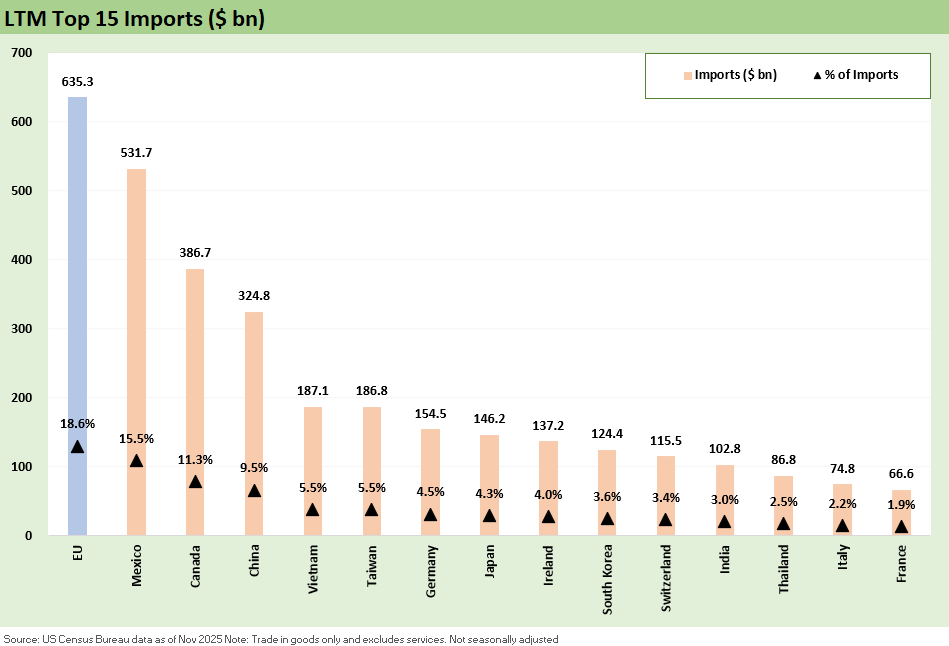
The above chart details the top import trade partners. There are no surprises in this list. The Big 4 total is around 55% of imports and almost 2/3 if we add in Vietnam and Taiwan. There is no shortage of tense 20th century history on that list.
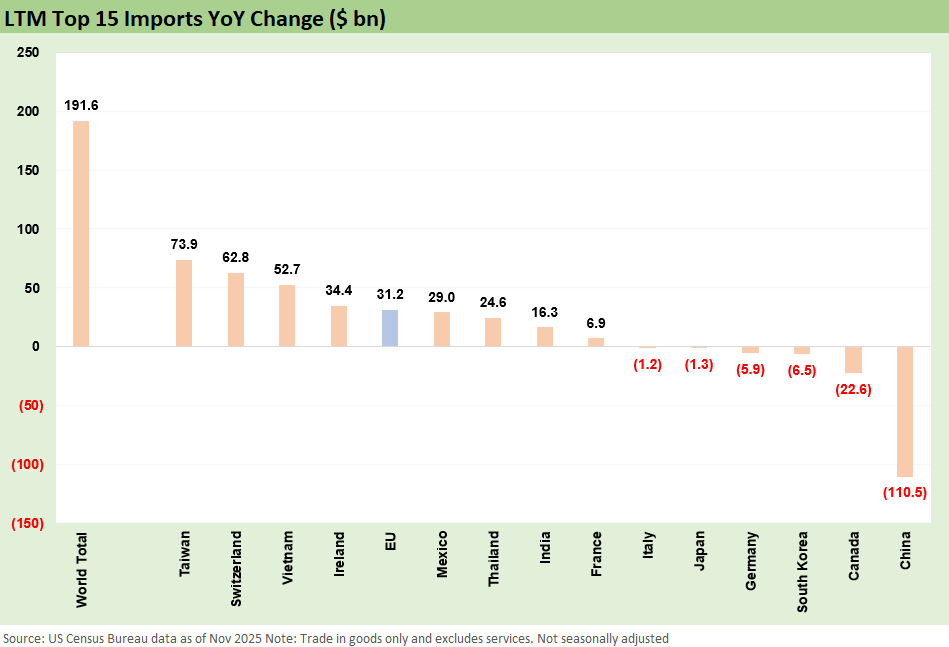
The above chart breaks out the import deltas with Taiwan, Switzerland, and Vietnam way out in front. The sharp decline in China is a double edged sword since the Trump abuse of trade partners and US allies opened up opportunities for China to still reach record exports in 2025 even with major US declines. That will create even more tension with Trump and legacy US trade partners as we already saw this week with Canada and the UK.
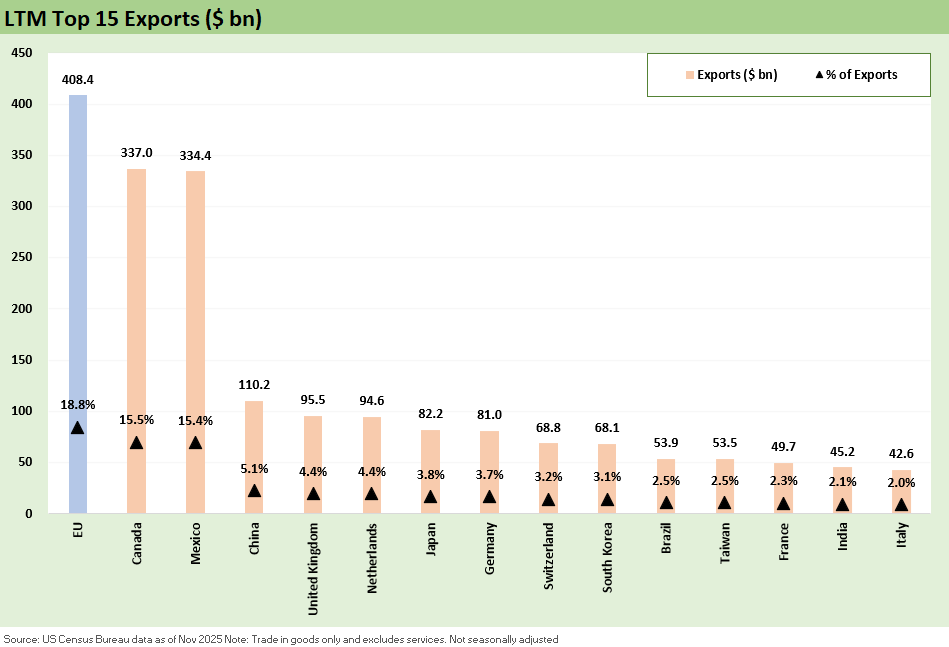
The above chart breaks out the top export markets with EU, Canada, and Mexico comprising almost half of total exports. Based on our reviews of the product mix in exports, we would rate Canada as the most valuable trade partner for exports (see links at bottom). The US also has a goods trade surplus ex-crude oil. That favorable assessment on Canada as a trade partners is not a view you will hear from Trump or any of his “me too, what he said” minions. The line items are there to review.
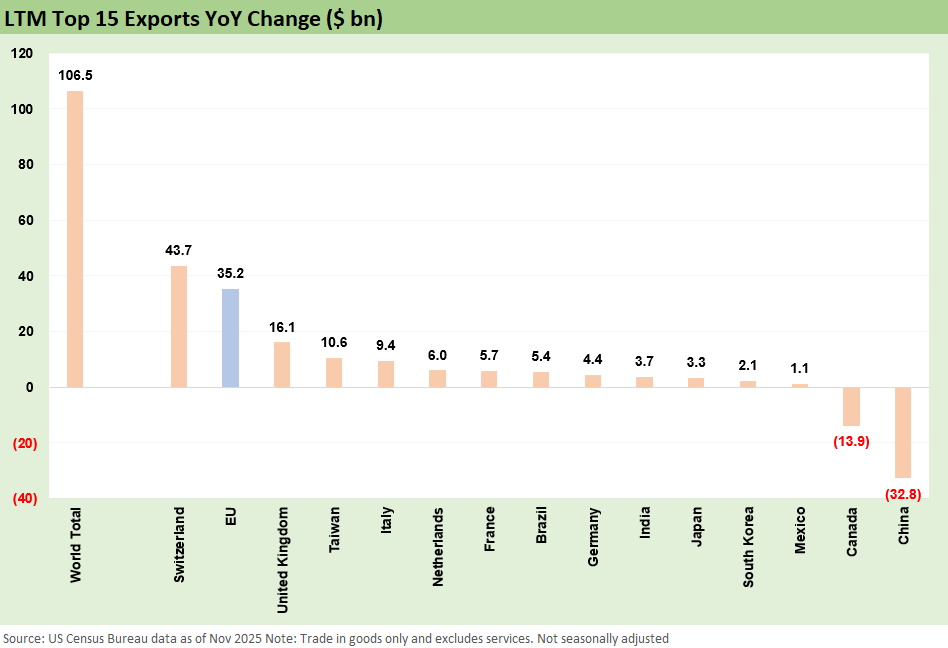
The above chart breaks out the export deltas with a material move higher for Switzerland and the EU. We will look at those in separate commentaries. China and Canada declined.
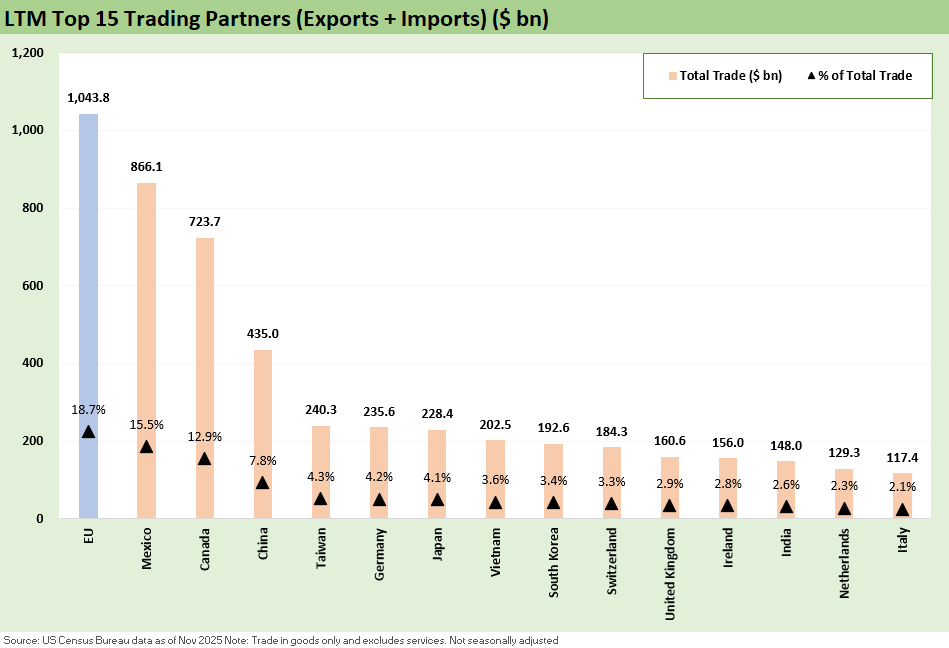
The above chart summarizes the total trade volumes (imports + exports) leaders with the Big 4 around 55% of total. Half the top 10 are from Asia. If we exclude the EU bucket, the remaining 14 include 6 Asia, 6 Europe, and 2 North America.
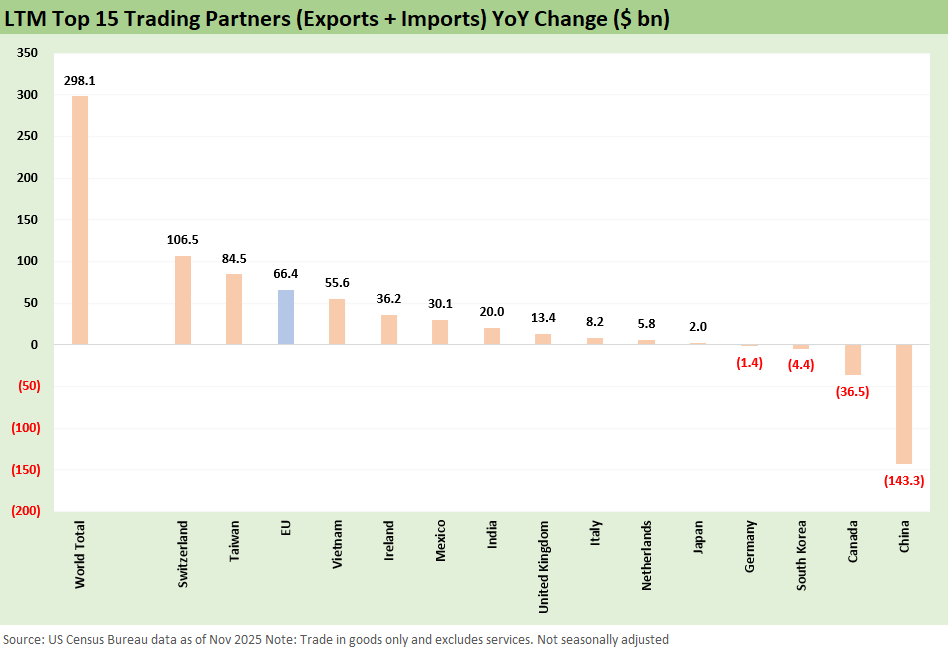
The above chart updates the LTM deltas in total trade volumes. Switzerland has the largest increase and China the biggest decrease.
Tariff commentary:
China Trade: Shrinkage Report 1-28-26
Mexico Trade: Gearing up for More Trade Trouble? 1-27-26
Canada-US Trade: Trump Attack N+1 1-25-26
US-Canada Trade: 35% Tariff Warning 7-11-25
India Tariffs: Changing the Music? 7-11-25
Taiwan: Tariffs and “What is an ally?” 7-10-25
Tariff Man Meets Lord Jim 7-8-25
South Korea Tariffs: Just Don’t Hit Back? 7-8-25
Japan: Ally Attack? Risk Free? 7-7-25
US-Vietnam Trade: History has its Moments 7-5-25
US Trade in Goods April 2025: Imports Be Damned 6-5-25
Tariffs: Testing Trade Partner Mettle 6-3-25
US-UK Trade: Small Progress, Big Extrapolation 5-8-25
Tariffs: A Painful Bessent Moment on “Buyer Pays” 5-7-25
Trade: Uphill Battle for Facts and Concepts 5-6-25
Tariffs: Amazon and Canada Add to the Drama 4-29-25
Ships, Fees, Freight & Logistics Pain: More Inflation? 4-18-25
Tariffs, Pauses, and Piling On: Helter Skelter 4-11-25
Tariffs: Some Asian Bystanders Hit in the Crossfire 4-8-25
Tariffs: Diminished Capacity…for Trade Volume that is…4-3-25
Reciprocal Tariff Math: Hocus Pocus 4-3-25
Reciprocal Tariffs: Weird Science Blows up the Lab 4-2-25
Tariffs: Enemies List 3-6-25
US-Mexico Trade: Import/Export Mix for 2024 2-10-25
Aluminum and Steel Tariffs: The Target is Canada 2-10-25
Trade Exposure: US-Canada Import/Export Mix 2024 2-7-25
US Trade with the World: Import and Export Mix 2-6-25
The Trade Picture: Facts to Respect, Topics to Ponder 2-6-25
Tariffs: Questions to Ponder, Part 1 2-2-25
US-Canada: Tariffs Now More than a Negotiating Tactic 1-9-25
Mexico: Tariffs as the Economic Alamo 11-26-24
Tariff: Target Updates – Canada 11-26-24
Trump, Trade, and Tariffs: Northern Exposure, Canada Risk 10-25-24
Trump at Economic Club of Chicago: Thoughts on Autos 10-17-24
Facts Matter: China Syndrome on Trade 9-10-24
Tariffs: Questions that Won’t Get Asked by Debate Moderators 9-10-24
The Debate: The China Deficits and Who Pays the Tariff? 6-29-24
Trade Flows: Deficits, Tariffs, and China Risk 10-11-23
 |
|