
New Home Sales Dec 2025: Fresh Game Clock
Census catching up on new home sales for Dec 2025 with slight MoM downtick and modestly higher YoY. Full year 2025 was down slightly.


Need a lift in 2026.
The combination of affordability challenges and supply constraints left new single family homes sales for calendar 2025 down by -1.1% nationally on a not seasonally adjusted basis with Dec 2025 ending the year down by -1.7% MoM on a SAAR basis and +3.8% for Dec 2025 YoY.
The supply of homes for sale at Dec 2025 were down by -2.7% MoM and -3.5% YoY for Dec 2025 vs. Dec 2024.
The median sales price in Dec 2025 of $414.4K was +4.2% MoM but down by -2.0% from Dec 2024.
The South region is still the main event on volume share at 61% of total share of NSA 2025 volumes as the South saw a minimal increase of +0.4% in 2025. The West was the #2 market and posted -4.9% NSA with the Midwest at #3 and +1.7%, and the small Northeast market generated -7.7% in sales volumes for the year.
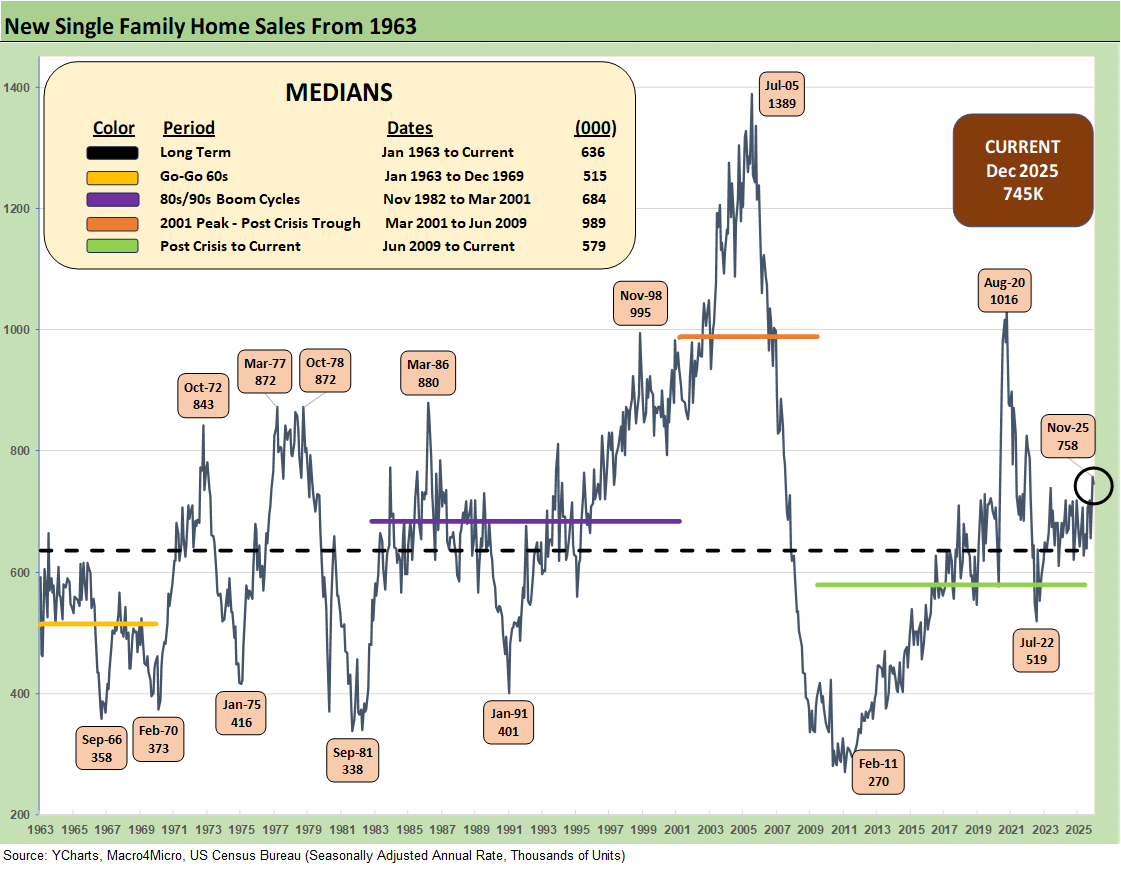
The above chart updates the new single family sales time series from 1963, and the current 745K SAAR is a small sequential move lower of -1.7% for Dec 2025. We saw 2 of 4 regions with negative MoM variances with the leading South region at -6.7% MoM and -1.1% YoY while the West posted a sequential increase of +9.0% MoM and +1.8% YoY. The Midwest posted a very strong +31.7% MoM and +30.1% YoY. The tiny Northeast market was -37.3% MoM and +12.1% YoY.
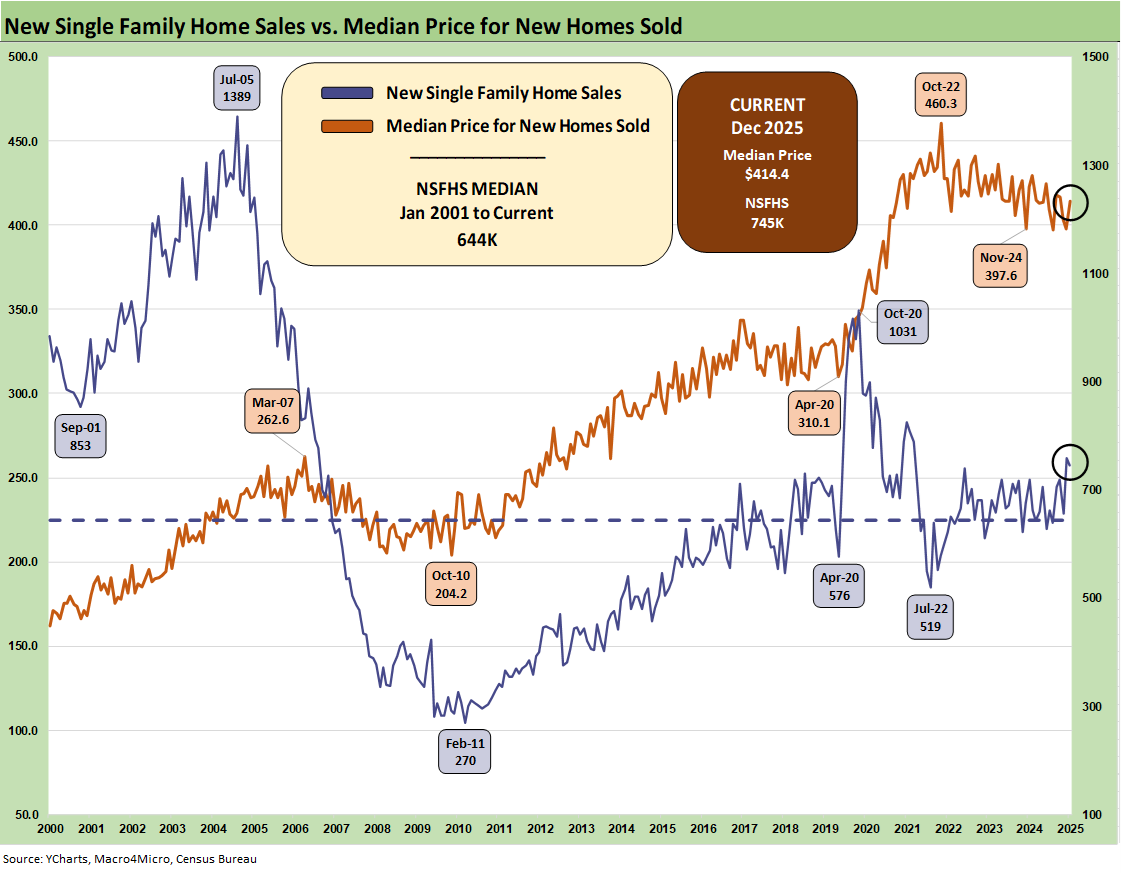
The above two-sided chart shows the sales pattern for the new home sales line since 2000 vs. the median prices, which weighed in at $414.4K for Dec 2025, up from $397.6K in Nov 2025 but down from $423K in Dec 2024.
The fact that prices had trended materially higher across the post-COVID cycle is old news, but the sensitivity of monthly payments is married more to mortgage rates as a critical variable in monthly payments.
Mortgages have been stubbornly high but are starting to see some relief with the Freddie Mac 30Y (set each Thursday) migrating to the low 6% range from the mid 6% range in the late summer. Mortgage rates remain the primary driver of weaker volumes in the lower price tiers in both new and existing home sales (see Existing Home Sales Jan 2026 2-12-26).
For the largest share of the housing market in the mid-price tiers, the combination of lower prices and in some cases sustained incentives along with cost challenges from tariffs was part of a pattern of gross margin erosion in 2025. Each builder has distinctive geographic mix shifts to consider when framing their ASP trends.
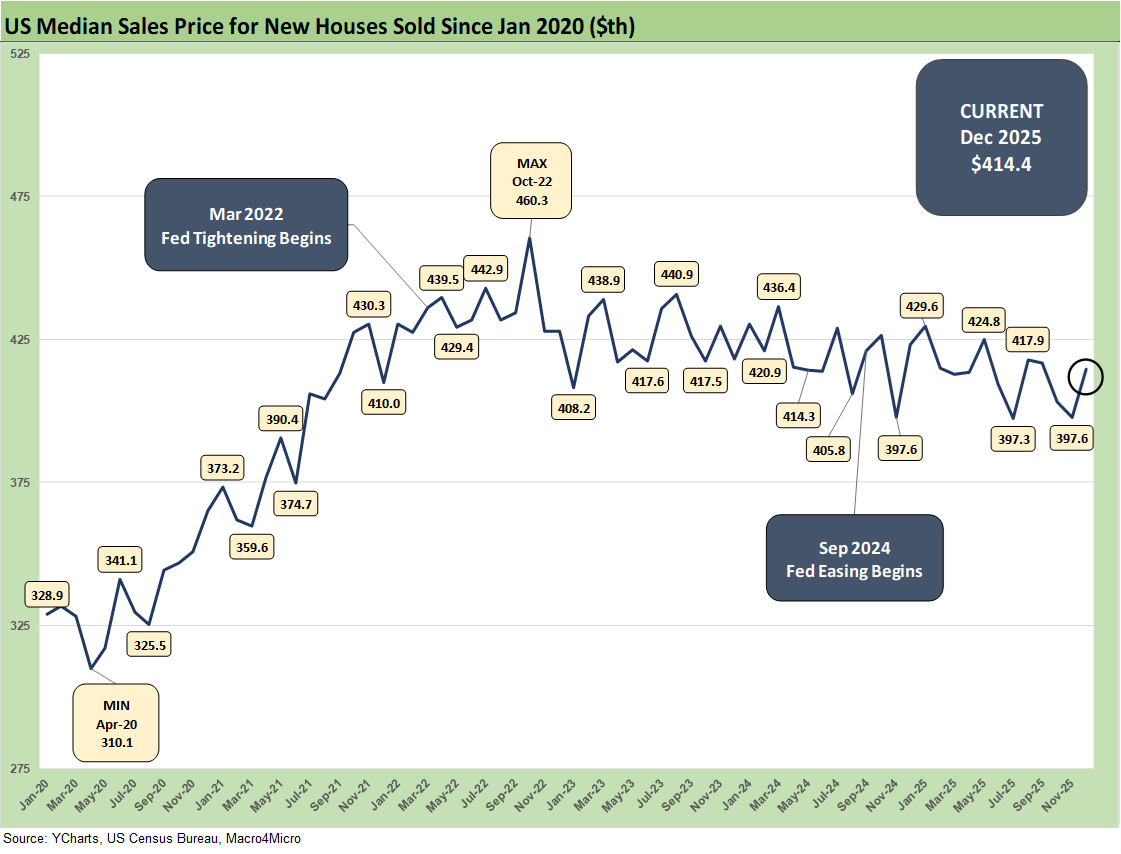
The above chart updates the running median price trends. Builder fears of higher material and supplier chain costs are not going to do much to relieve homebuilders in their pricing strategies with gross margins softening in 2025 and into 2026. That said, most are posting margins still above pre-COVID levels even if down sharply from abnormal margin peaks in 2022.
The homebuilders downplay the tariff problem on earnings calls and let the NAHB trade group do their talking for them. The bottom line is lumber, materials, appliances, etc., will bring lower margins or challenge price decision or both. The early signals are margins taking the hit. The SCOTUS IEEPA actions of this past week will not help much given the heavy use of Section 232 on materials (lumber, steel, aluminum, etc.). Immigration policy is also not helping on labor pools.
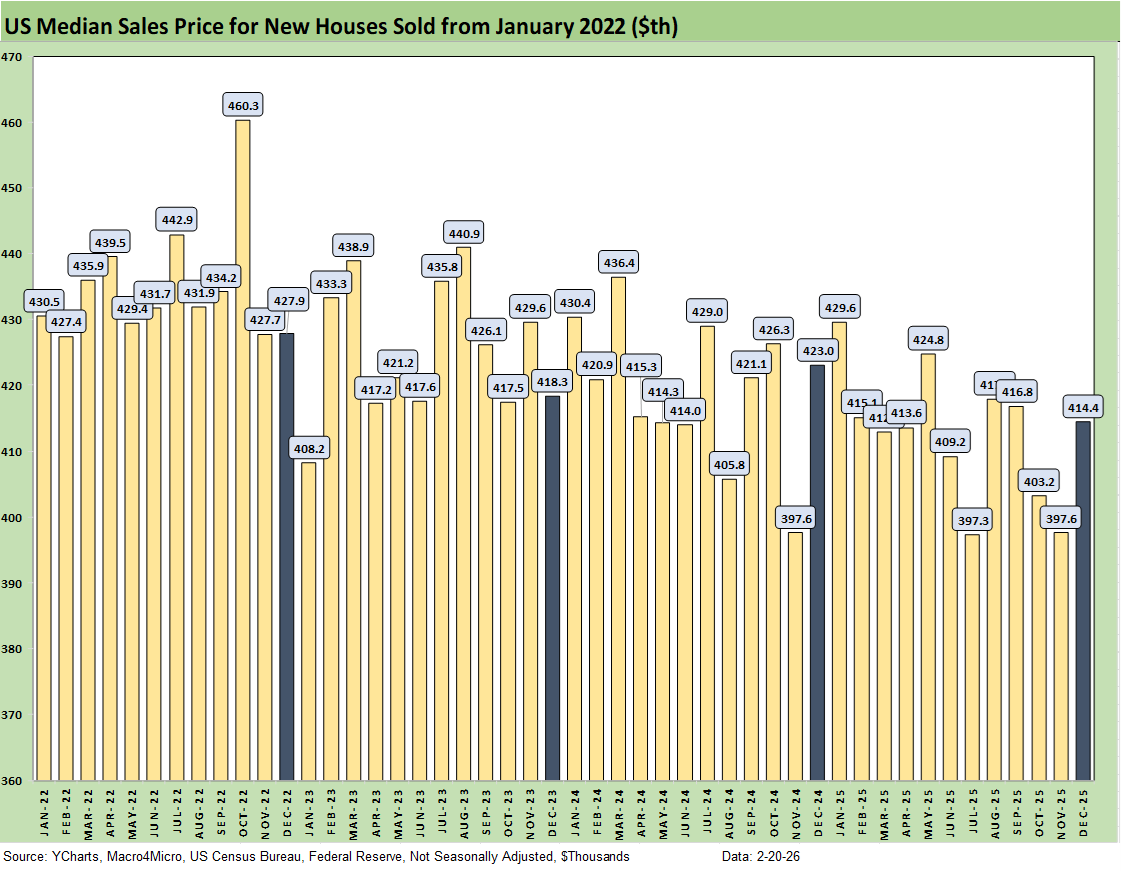
The above chart gives a different visual angle on the median new home sales prices from early 2022. That is a lot of $400K handles with some sub-$400K outliers such as Nov 2025. The current $414.4K can shift with regional mix as well as home price tiers and related supply issues. The affordability question is still intertwined with the monthly payment pressures from mortgages. It is about more than price.
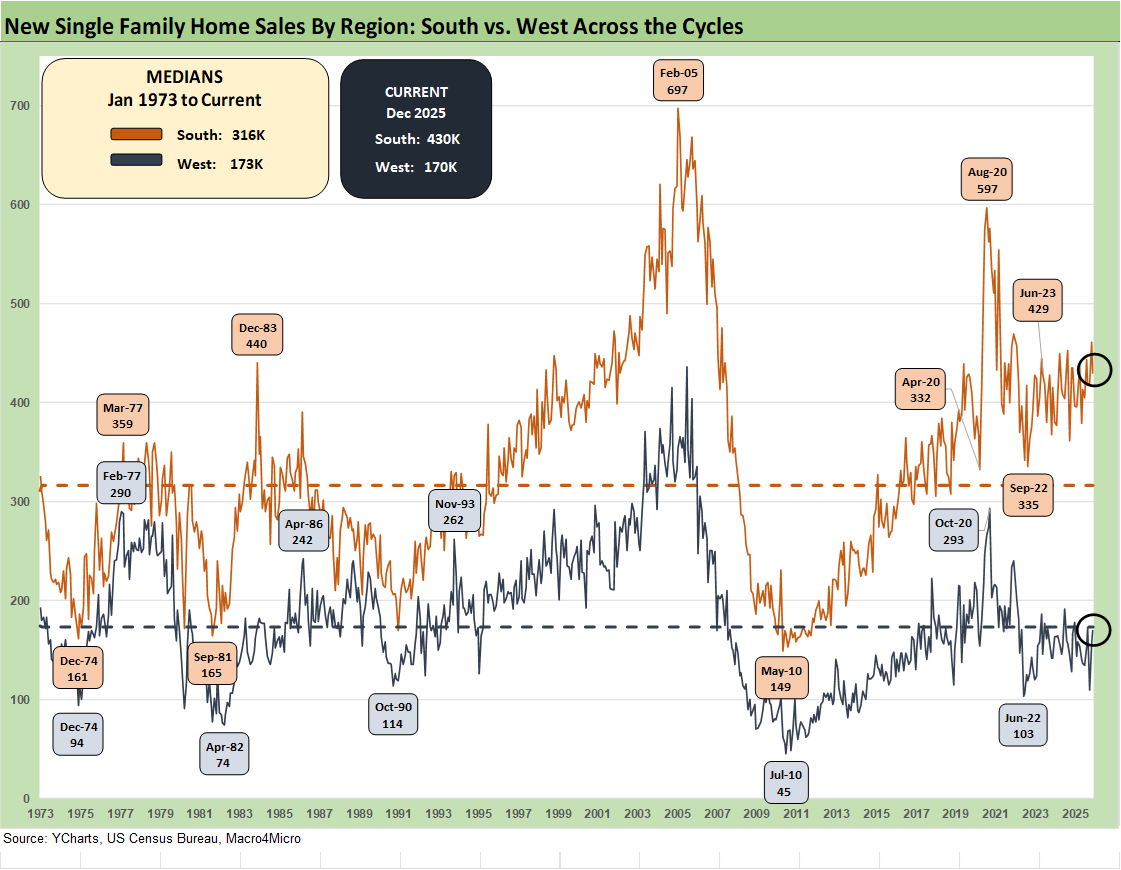
The time series above updates the new single family home sales across the cycles since 1973 for the #1 and #2 regions of the South and the West. These two regions are around 81% of total single family sales volumes.
The 430K for the South is around 58% of the total of all single family new home sales (SAAR basis) and posted a sequential decline of -6.7% from Nov 2025 and is down by -1.1% YoY. The West at 170K is 23% of the total. For the month, the West was +9.0% sequentially and +1.8% YoY.
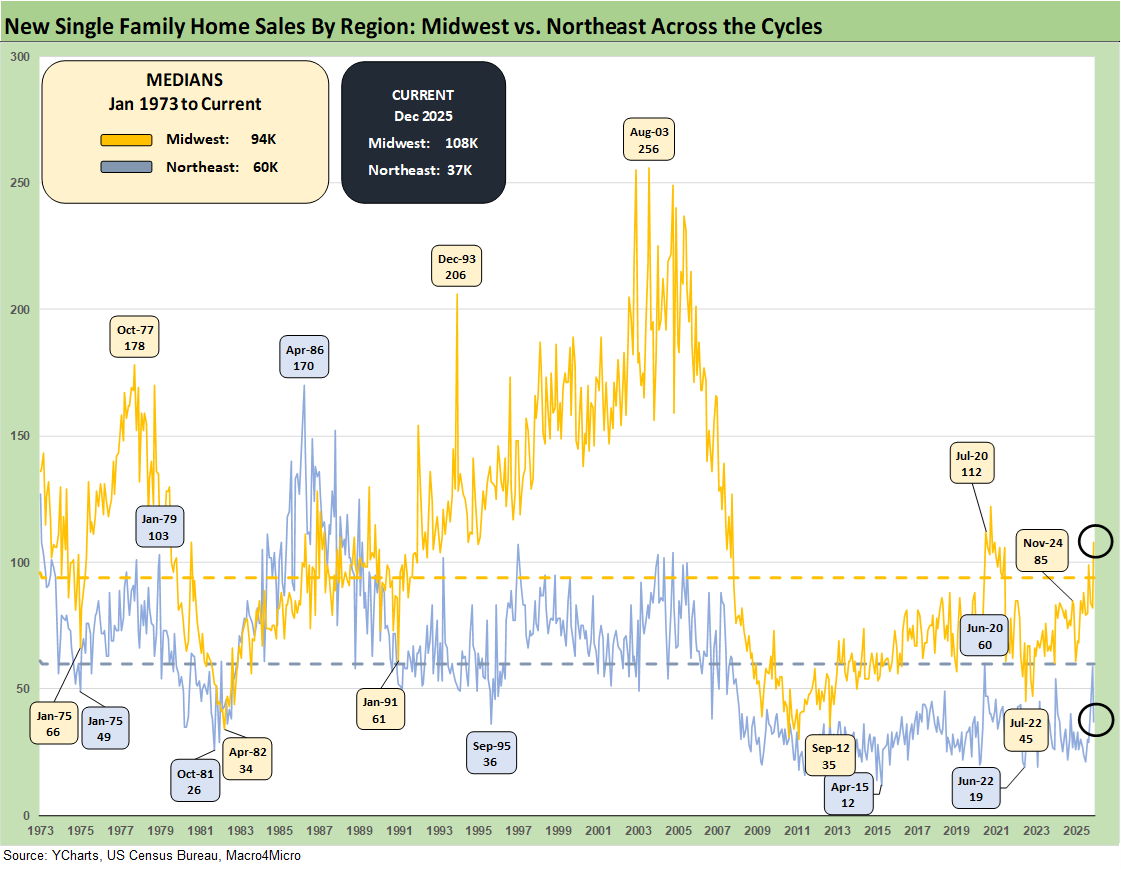
The smaller Midwest region and tiny Northeast region account for 14% and 5%, respectively, of new home sales in Dec 2025. The Midwest was up +31.7% MoM and +30.1% YoY. Northeast was -37.3% MoM and +12.1% YoY.
See also:
PCE Income & Outlays Dec 2025: Inflation Reversal? 2-20-26
4Q25 GDP (Advance Est.): Less Distortion This Time 2-20-26
2025 trade Deficits: Reality vs. Rhetoric 2-19-26
Industrial Production Jan 2026: Capacity Utilization Trends 2-19-26
Home Starts Dec 2025: Wrapping a Weak 2025 2-18-26
Market Lookback 2-17-26
Market Commentary: Asset Returns 2-16-26
CPI Jan 2026: Reassuring Numbers, Missing Pieces 2-13-26
Existing Home Sales Jan 2026 2-12-26
Payrolls Jan 2026: Into the Weeds 2-11-26
Employment Jan 2026: Good Headline, So-So Mix 2-11-26
Retail Sales Dec 2025: Muted Year-End 2-11-26
Market Lookback: Monkey Business 2-9-26
Switzerland-US Trade: A Deficit that Glitters 2-3-26
US-Taiwan Trade: Risks Behind the Curtain 2-1-26
Trade Deficits: Math Challenge 1-30-26
China Trade: Shrinkage Report 1-28-26
Mexico Trade: Gearing up for More Trade Trouble? 1-27-26
Canada-US Trade: Trump Attack N+1 1-25-26
Policy Mud on the Wall: Consumer Debt, Residential Mortgages 1-15-26
2025 Spread Walks and Multicycle Return Histories 1-5-26
Annual Return Differentials: HY vs. IG Across the Cycles 1-3-26