
Policy Mud on the Wall: Consumer Debt, Residential Mortgages
We frame the systemic context of consumer debt and mortgages as the White House pitches policies designed to buy some voter love.


Now in the double jeopardy policy round, where the scores can really change…
We update the systemic and gross dollar context for consumer debt and residential mortgages relative to GDP from the most recent Z.1 filing (3Q25) for a sense of scale.
The MBS buyback of $200 bn by the GSEs and the 10% cap on credit card rates need some systemic context at a time when rates are at a crossroad in FOMC policy and market reactions out the curve (steepening vs. flattening) is still a handicapping drill for 2026 (we expect steepener). While the MBS purchases can help over the very short term, the $200 bn is only around 1.5% of residential mortgage debt. It is somewhat of a political mind trick on what it means for relief in housing.
The White House has already faced a lot of push-back on how bad the 10% cap will be for credit cards. The threats of credit contraction at the household level (pulled lines, absence of new lines) harkens back to pulls during the COVID peak (that is, banks do cancel lines). We also need to fear asset quality threats depending on how the10% cap would be structured on a snapback after a 1-year period. Buying love from consumers has inherent risks and throwing mud at the wall is not risk free.
We have looked at these systemic metrics in the past (see Consumer Debt in Systemic Context 7-13-23), and the basic story has not changed much in the aftermath of the post-COVID rally with 4 of the past 5 years posting great equity markets with mixed macro factors but generally bullish risk appetites (ex-2022).
GDP is currently doing well by the new millennium standards of 2% economies even if the relative strength gets hyped by some artisans and trashed by others. Even during the recession fear peak of late 2022, Personal Consumption Expenditures (PCE) were high and unemployment very low. The consumer was the key and they spent liberally at high credit card rates well above 10% (see Unemployment, Recessions, and the Potter Stewart Rule 10-7-22).
Given the attacks on Powell (and by transitive property the entire FOMC), it is telling that the pace of inflation declines from the June 2022 high was the most rapid in the postwar era. The recession never came. You can blame the Fed for being late to act, but Fed action helped Biden be the second President in the last 60 years to finish his term with no recessions months (Clinton was the other in two terms).
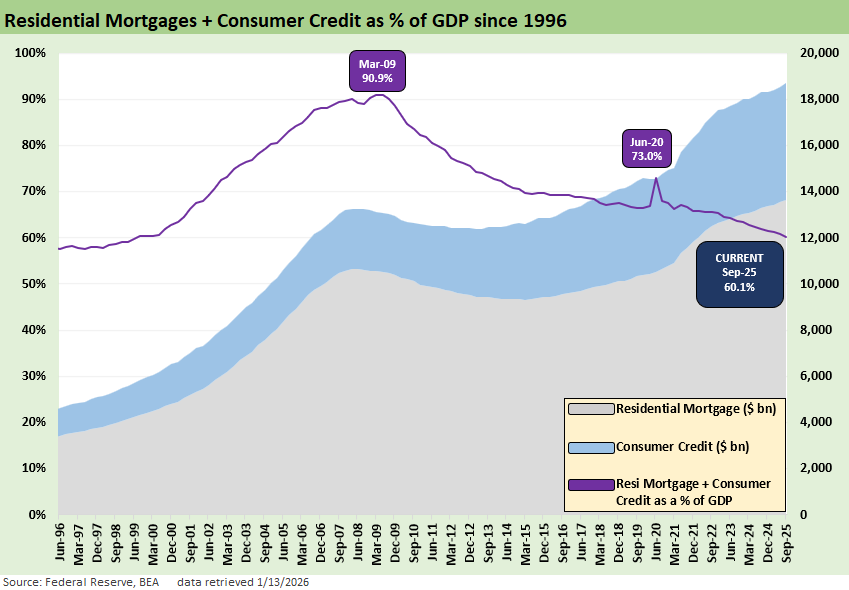
The above chart updates the composite picture for household debt in dollar terms and relative to GDP (debt % GDP). The picture tells its own story in a slow and steady growing economy where nominal debt keeps climbing and nominal income and prices keep moving higher. The mortgage + consumer credit exposure as a % GDP is down dramatically.
As an FYI, we use data from the Fed Z.1 reports. We also looked into updates from the monthly Fed G.19. Lending Tree also has very useful updates. We like using Synchrony (SYF) data as a useful pure play proxy with a very wide range of customers. SYF has customized products by subsector and developed networks such as in healthcare and home & auto among others (see Synchrony: Credit Card Bellwether 10-30-25). Synchrony will announce results on January 27. Card-heavy Capital One will release on January 22.
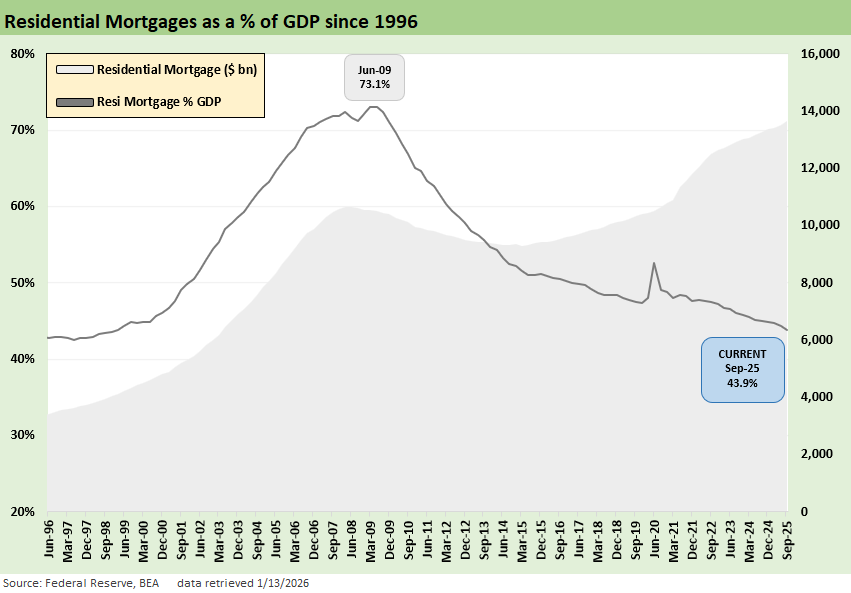
The above chart updates residential mortgage debt in dollar terms and as a % GDP. At $13.1 trillion at 3Q25 ($13.5 trillion with HELOCs), the $200 bn number for GSE buybacks is not exactly a tsunami of support even if every little bit helps. The total amounts to around 1.5% of residential mortgages outstanding.
If there is a desire to privatize the GSEs (separate topic), tapping so much liquidity is raising some questions for another day. The GSE head (age 37), despite the stellar family name in homebuilding, is not a highly seasoned mortgage professional. He got a degree in broadcast journalism in 2010, so he missed the GSE crisis and MBS meltdown.
The time series offers a flashback to the utter insanity of the RMBS boom that generated blank check refinancing with a peak of excess in 2005-2006. We saw such excess as 125% LTVs running alongside the peak homebuilding year of 2005 (see Greenspan’s Last Hurrah: His Wild Finish Before the Crisis10-30-22). Refi and purchases were both very hot lending markets.
With the recession starting in 2007 and the banks meltdown in late 2009, it all blew up with a peak system ratio of 73.1% in June 2009 at the recession trough. Regulatory waves and Dodd Frank soon kicked in, but that is a separate story.
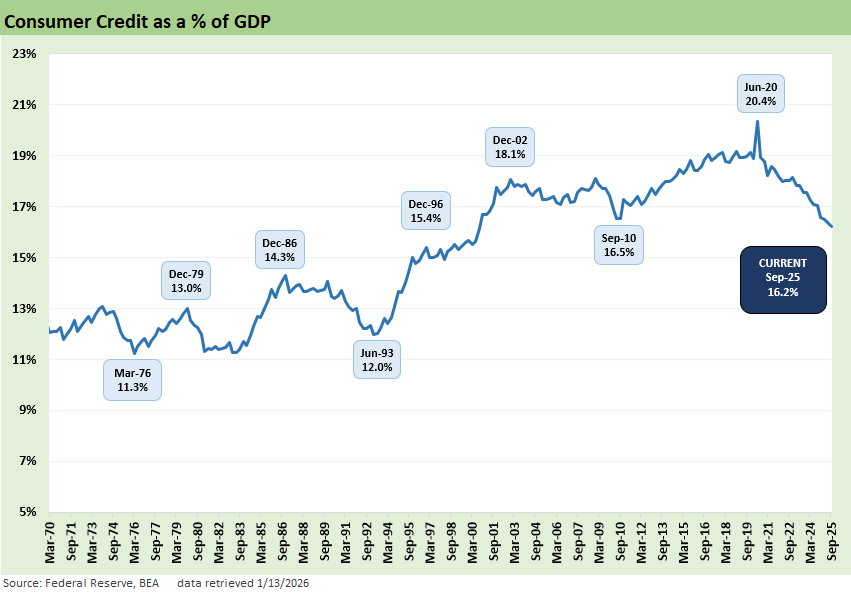
The above chart updates the Consumer Credit piece of the puzzle. The line includes Student Loans, Auto Loans, Credit Cards, and “Other.” Consumer credit remains above the historical context of the 1980s and 1990s at 16.2% for 3Q25. The ratio is down from the COVID peak where the +20.4% reflects the massively negative GDP in 2Q20 (headline 2Q20 GDP as revised at -28%, PCE at -30%, GPDI at -45%).
COVID was the last time we saw a lot of credit lime commitments cancelled in bank system liquidity fears as companies were drawing down bank line while retail cardholders also faced stress. If 2026 saw a 10% cap with daunting increases in health care premiums and an economic cycle (notably payroll trends) that remain uncertain, we could see a lot of credit lines drawn upon ahead of theoretical return to 19% area. Per the Fed, card delinquencies (90 day) at 3Q25 had been steady YoY around 7% and the same is true for auto loans just under 3%. The lower part of the K recovery is being tested in 2026.
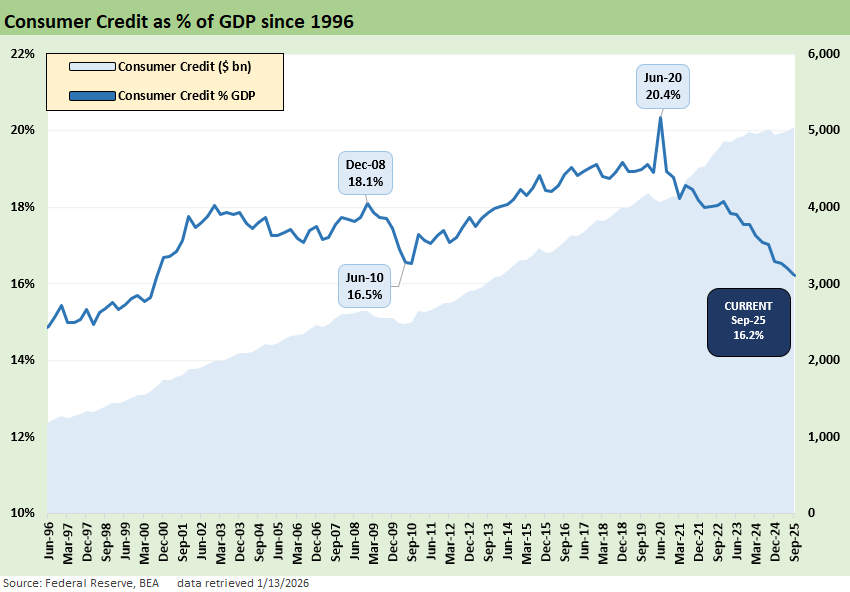
The above chart updates both the systemic level of consumer credit at 16.2% alongside the dollar level at just over $5 trillion.
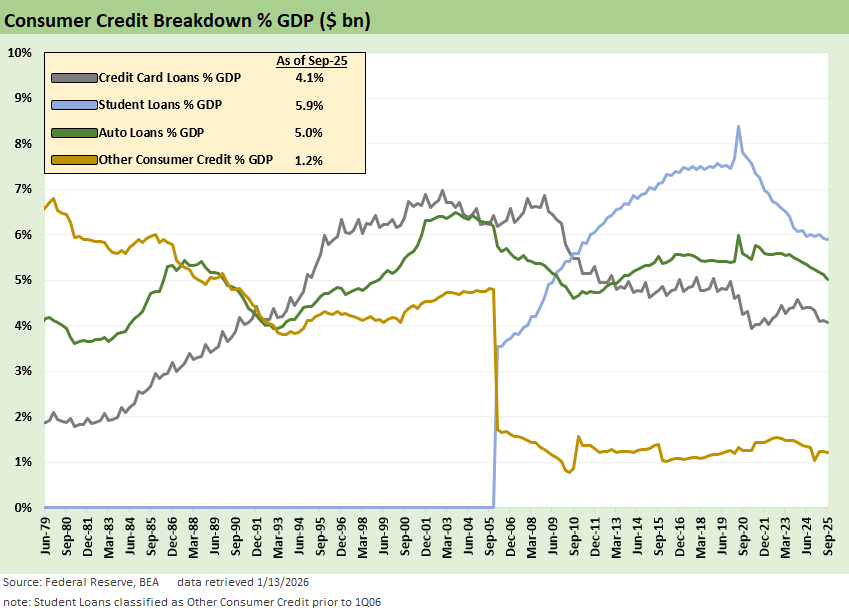
The above chart updates the moving parts of consumer debt that we had addressed in earlier commentaries on the moving parts (see Consumer Debt in Systemic Context 7-13-23):
As the charts in this commentary hammer home, the lead balance sheet item in consumer credit (ex-mortgages) right now is Student Debt. To reiterate, that line item did not even have its own category broken out until the middle of the 2000s (2006) and has now soared into the lead ahead of Auto Loans. For its part, Auto Loans had a battle with credit cards for the lead in recent decades but pulled away just over a decade ago and widened its lead over credit cards. The rising prices of new cars is no small part of that trend.
As with Residential Mortgages, the Credit Card and Auto Loan categories are easier to grasp as a systemic risk than the Student Loan bucket. Too much reckless underwriting in mortgages, auto loans, and credit cards lead to charge-offs on the books of banks and finance companies or problems in securitized products. We have had such asset quality bouts over the cycles, but the practices are much improved in the wake of the credit crisis. Goods and services get purchased and the wheels of the economic cycles go round and round. We see auto loans and credit cards as in a reasonable range in context of these past cycles.
As of 3Q25, the Z.1 posts $1.83 trillion for student loans. Auto loans have narrowed the gap since 2020 with a 28% increase while student debt is up by only +8.3%. The student loan category has grown so quickly it did not have its own category two decades ago.
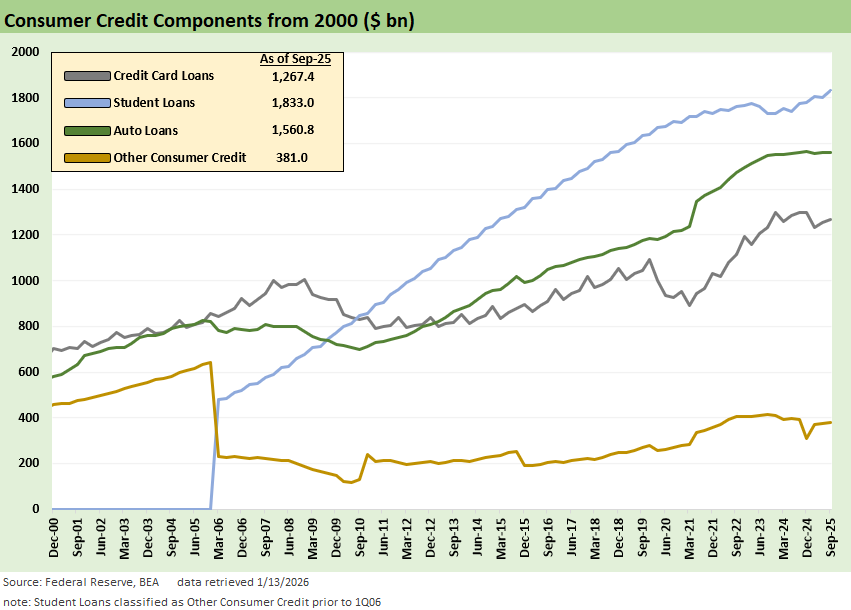
The above chart tracks the Consumer Credit components and the related trend line for dollars outstanding. We see how Student Debt “went ballistic” in the new millennium while rising car prices and changes in fleet mix also sent Auto Loans much higher.
See also:
Consumer Debt in Systemic Context 7-13-23
CPI Dec 2025: Sideways Calms Nerves – For Now 1-13-26
Payrolls Dec 2025 and FY 2025: Into the Weeds 1-10-26
JOLTS Nov 2025: Job Openings and Hires Down, Layoffs Lower 1-7-26
2025 Spread Walks and Multicycle Return Histories 1-5-26
Annual Return Differentials: HY vs. IG Across the Cycles 1-3-26
Total Return Quilt Across Asset Classes 2008-2025 1-2-26
Cyclical Histories: Will Facts Be in Vogue in 2026? 1-2-26
3Q25 GDP: Morning After Variables to Ponder 12-27-25
Durable Goods Oct25: Core Capex Still in Gear 12-23-25
Market Lookback: Last Call for Unusual Behavior 12-22-25
Existing Home Sales Nov 2025 12-21-25
November CPI: Tricky Navigation 12-18-25
 |
|