
Home Starts Dec 2025: Wrapping a Weak 2025
Dec 2025 was weaker YoY in permits and starts, and same for the calendar year. Sequential MoM higher.


Slower even if steady.
Housing has been an economic drag in the fixed investment accounts of GDP for multiple reasons from the affordability strain tied to price as well as mortgage rates hitting monthly payment levels. Residential construction has posted negative growth through 3Q25, and we will get fresh GDP lines this week for 4Q25 (see 3Q25 GDP: Updated Estimate 1-22-26)
The curve steepening since the fall 2024 easing rally has been a challenge to both homebuilding and new home sales, as well as existing home sales (see Existing Home Sales Jan 2026 2-12-26). The fiscal proposals on housing and policy jawboning has not amounted to much in substance.
Total permits and starts for Dec 2025 and calendar year 2025 are both down from 2024 but ticked up sequentially MoM for Dec 2025 vs. Nov 2025. Single family starts were down -9.0% YoY but up by +4.1% MoM. Multifamily was down by -1.0% YoY but up by +10.1% MoM.
The South region still rules at 59% of total US single family starts and 53% of total US starts. The US total of units under construction was down by -10.5% YoY and for single family down by -8.4% YoY, so the signs are not good at this point.
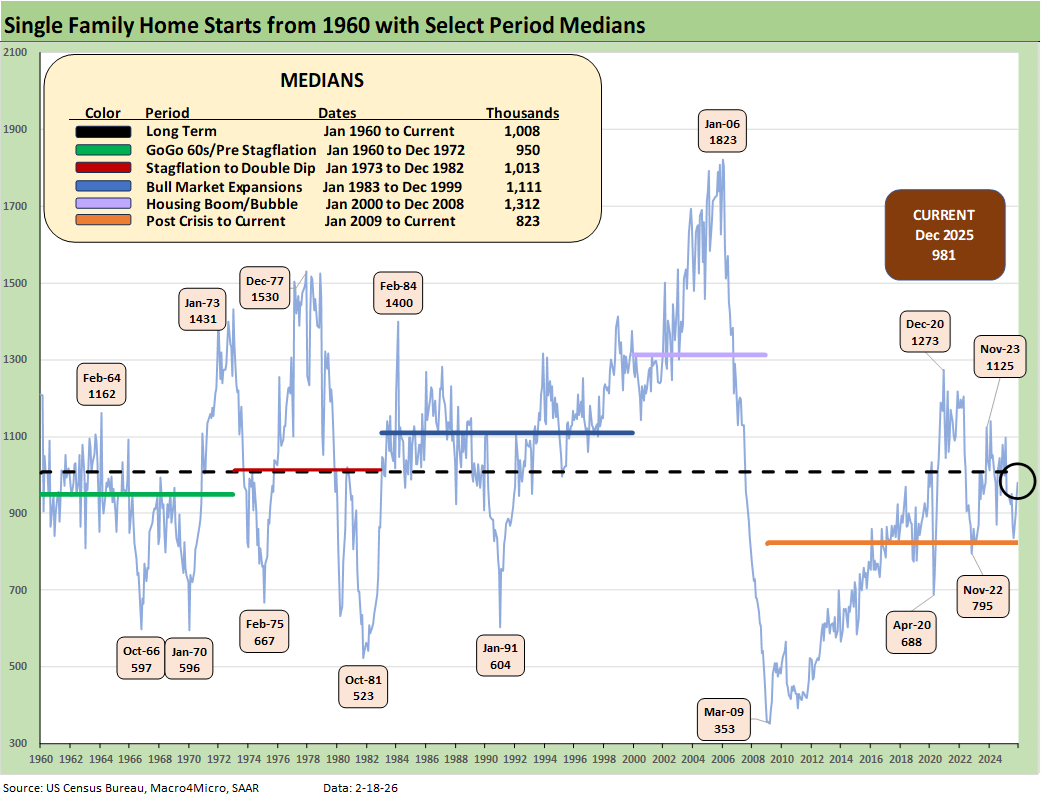
The single family home starts time series shows a wild ride across the cycles. However, the current volumes are low when considering the intrinsically high demand for housing tied to demographics.
The weakness after the COVID cycle saw prices as a major headwind given the supply-demand imbalances. The yield curve damage with 2022 tightening cycle and inflation with ensuing volatility drove a 200 bps Hi-Lo range for 30Y mortgages since the fall of 2023 through 2025.
We need to keep in mind that 100 bps of easing in late 2024 saw a major mortgage rally initially before the market saw a bear steepener unfold into 2025 (see The Curve 12-15-25). That steepening sent mortgages higher again from Sept 2024 after the 2023 mortgage peak had pulled back. The current run rates for volumes remain weak in multi-cycle context despite the recurring theme of inadequate supply for what should be exceptional demand. For now, affordability struggles trump demand.

The above chart plots total permits and total starts on a Not Seasonally Adjusted (NSA) basis. For December, we see NSA total permits higher (+3.5%) and single family permits down by -6.2%. NSA Annual Year-to-Date permits were -3.6% for total permits and a decline of -7.4% for single family permits. NSA is viewed as closer to what is going on in the trenches without the SAAR model assumptions.
For total starts and single family starts on an NSA basis, we see total starts up slightly at +1.3% MoM and single family lower by -2.2% MoM. The YTD annual 2025 NSA starts number is -0.6% for total starts and down by -6.9% for single family starts for calendar 2025.
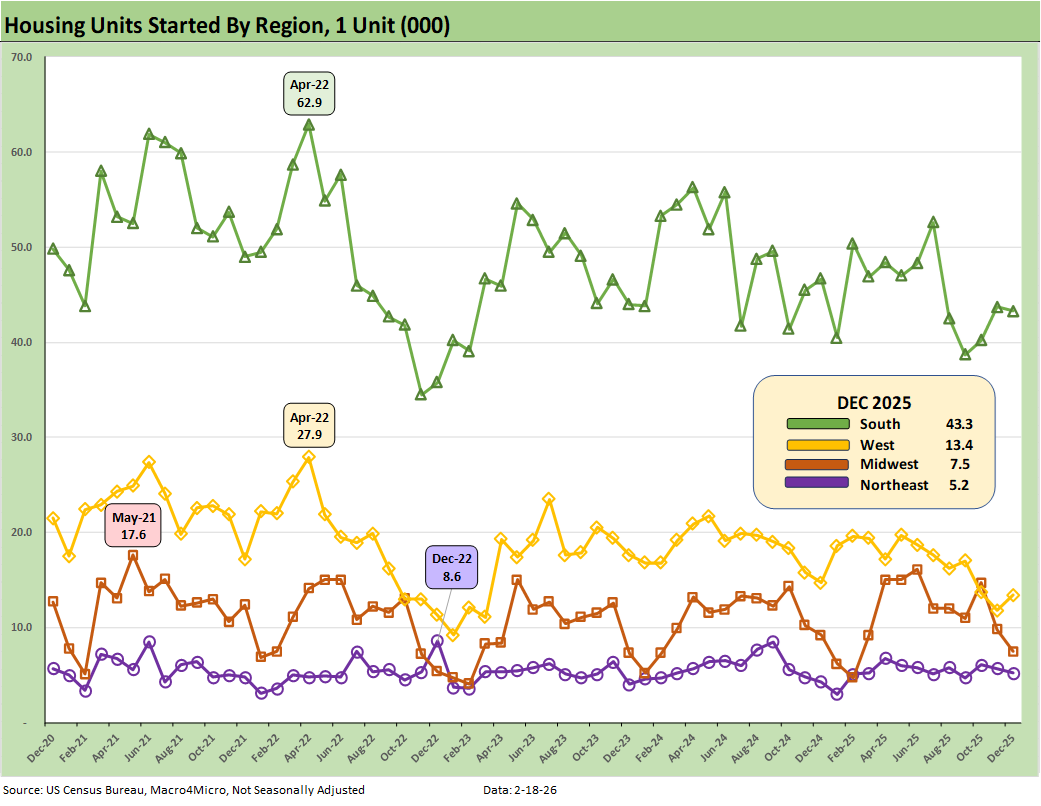
The above plots the single family starts by region on an NSA basis. The two largest regions (South and West) were split in the NSA numbers with the South slightly lower and the West higher. The Midwest moved lower as did the small Northeast market.
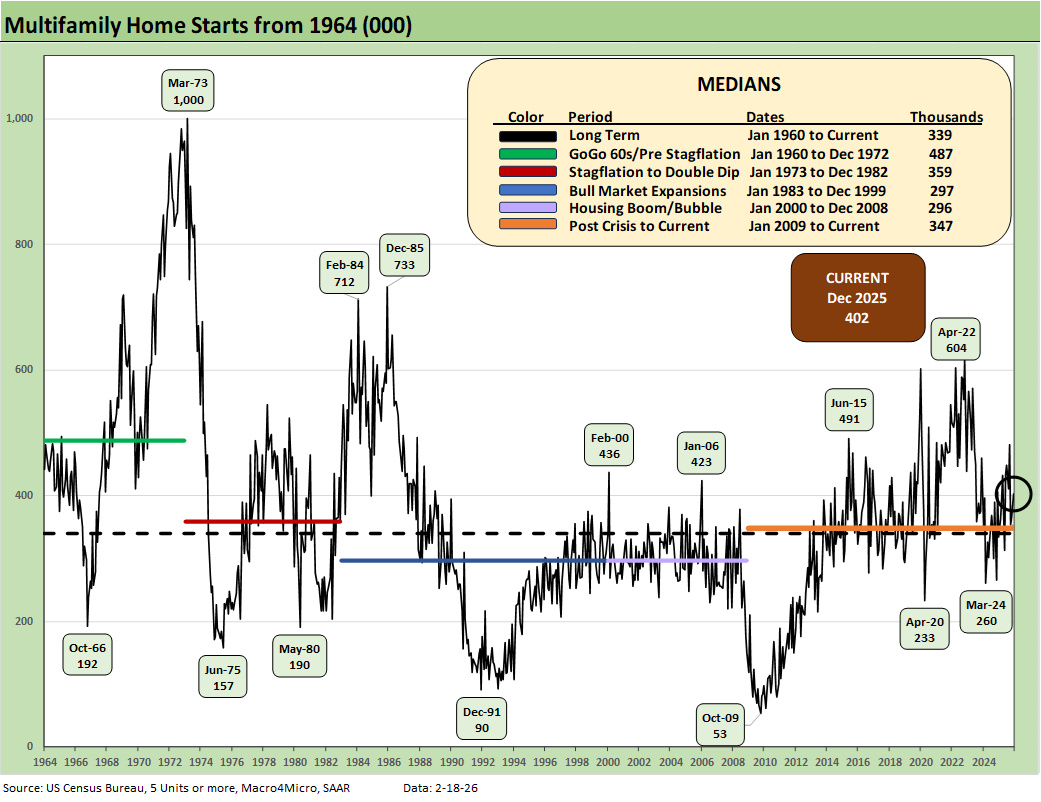
The above chart updates running multifamily starts. At +402K (SAAR), Dec 2025 rose by +10.1% sequentially and was down by -1.0% YoY. The 402K is still above the long-term median of 339K, above the median from Jan 2009 to current (347K), and above the median from 2000 to 2008 (296K). On an NSA basis (not shown), the YTD multifamily starts level is +18.0%.
The 1960s was a boom period for multifamily with the postwar explosion of urbanization and high racial migration from the south to the north.
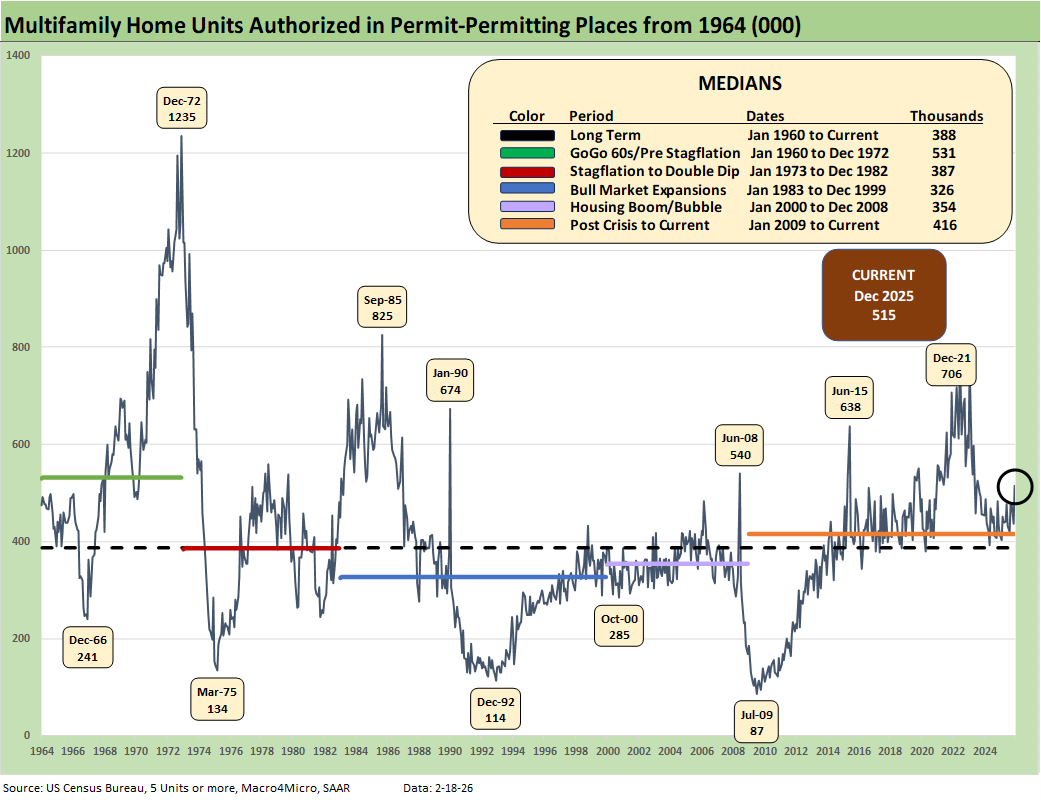
The above chart updates Multifamily permits (SAAR). The 515K in Dec 2025 rose by +18.1% MoM and increased by +18.7% YoY. The YTD calendar 2025 change on an NSA basis for multifamily permits (not shown) is +4.3%.
See also:
Market Lookback 2-17-26
Market Commentary: Asset Returns 2-16-26
CPI Jan 2026: Reassuring Numbers, Missing Pieces 2-13-26
Existing Home Sales Jan 2026 2-12-26
Payrolls Jan 2026: Into the Weeds 2-11-26
Employment Jan 2026: Good Headline, So-So Mix 2-11-26
Retail Sales Dec 2025: Muted Year-End 2-11-26
Market Lookback: Monkey Business 2-9-26
Market Commentary: Asset Returns 2-8-26
Switzerland-US Trade: A Deficit that Glitters 2-3-26
US-Taiwan Trade: Risks Behind the Curtain 2-1-26
Trade Deficits: Math Challenge 1-30-26
China Trade: Shrinkage Report 1-28-26
Mexico Trade: Gearing up for More Trade Trouble? 1-27-26
Canada-US Trade: Trump Attack N+1 1-25-26
PCE Income & Outlays Nov 2025: Resilient Consumer, Higher Inflation 1-24-26
3Q25 GDP: Updated Estimate 1-22-26
Industrial Production Dec 2025: CapUte Resilience 1-17-26
Policy Mud on the Wall: Consumer Debt, Residential Mortgages 1-15-26
2025 Spread Walks and Multicycle Return Histories 1-5-26
Annual Return Differentials: HY vs. IG Across the Cycles 1-3-26
Total Return Quilt Across Asset Classes 2008-2025 1-2-26