
Fun Facts: State of the Union Prep Kit
We make a few obvious and simple - but seldom admitted – economic points ahead of the State of the Union.


Protracted tariff wars can heighten emotion and impair judgement.
With the State of the Union Address teed up for tonight, we thought some warm-up facts might be in order. We don’t expect Trump to admit to any of them.
Annual GDP growth was lower in 2025 vs. 2024, annual personal consumption expenditure growth was lower in 2025 vs. 2024, and fixed investment growth was lower in 2025 vs. 2024. That could change in 2026, but the facts of 2025 are on the books.
Annual GDP growth in 2025 was well below 2024 but also well below the long-term median from 1976 of 2.8%. The Golden Years must be in transit.
Headline and Core PCE inflation are currently above the median posted from 1972 and also above the median from 1997. Prices are not “way down” (they are higher) since inflation is positive. PCE inflation is up – not down.
The US benchmark indexes as packaged in various ETFs have underperformed Europe and Canada on an LTM basis and only recently caught up to China. For those diversifying their sovereign exposures in equities, currency was a key swing factor against the US for the relevant ETF returns.
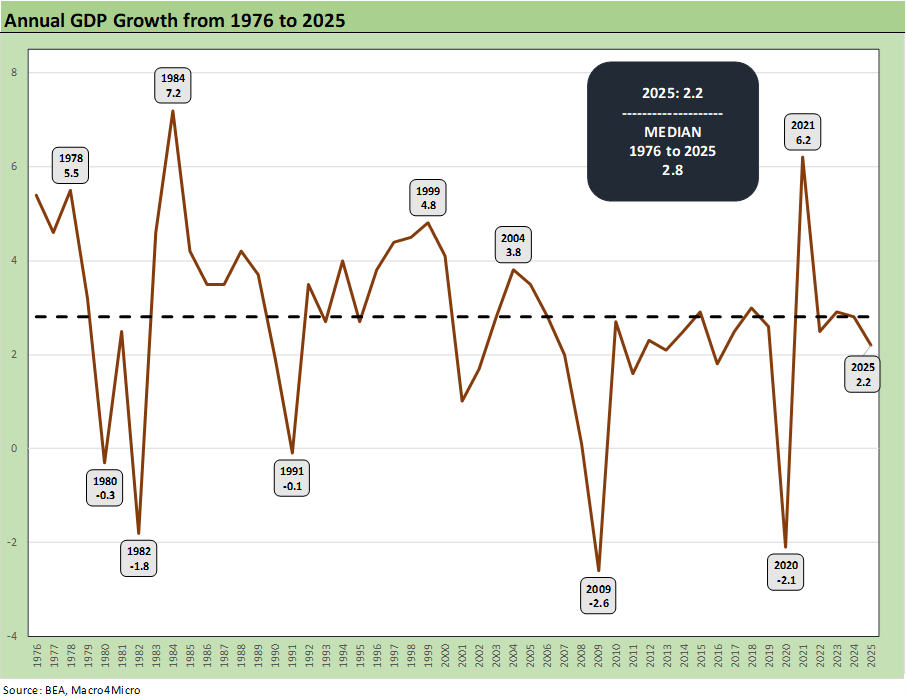
Slower annual GDP growth in 2025 (+2.2% for “annual to annual”) vs. 2024 (+2.8%) is now on the books while higher Headline PCE inflation and Core PCE inflation (the metric the FOMC cares about) are the facts as of now. The 2.2% annual GDP growth is below the annual GDP growth median posted since 1976 of 2.8% as noted. The GDP accounts show headline GDP growth down, PCE growth down, and fixed investment growth down (see 4Q25 GDP (Advance Est.): Less Distortion This Time 2-20-26).
To add insult to injury, the GDP growth in 2025 is below 3 of the 4 years under Jimmy Carter (4.6% in 1977, 5.5% 1978, and 3.2% in 1979). Trump might learn from Carter’s mistakes. The Iran crisis of 1979 sent inflation soaring. Iran has 90 million people and is led by religious fanatics who are not always cooperative or easily intimidated. The geopolitical talking heads and military types have been highlighting a raft of risks from the Strait of Hormuz to the uncertain capabilities of Iran’s missile program. One way or the other, an armed conflict with Iran on any scale will be costly and generate other unpredictable risks.
Sharply lower 4Q25 GDP (+1.4%) vs. 3Q25 (4.4%) is also a recent data point. That 3Q25 GDP number came with some asterisks of material distortion as we also saw in 1Q25 and 2Q25 with swings in trade deficits and inventory (see 1Q25 GDP Advance Estimate: Roll Your Own Distortions 4-30-25, 2Q25 GDP Final Estimate: Big Upward Revision 9-25-25, 3Q25 GDP: Morning After Variables to Ponder 12-27-25).
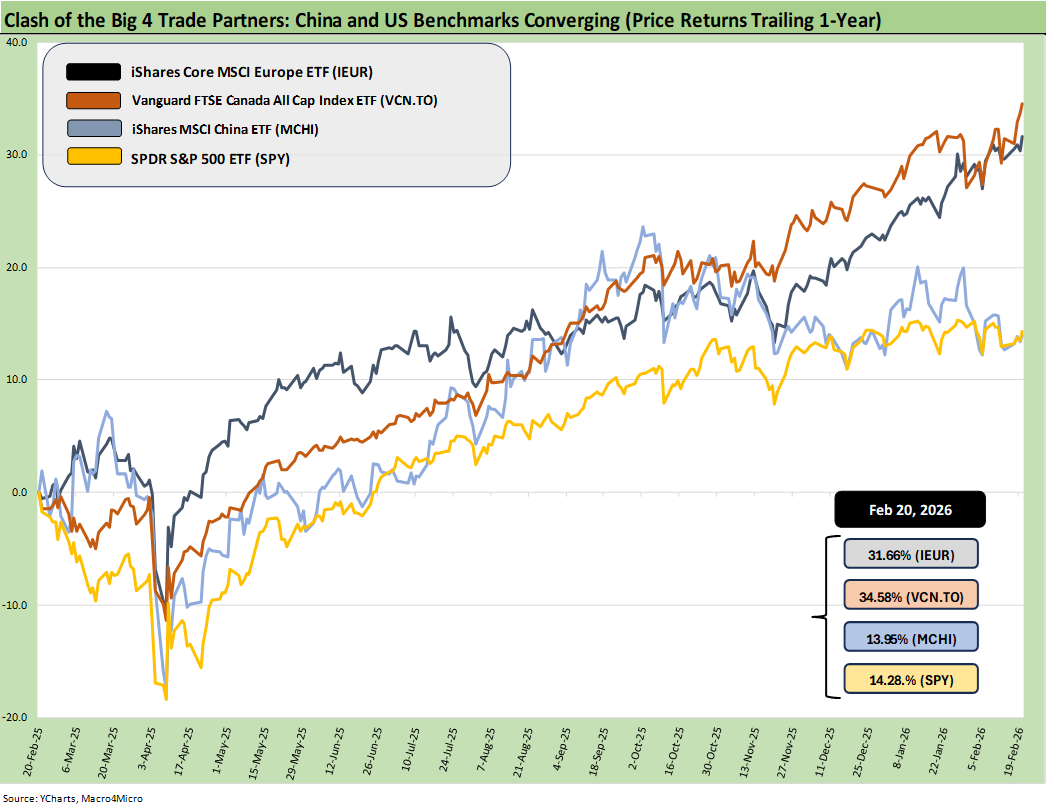
The above chart frames the total returns of some benchmark ETFs that detail the performance of the trade partners highlighted above (Europe, Canada, China). The returns include currency effects, which has been a drag on US performance. The US finally edged ahead of China the past week after spending months at #4.
While the US and numerous markets have performed well, the returns above do not signal “hottest country in the world” based on what returns have been generated on $1 invested a year ago. The US was #4 in this group during calendar 2025. Perhaps “Hottest” means “most divided and politically dysfunctional by design.” Perhaps “Hottest” means like Chernobyl.
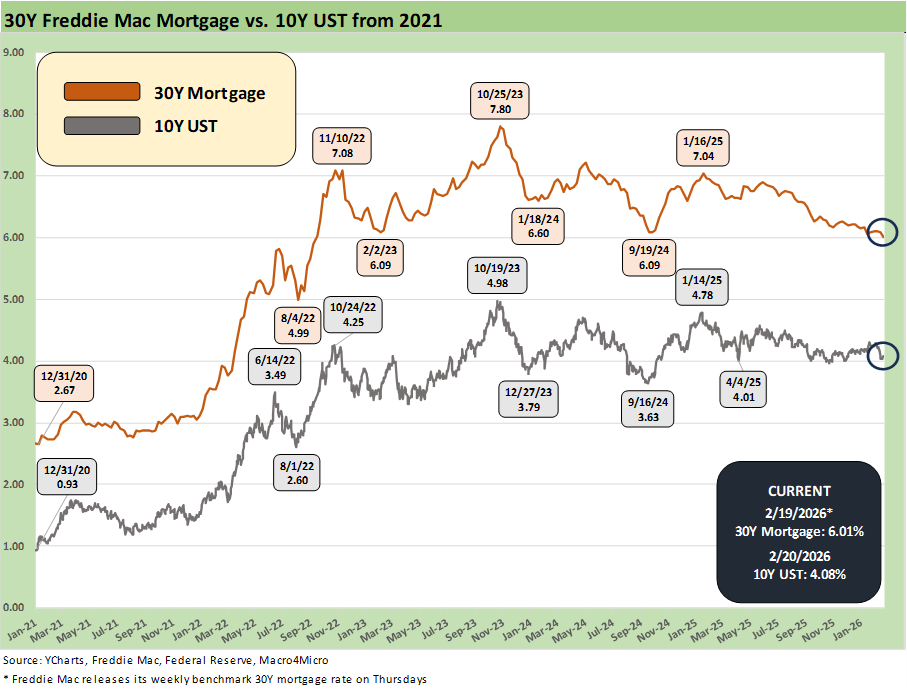
The above chart frames the ride of the 10Y UST and Freddie Mac 30Y mortgage from the ZIRP year of 2021 through Friday close. The news has been very good in relative terms for mortgages since the late 2023 mortgage peak of 7.8%. The 2022 tightening cycle took effect on inflation and the curve without triggering a recession. The 7.0% handle mortgages to start 2025 are now close to 6.0% and the 10Y UST is down near the low 4% area.
The reality is that the longer end of the UST curve has been stubborn after the initial FOMC easing of Sept 2024, when the 10Y UST hit 3.6% and 30Y mortgage rates were close to 6.0%. During 2025, the tariff wave and record budget deficits have kept the 10Y UST range-bound and mortgages closer to 6.0%.
The rising inflation seen this past week (Trump will say it is lower) needs better news ahead to increase curve optimism with respect to short end easing– let alone long end flattening. Any new spike in military costs and worsening relationships with “former” allies (EU, Canada) will not help the demand side. Tension with China is also a wildcard. The IEEPA rejection by SCOTUS raises the risks of trade conflict with Europe (EU, UK) and also with Canada and Mexico in the USMCA review.
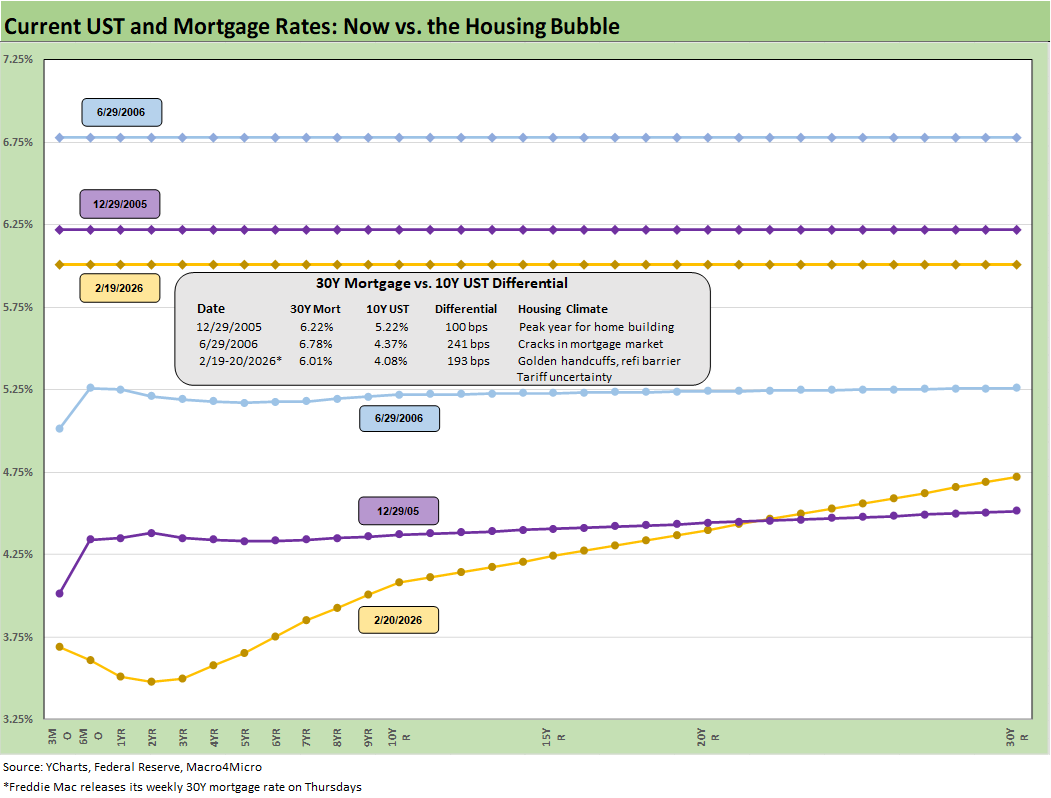
The above chart is the latest reminder on where the UST curve and Freddie Mac mortgage rates stand relative to the wild days of the housing sector bubble (2005 peak homebuilding year), RMBS and counterparty catastrophe (ticking in later 2006), and ensuing bank systemic crisis. The market of 2026 has very little in common with that period, but the chart makes a statement on absolute rates. Mortgage rates are lower now and the UST curve steeper, much lower in the front end, and lower in 10Y UST.
If Trump hammers Powell tonight for the housing drag, he might want to check these rates vs. the booming financing of the markets with much higher rates. The housing story is not about Powell. That is a topic for another day.
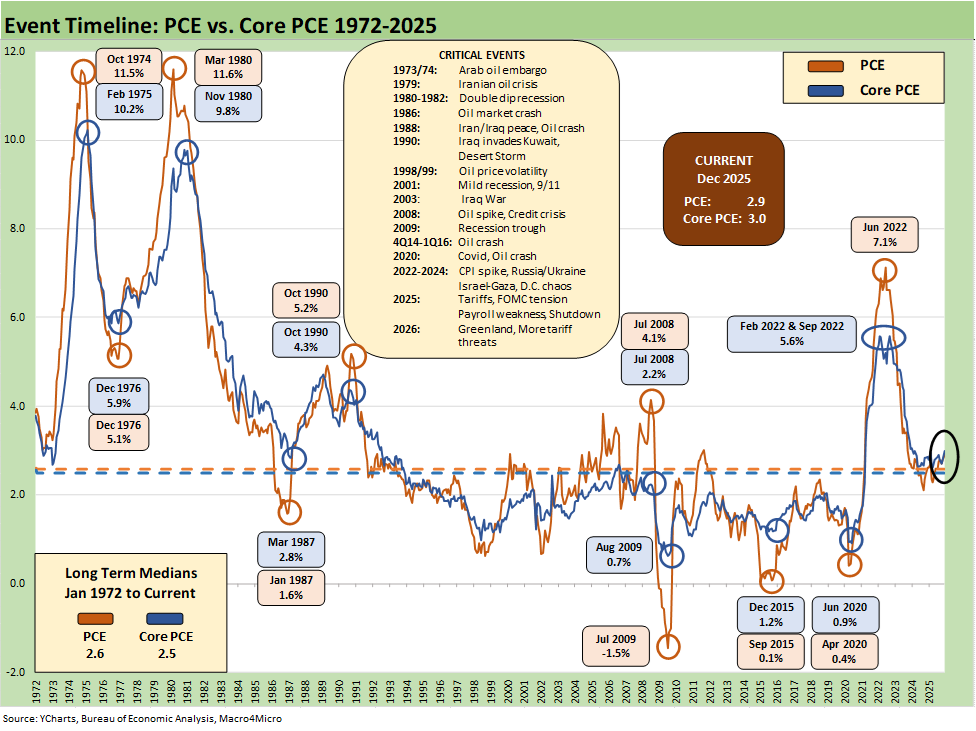
The above chart is one of those memory lane moments across the cycles. The message is inflation is higher today vs. history as we saw in the PCE inflation release of Friday (see PCE Income & Outlays Dec 2025: Inflation Reversal? 2-20-26). Those medians noted in the box on the lower left (2.6% headline, 2.5% core) are part of a crazy Hi-Lo range of interest rates and inflation of years gone by whether PCE or CPI (see CPI Jan 2026: Reassuring Numbers, Missing Pieces 2-13-26).
We highlight the median headline PCE from 1972 of 2.6% and the median Core PCE of 2.5%. Those are both lower than what we have as of Dec 2025. When Trump says in the State of the Union address that prices are “way down,” he might fail to cite the definitional fact that +2.9% PCE inflation and +3.0% Core PCE inflation are positive numbers. That means prices are higher in aggregate. It is amazing (and embarrassingly shameful) that the talking media heads let that slide. As highlighted in the chart, periods of deflation (mid 2009) are not times you want to revisit.
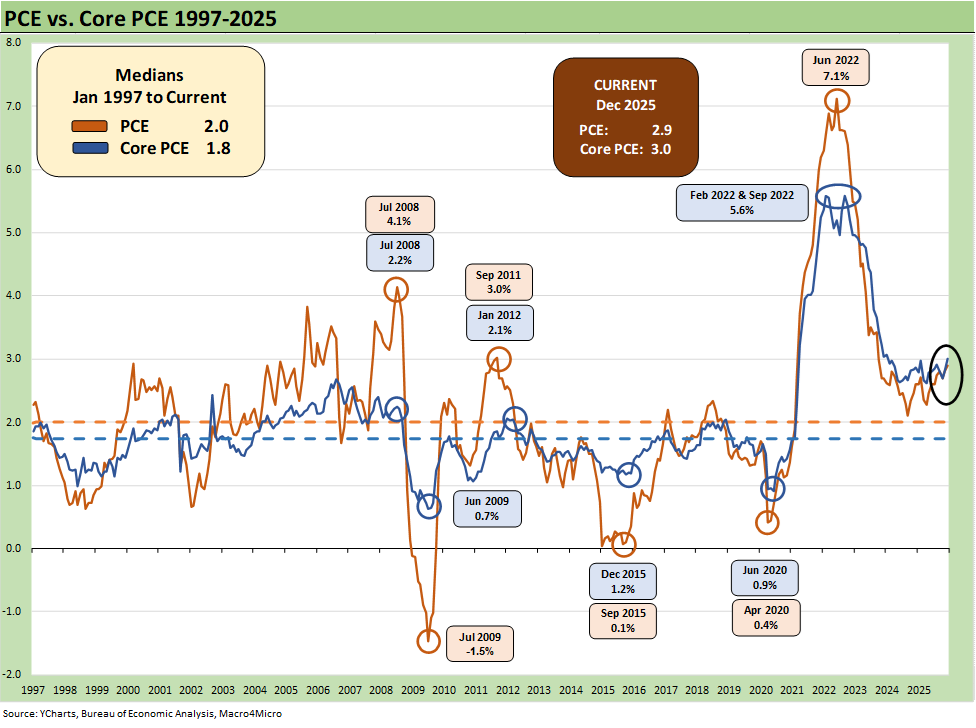
As of Dec 2025, the headline PCE of 2.9% is above the median from 1997 of 2.0%. The Core PCE of 3.0% is also above the 1.8% median. The PCE inflation metrics remain well above the target of 2.0%.
When Trump says prices are “way down” or that he has zero inflation in his SOTU address, substitute the term “well above median inflation since 1997.” That is factually accurate. The same for the median from 1972 as noted above.
Current inflation is a far cry from the brutal spike of 2022. The 2021-2022 periods saw a lot that went wrong in major areas both outside and inside of Biden’s control. We are still waiting for Trump to mention the energy spike and invasion of Ukraine 4 years ago (this week) in 2022 as a contributor to the inflation spike.
Putin was most certainly a major cause of inflation even if Trump never cites the invasion as a factor. Anyone who studied or lived through (or both) the 1973-1975 contraction and the 1980-1982 double dip recessions with the bouts of stagflation know how important oil prices were in those periods of economic torture. Putin was a big part of 2022.
We would also highlight that by the time Trump took office in Jan 2025, inflation had already been beaten back significantly by Powell and the FOMC. Current PCE inflation is now above where we were at the end of 2024.
See also:
Market Commentary: Asset Returns 2-23-26
New Home Sales Dec 2025: Fresh Game Clock 2-21-26
PCE Income & Outlays Dec 2025: Inflation Reversal? 2-20-26
4Q25 GDP (Advance Est.): Less Distortion This Time 2-20-26
2025 trade Deficits: Reality vs. Rhetoric 2-19-26
Industrial Production Jan 2026: Capacity Utilization Trends 2-19-26
Home Starts Dec 2025: Wrapping a Weak 2025 2-18-26
Market Lookback 2-17-26
CPI Jan 2026: Reassuring Numbers, Missing Pieces 2-13-26
Existing Home Sales Jan 2026 2-12-26
Payrolls Jan 2026: Into the Weeds 2-11-26
Employment Jan 2026: Good Headline, So-So Mix 2-11-26
Retail Sales Dec 2025: Muted Year-End 2-11-26
Market Lookback: Monkey Business 2-9-26
Switzerland-US Trade: A Deficit that Glitters 2-3-26
US-Taiwan Trade: Risks Behind the Curtain 2-1-26
Trade Deficits: Math Challenge 1-30-26
China Trade: Shrinkage Report 1-28-26
Mexico Trade: Gearing up for More Trade Trouble? 1-27-26
Canada-US Trade: Trump Attack N+1 1-25-26
Policy Mud on the Wall: Consumer Debt, Residential Mortgages 1-15-26
2025 Spread Walks and Multicycle Return Histories 1-5-26
Annual Return Differentials: HY vs. IG Across the Cycles 1-3-26