
Market Commentary: Asset Returns 3-1-26
The Iran “event” opens up an otherworldly range of potential outcomes, and the restraints just got taken off for all parties.


One big happy family.
The 4 broad benchmarks (S&P 500, NASDAQ, Russell 2000, S&P 400 Midcap) as well as the Dow were all negative even before Iran. We at least saw some of the SaaS-centric business services companies rebounding as the AI fear contagion eased. AI anxiety got back in touch with pragmatic timing realities and as management teams engage in some pushback. The tech and SaaS equity return story is still ugly for the trailing 1-month as we detail below.
The results during the week were set against the backdrop of a likely Iran attack, and that “likely” became a larger scale reality during the post-midnight, early morning hours of Saturday. The joint attack by the US and Israel on such a scale gave the event even more significance in the Mideast political dynamic.
The past week saw a rambling SOTU filled with many false statements on factual economic indicators that were easy to anticipate (see Fun Facts: State of the Union Prep Kit 2-24-26). That said, the UST curve saw a rally with the 10Y UST under 4% and Freddie Mac 30Y mortgages dipping slightly below 6.0% line to 5.98% (6.76% 1 year ago). We get BLS payrolls and ADP data this coming week for another FOMC check with the Fed now needing to factor in the Iran variables.
The UST curve looked past a hot PPI release. We also saw confirmation that the “value of construction put in place” declined in 2025 after 4 years of increases in what was another “not the greatest economy” moment. That might surprise some with the constant data center headlines.
The Iran story will dominate for a while as oil reacts and inflation expectations move around with consumer moods and corporate sector cyclical reassessment. We already see attacks on oil tankers overnight, and that will stoke up inflation (or “one-time event”) chatter. The direction of volumes with major trading partners on the back of new tariffs and the USMCA review will be challenging enough.
If one believes that the US has not been directly targeted by Iran and proxies in recent years for asymmetric action (i.e. terrorist acts) and the reluctance was based on a desire to avoid getting bombed into the stone age by Trump, that restraint was just erased. As someone (among many) who lived across the street from the Twin Towers on 9/11, more than a few people will be thinking this latest sequence opens up many more scenarios to be nervous about with the lid off. It is not just in the movies.
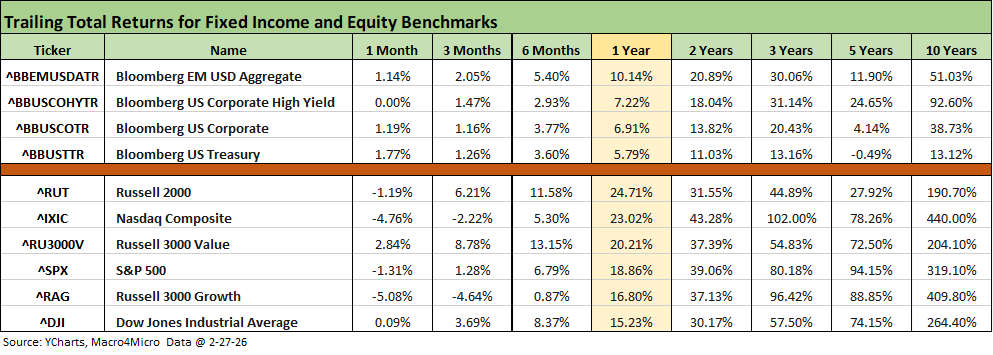
The above table updates the time horizon returns for the debt and equity asset classes we monitor each week. The UST curve had some good news this week while we see spreads going wider in credit. IG was +7 bps on the week and +12 bps for the trailing 1-month. HY was +12 bps on Friday, +24 bps for the week, and +38 bps for the trailing 1-month.
The real struggle has been over in equities as covered in various other commentaries as tech valuation optimism had already given way to the usual “too far, too fast” discussion. We also now give way to the questions of, “Which business models will be most damaged by AI?” That has in turn hit some very profitable and highly valued SaaS-centric business models.
AI vs. legacy business services: the new wall of worry?
The software and semiconductor equity setbacks are a big slice of the worry, but the business services themes have been especially neurotic. The idea is that revenue models will get tossed out the window in a sea of volume pressure and loss of pricing power. Lower margins and slower growth should and would hit multiples and undermine valuation (so the theory goes). That puts pressure on management teams to push back on that theory. The assumption is that there is a wide range of industrial structural issues including IP rights, copyrights, trademarks, etc., to protect the core business. They need to make the case or face the pressure.
While every bear scenario has to be intelligently addressed and weighed, it reminded us of the theme that Amazon would put all the auto retailers out of business. At the time, we noted the numbers of service and repair bays, auto diagnosticians, and parking space for Amazon appears a bit low. In real estate, the Zillow crash is in part tied to its data and SaaS-centric operations, but almost 90% of homebuyers use an agent. You can debate fees and margins across that services chain, etc,. but “bodies” play a role. That said, Zillow equity is still struggling while numerous other services subsectors rallied on the week (discussed below).
The rolling return visual
In the next section, we get into the details of the 32 ETFs and benchmarks for a mix of trailing periods. Below we offer a condensed 4-chart view for an easy visual on how the mix of positive vs. negative returns shape up. We see it as a useful exercise in looking for signals across industry groups and asset classes.
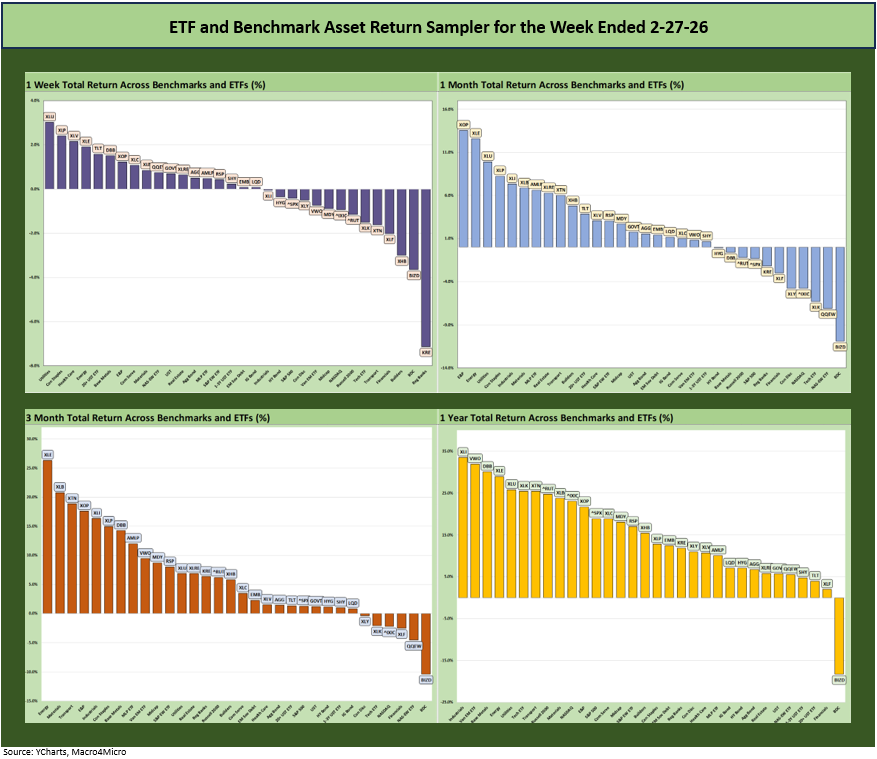
The positive vs. negative symmetry has been breaking down in recent weeks on equity weakness with the UST curve finally moving slightly below what has been a rangebound period. We address those timeline returns in comments below.
The Magnificent 7 heavy ETFs…
Some of the benchmarks and industry ETFs we include have issuer concentration elements that leave them wagged by a few names. When looking across some of the bellwether industry and subsector ETFs in the rankings, it is good to keep in mind which narrow ETFs (vs. broad market benchmarks) get wagged more by the “Magnificent 7” including Consumer Discretionary (XLY) with Amazon and Tesla, Tech (XLK) with Microsoft, Apple, and NVIDIA, and Communications Services (XLC) with Alphabet and Meta.
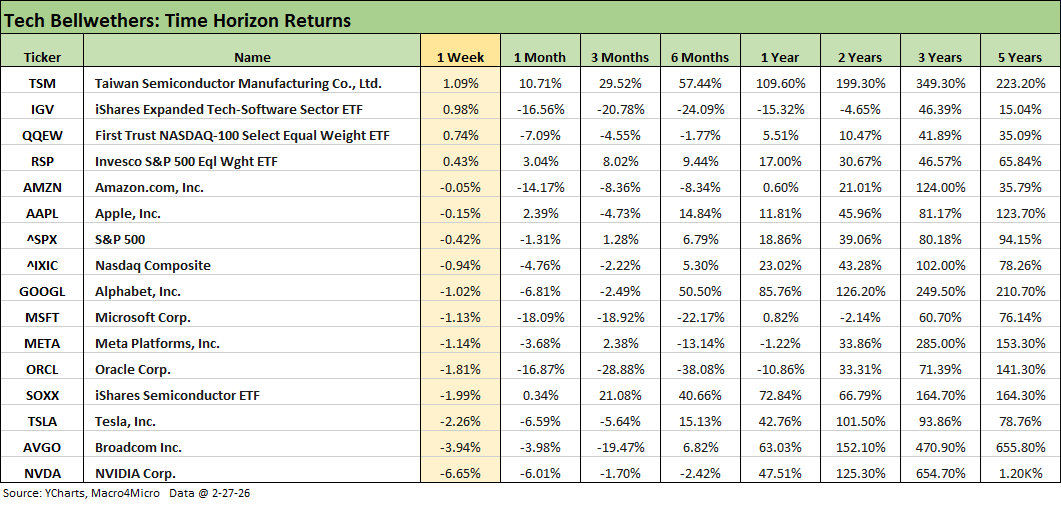
We added a few new lines to the tech bellwether table this week beyond the “Mag 7+3” (the 3 = TSM, AVGO, ORCL). We dropped in the Software ETF (IGV) and Semiconductor ETF (SOXX) given the multi-sector disarray in tech in recent periods. We also break those out in the timeline return charts we started a few weeks ago under the heading of “Tech Check” (see charts below).
The table above shows the entire Mag 7 in the red for the week. The Mag 7 names were joined in negative range by Broadcom and Oracle with only Taiwan Semi positive at #1. Taiwan the nation as well as TSM as a company have been having a very good time on pumped up US demand (see US-Taiwan Trade: Risks Behind the Curtain 2-1-26).
Looking back over the trailing 1-month is not pretty with only 4 of the lines in positive range. If we exclude the Equal Weight S&P ETF (RSP), the only positive returns were TSM on top with Apple a distant second and the Semiconductor ETF (SOXX) barely positive.
For the 1-month period, the Software ETF (IGV) at -16.6% makes a statement, and the same for MSFT (-18.1%), Oracle (-16.9%), and Amazon (-14.2%). The S&P 500 weighed in at -1.3% for the month.
The below is mostly a cut and paste from a post on our LinkedIn this weekend. We added some edits and tweaks:
The week’s market action and macro developments seem like very old news at this point when the post-midnight hours brought headlines of a major Congress-free war unfolding with Iran, a nation of 90 million people led by religious fanatics who see America as the Great Satan.
The Iran whiteboard game plan of regime change with no boots on the ground may not work out as planned. Beyond retaliation against neighbors and US assets in the region, we already see attacked on tankers and insurance getting repriced or yanked. The market awaits official market price action to show up the screens in the early evening tonight. The supply handicapping and war and escalation premiums will make life interesting for those in the energy CPI and PCE handicapping business.
The hours and days ahead will see plenty of speculation on how oil will react to potential supply shocks, and more guesswork will continue on the geopolitical premium needed. We already have seen a range of $10 to $20 per barrel price hike ballparking on the screen with news of ship insurance getting pulled or premiums spiking for the Strait of Hormuz. We have seen a few $100 oil headline grabbers, but the moving parts are anything but clear or easily handicapped. The “Strait of Hormuz” is everyone’s favorite panic button scenarios and now it will get put to the test.
There is the question of how OPEC+ will react to stabilize supply, but much of that oil moves through that strait. There will also be the handicapping of what it all means for the economics of drilling in the US. The economics will certainly improve. This also could be Russia’s lucky day in seeing more markets reopen despite Ukraine.
We highlight that the US picking a fight with Canada in the USMCA review process and threatening them with more tariffs does not show up on the short list of “smart policy” with Canada the#1 importer of oil into the US. Canada also might see this as a good time to get some commitments from China for capital investment in their energy resources. China has just seen two its major suppliers implode (Iran, Venezuela) and saw some major setbacks in Panama. Life could get tense with China from here. The Strait of Hormuz is also very important to LNG and major export markets.
Monday will bring direct market feedback on the direction of oil prices and the side effects on the energy sector, raw material costs, and how the geopolitical chaos will flow into consumer confidence, earnings, and capex expectations.
Positive vs. negative scoresheet…
The group of 32 benchmarks and ETFs shows a positive vs. negative score of 18-14 with 6 of 7 bond ETFs in positive range with the notable exception of HY (HYG). The HY Index saw spreads move +12 wider on Friday, +24 bps wider on the week, and +38 bps wider on the trailing 1-month. HY OAS broke outside the June 2007 bubble band and ended at +310 bps. That negative excess return stretch of around -88 bps MTD as of Friday could be part of a risk repricing that lasts.
Geopolitical scenarios and asymmetric event risk fears could get spun up over the near term and flow into more risk aversion in the markets. The scenarios could impact decision making at the corporate level and consumers at the spending level. The tariff questions are bad enough and the same is true for the upcoming USMCA review.
There are more than a few scenarios for inflation to go higher and payroll actions to get more defensive. The recurring story of oil is that it can obviously hit gasoline/fuels, raw materials (petrochemicals), and freight and logistics costs (and thus delivery of food and goods). Shipping in the Suez could be a flash point again as well. Lebanon and Gaza interests “on the other side” will be an open question also as Iran allies react.
The below is mostly a cut and paste from a post on our LinkedIn this weekend. We added some edits and tweaks:
The tech volatility calmed down somewhat this past week in terms of the SaaS-centric business services sell-off, but banner earnings from NVIDIA did not calm the valuation nerves in AI and the related family tree of tech subsectors.
The chart updates our weekly return details on a range of tech names and tech ETFs. We added 4 more tech-based services names to the group we track (now 28 asset lines). We added FactSet (FDS), Intuit (INTU), Salesforce (CRM), and Zillow (Z) to the chart as good bellwether names with lead positions in their disciplines. I routinely use or have been exposed to all four of them, so they were easy choices to relate to.
As the headlines have blared there was a broad-based beatdown of numerous services operators over the past month on the basis that AI would be a solution for numerous disciplines (data broadly, finance, tax, law, housing information/brokerage, etc.). Under that scenario, volume growth and pricing power would get shredded by AI services and in some cases companies would be obsolete. This week we saw FactSet rebound with Intuit and Salesforce, but Zillow remained negative.
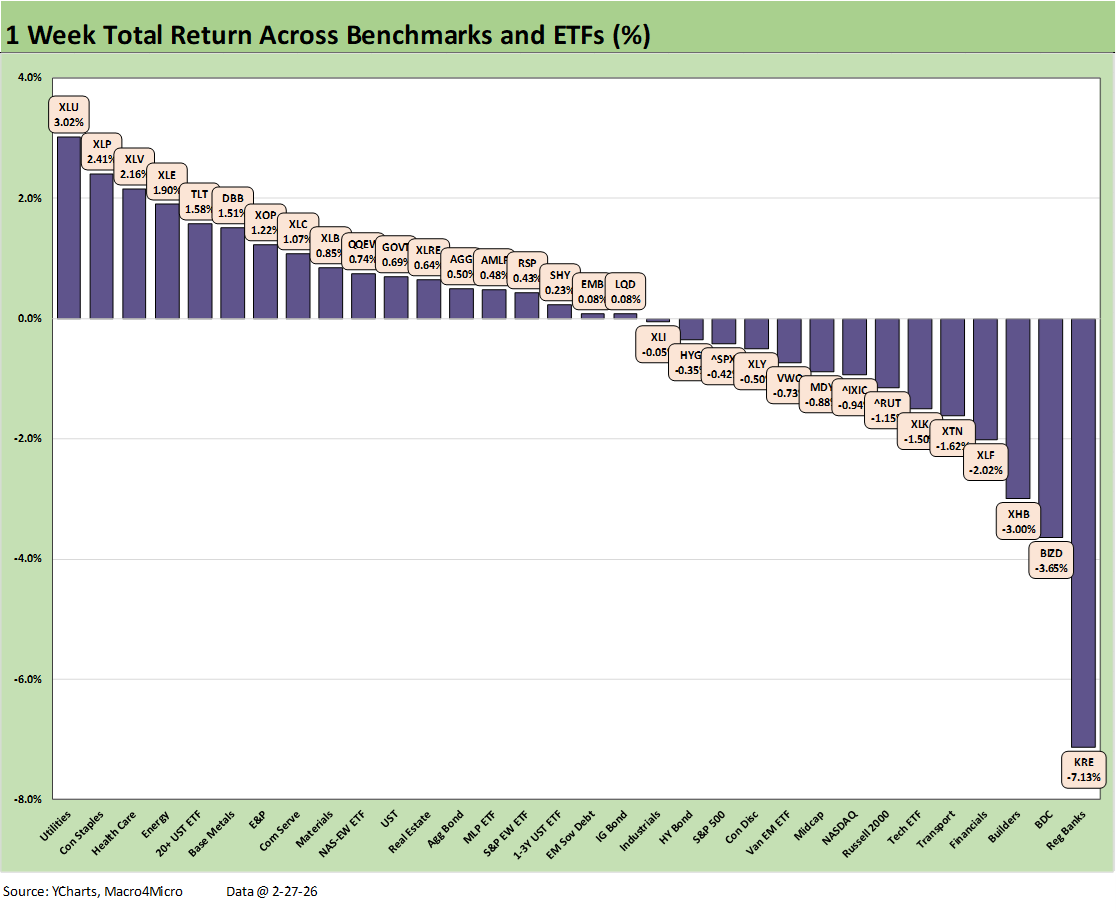
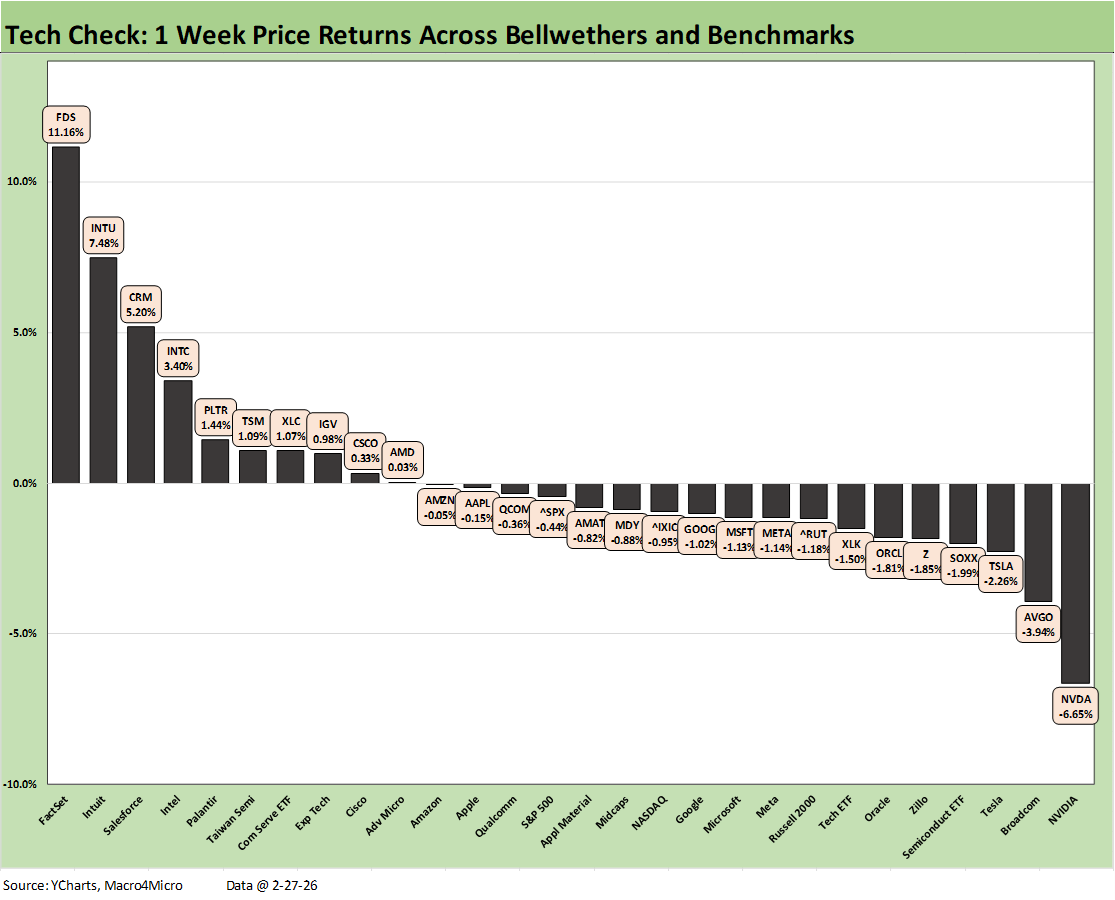
The 1-week chart weighs in at 10-18 for the positive vs. negative score. We see all the Mag 7 names in the red with only Taiwan Semi positive among the Mag 7+3 (Mag 7+TSM+AVGO+ORCL). We see all 4 broad index benchmarks in the red also across the S&P 500, NASDAQ, Midcaps (MDY), and Russell 2000 (RUT) small caps.
Among ETFs, we see Communications Services (XLC) in positive range and the Software ETF (IGV) got back into positive after being negative last week and -16.6% over the trailing 1-month. The Tech ETF (XLK) is still negative as is the Semi ETF (SOXX). We include the Equal Weight NASDAQ 100 ETF (QQEW) in a separate broad peer group (not shown above), and QQEW was sitting in the red again this week also.
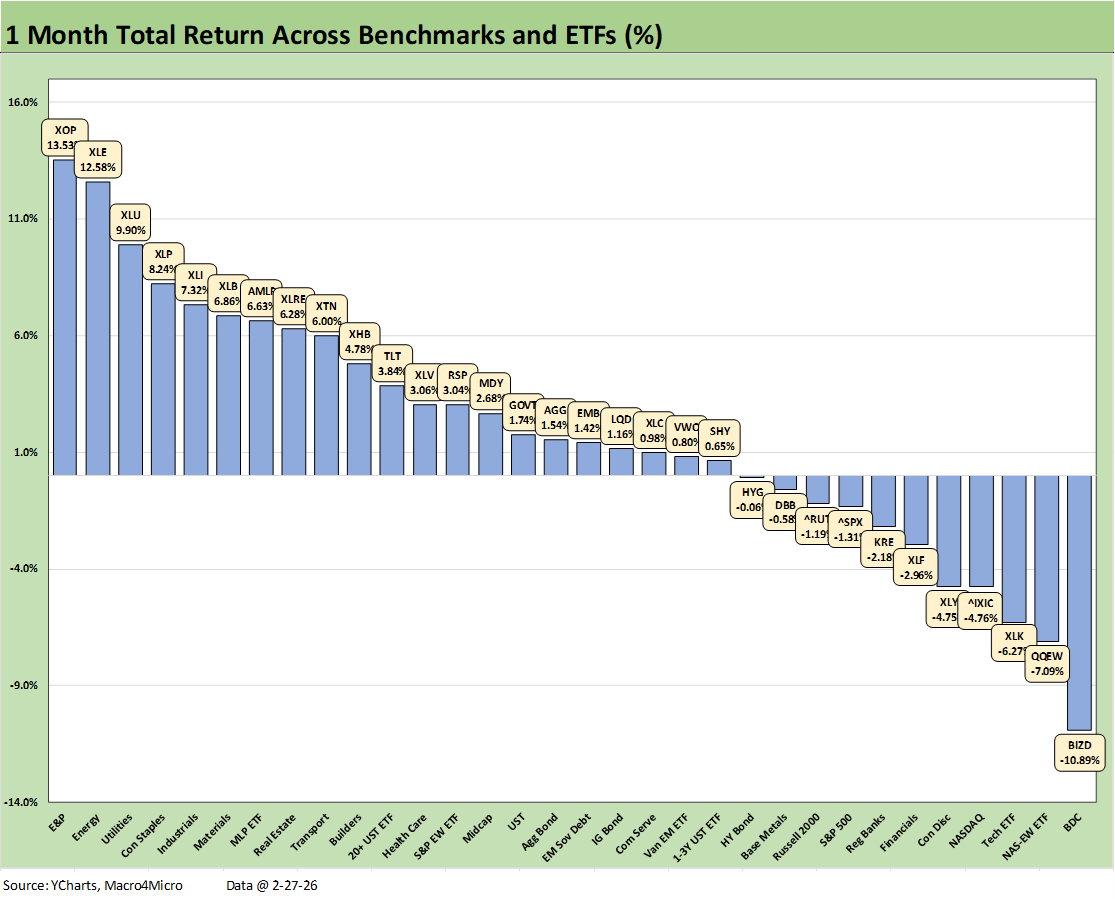
The 1-month timeline for the 32 benchmarks and ETFs weighed in with a 21-11 score, so that is a good story line considering the disarray in tech. When we factor in slower GDP growth in 4Q25 and higher PCE inflation, that also reminds us how resilient the market has been. That could (should) change quickly this week with Iran events.
The 1-month returns show 6 of 7 bond ETFs in positive range. We see the long duration UST ETF (TLT) in the upper half of the second quartile as duration was rewarded. We see HY as the only negative return bond ETF as HY spreads widened by +12 bps on Friday, +24 bps for the week, and +38 bps for the 1-month period.
Notable losers in the bottom quartile are led by the BDC ETF (BIZD) on the private credit setbacks and extrapolation effects in the headlines. Emerging asset classes (as mature as private loans are in reality) have a well-traveled history of excess AUM focus out of the chutes that bring problems across the developmental stage of new asset management P&Ls. Here we are again.
The rest of the bottom quartile has a heavy tech flavor (even the S&P 500), but Financials (XLF) and Regional Banks (KRE) are getting hit by a number of factors from UST slope question marks (interest rate margins) to asset quality and what the AI side effects might bring to loan quality and private credit blowback.
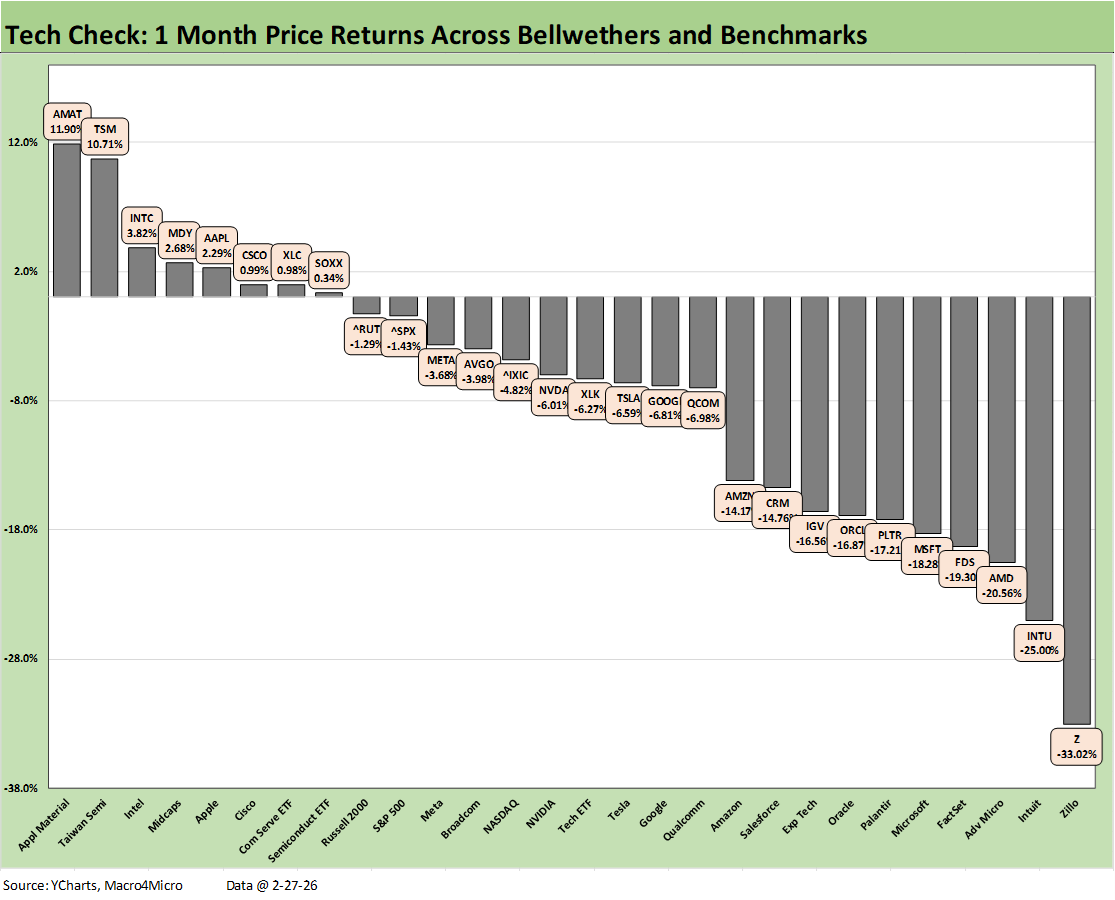
The “tech check” issues have been discussed already in other commentaries, and the trouble is readily evident in the 1-month score of 8-20 in the 28 asset lines we selected. It is notable that Applied Materials (AMAT) is on top again since very few (no one?) expects capex to decline from 2025 levels. Forecasts may change, but investment capex is a matter of “How high?”
In the context of the SaaS-centric business sell-off, we see Zillow in last joined in the bottom 4 by Intuit (INTU) and FactSet (FDS). Of the 4 business services names we added to the group this week, we see Salesforce (CRM) in negative return range but at least making it into the low end of the third quartile at –14.8%.
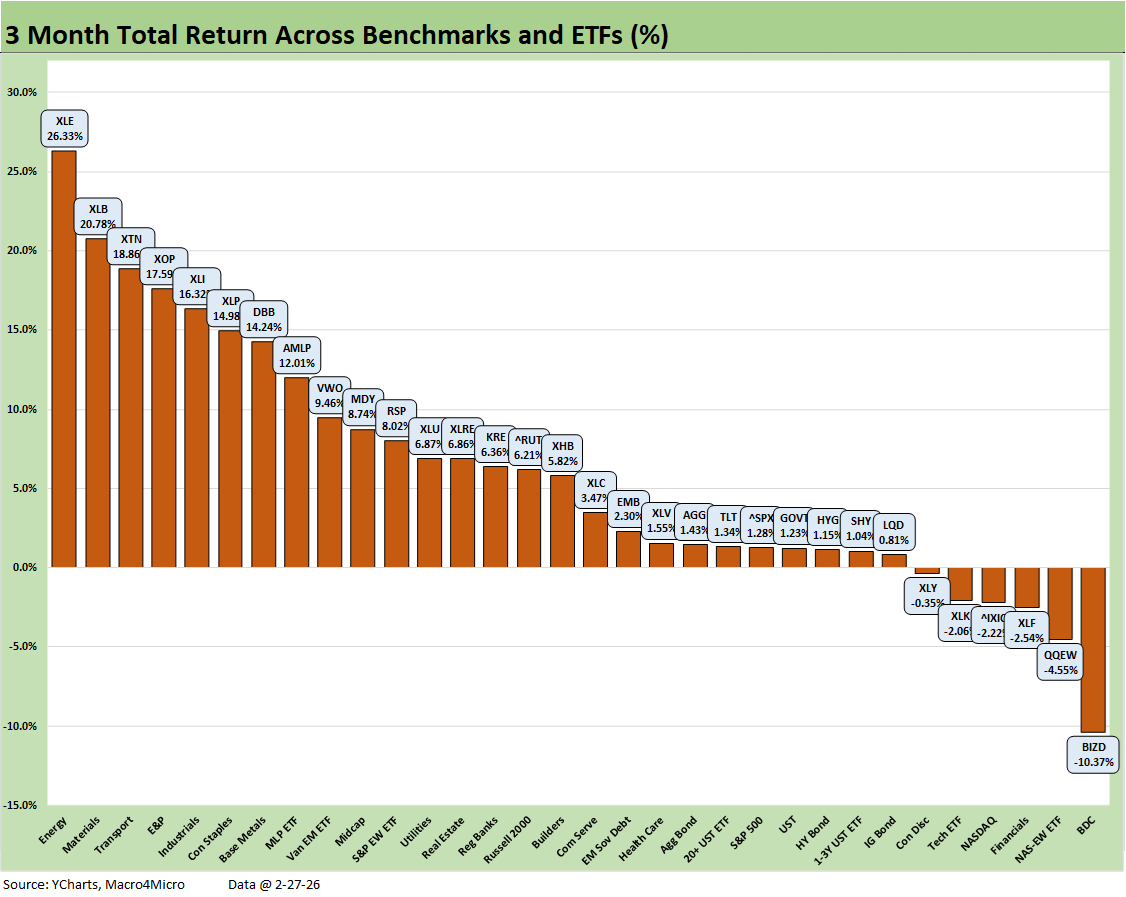
The 3-month score of 26-6 shows 4 tech-based names joined by the BDC ETF (BIZD) on the bottom and Financials (XLF) in the mix. BIZD posted up -10.4% or materially worse than the -4.5% in second to last place with the Equal Weight NASDAQ 100 ETF (QQEW).
The top quartile included 3 energy related ETFs (XLE, XOP, AMLP). Tech or tech-heavy saw no members in the top quartile. Materials (XLB), Transports (XTN), Industrials (XLI), and Base Metals (DBB) flagged cyclical rotation while Consumer Staples (XLP) added the element of dividend-heavy companies sensitive to interest rate impacts on valuation.
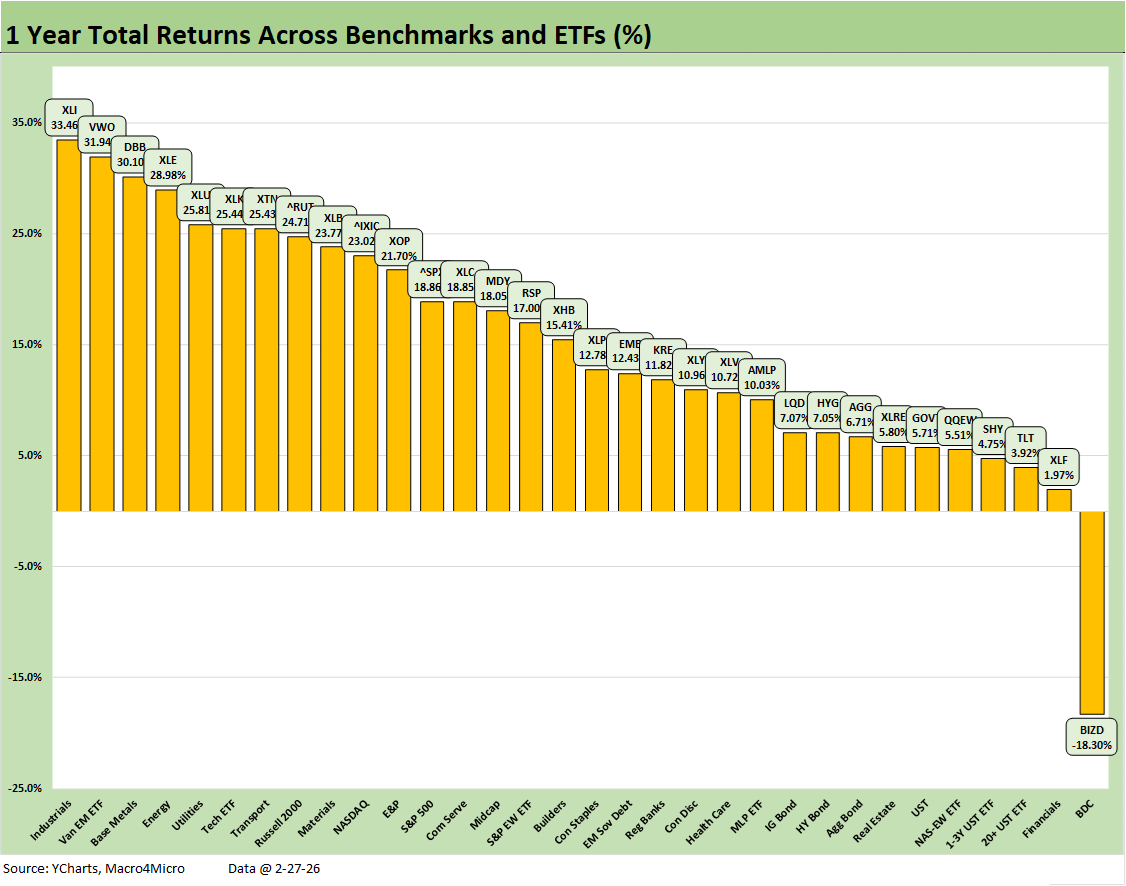
The trailing 1-year score of 31-1 does not leave much room for debate with BDCs a distant last place at -18.3%.
A notable winner is Industrials (XLI) at #1 with EM Equities (VWO), Base Metals (DBB), Energy (XLE), Utilities (XLU), Transports (XTN), and Russell 2000 small caps reminding us of the virtues of diversification. VWO added the currency element as the dollar was beaten up. The only tech play in the top quartile was the Tech ETF (XLK) at #6.
The bottom quartile included 4 of the 7 bond ETFs in the bottom quartile. HY (HYG) and IG Corporates (LQD) were at the bottom of the third quartile. The Real Estate ETF (XLRE) in the bottom tier was also feeling the UST curve action in the performance
See also:
US Trade with the World: Import-Export Mix 2-25-26
Fun Facts: State of the Union Prep Kit 2-24-26
Market Commentary: Asset Returns 2-23-26
New Home Sales Dec 2025: Fresh Game Clock 2-21-26
PCE Income & Outlays Dec 2025: Inflation Reversal? 2-20-26
4Q25 GDP (Advance Est.): Less Distortion This Time 2-20-26
2025 trade Deficits: Reality vs. Rhetoric 2-19-26
Industrial Production Jan 2026: Capacity Utilization Trends 2-19-26
Home Starts Dec 2025: Wrapping a Weak 2025 2-18-26
Market Lookback 2-17-26
CPI Jan 2026: Reassuring Numbers, Missing Pieces 2-13-26
Existing Home Sales Jan 2026 2-12-26
Payrolls Jan 2026: Into the Weeds 2-11-26
Employment Jan 2026: Good Headline, So-So Mix 2-11-26
Retail Sales Dec 2025: Muted Year-End 2-11-26
Market Lookback: Monkey Business 2-9-26
Switzerland-US Trade: A Deficit that Glitters 2-3-26
US-Taiwan Trade: Risks Behind the Curtain 2-1-26
Trade Deficits: Math Challenge 1-30-26
China Trade: Shrinkage Report 1-28-26
Mexico Trade: Gearing up for More Trade Trouble? 1-27-26
Canada-US Trade: Trump Attack N+1 1-25-26
Policy Mud on the Wall: Consumer Debt, Residential Mortgages 1-15-26
2025 Spread Walks and Multicycle Return Histories 1-5-26
Annual Return Differentials: HY vs. IG Across the Cycles 1-3-26