
Industrial Production Jan 2026: Capacity Utilization Trends
A constructive set of industrial production and capacity utilization metrics support a balanced cyclical story.


The combination of durable goods orders for Dec 2025 and industrial production for Jan 2026 made for a respectable close to 2025 and start to 1Q26.
Industrial production rose in Jan 2026 while capacity utilization ticked higher for total manufacturing, durables, and nondurables. Mining barely moved (ticked slightly lower) but utilities reached a recent high and comfortably ahead of 2025 and late 2024.
Durable goods orders for Dec 2025 were mixed after recent struggles. Defense was healthy but Transportation was weak. Core capital goods (“Nondefense capital goods ex-aircraft”) rose as well.
The big decline in nondefense aircraft and parts tended to dominate headlines but a wide cross section of durables at least is not flashing yellow in manufacturing taken in tandem with industrial production overall.
Relative optimism is in part tied to the incentive from the tax bill contributing tailwinds, ongoing tech and related infrastructure capex, and defense investment. The lines show more signs of firming across durables lines in industrial production.
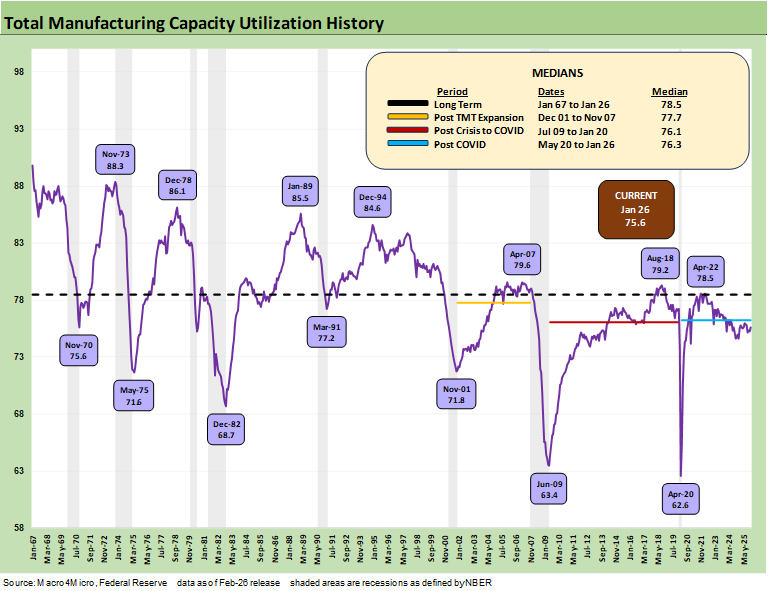
The above table frames the long-term history of capacity utilization from 1967. The current capacity utilization level for manufacturing of 75.6% is below the July 2009 to Jan 2020 cycle median (vs. average) of 76.1%. The current level is below the post-TMT cycle through Nov 2007 of 77.7% (note: the credit crisis recession started in Dec 2007).
A material leg down in manufacturing from here requires a massive macro event such as COVID or the systemic bank crisis that also crushed the Auto OEMs and supplier chain. The 1980-1982 stagflationary double dip also shows up across the times series on the “worst of” decline in manufacturing utilization. That would take a lot to go very wrong.
The good news is that the US economy is larger, more diverse, and more service-intensive than ever with much lower levels of cyclicality. The tariffs are tied to the fact that the shift to services and global sourcing went too far. That has been the topic for years now.
Recapturing that manufacturing capacity will be no small task since such an outcome will need companies to have confidence that policies will remain stable and predictable to analyze project economics and capital budgeting risks. If there is one certainty in the world after 2025, it is that tariffs are a constant negotiation and will change at will and at whim. That does not encourage long-term capex commitments.
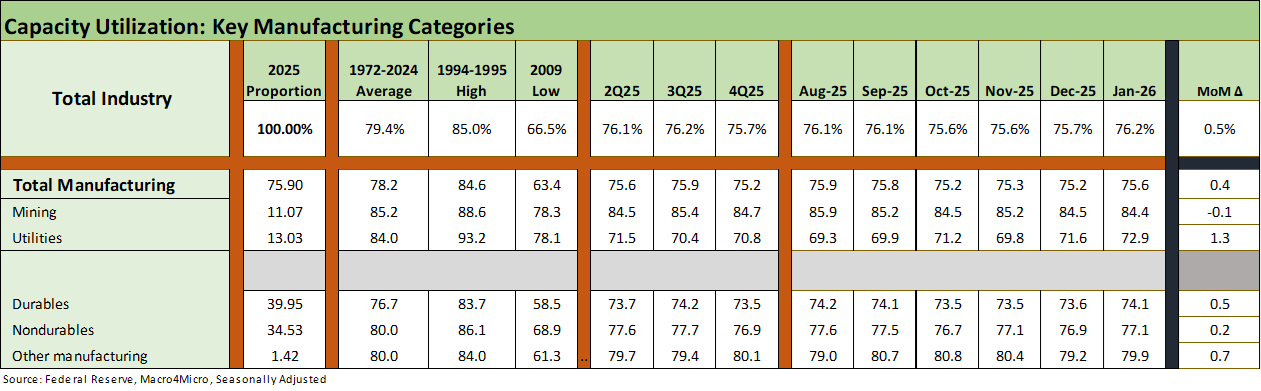
The above table breaks out the trends from the headline level for Total Industry and Total Manufacturing and across the major subsector groupings. We break out the deltas in the right column. All rose except Mining, which barely moved lower.
We tend to focus on the moving parts of Durables and Nondurables, but Utilities will be getting a lot more focus in 2026 and beyond given the inflation spikes in Electricity and Utilities (Piped) Gas. The Dec 2025 moves in Cap Ute were mild for Manufacturing.
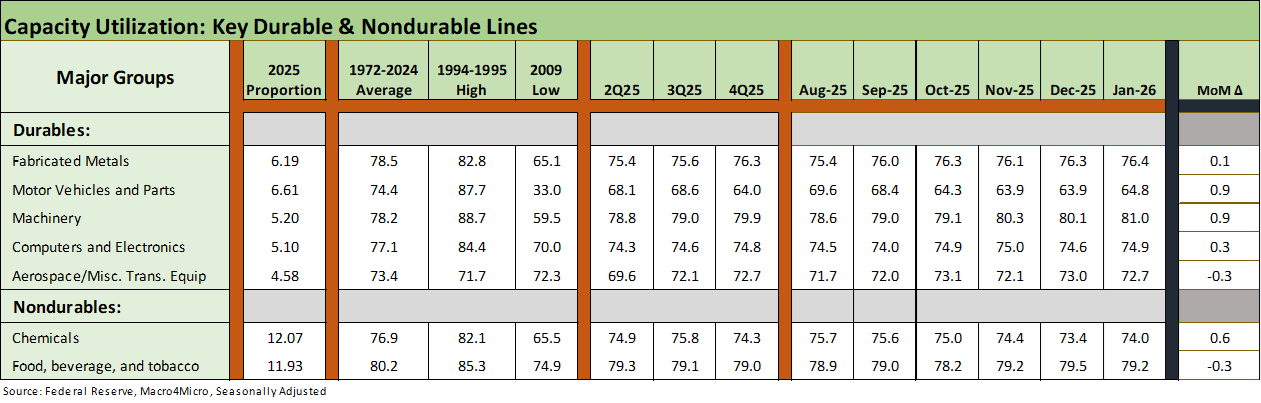
The above table updates the top 5 Durables subsectors and the two largest in Nondurables. Durables saw all move higher except Aerospace. Chemicals rose but Food, beverage and tobacco had a mild fade.
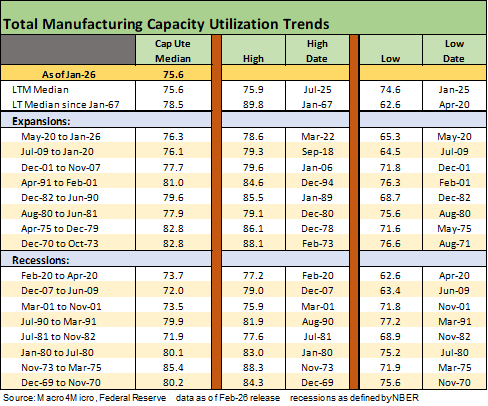
The above table updates the capacity utilization history for expansions and recessions. The ability of more companies to generate solid profits at lower capacity utilization in today’s markets vs. past cycles is tied in part to automation and in part to the development of low-cost supplier chains. Low-cost supplier chains are getting dramatically undermined by tariffs, so the demands to improve efficiency will now be more pressing. Offsetting some unit cost pressures with the “AI story” comes with “pros and cons” as we have seen play out on the screen in recent weeks.
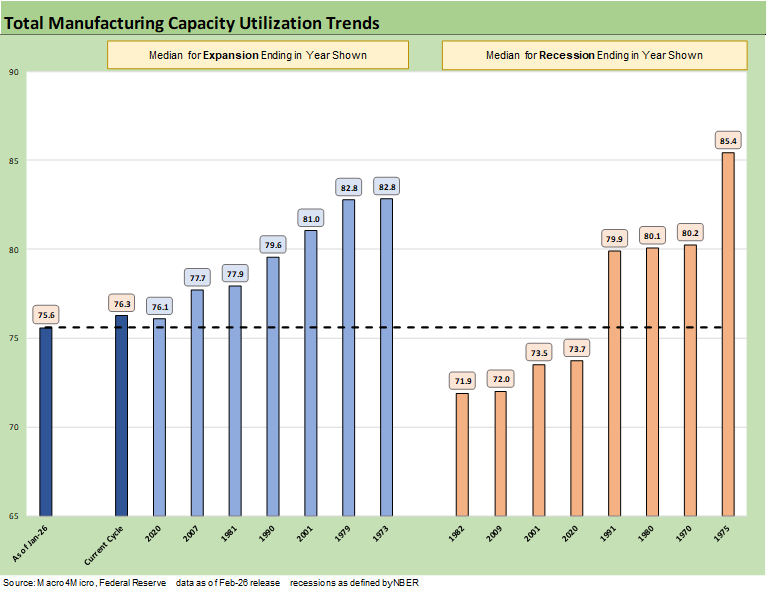
The above chart details economic expansion and recession averages and lines them up by height as a frame of reference. We see the current level on the left at 75.6%. As noted in the prior chart, what has been striking after the credit crisis and protracted recession that followed was that US manufacturing could be so profitable at capacity utilization rates that were below numerous prior recessions.
Low-cost global sourcing was the rage in some industries (notably autos) in the US as well as in Europe. That process had been ongoing for years (e.g., component and finished goods assembly in tech from laptops to semis and integrated tech systems in the pan-Asia chain). That “lower breakeven” plan is now “toast” with the tariffs. The oft-stated theory is that supplier chains will rapidly return to the US or come to the US for the first time. That is a long-term hope. That will take years when a lot can happen on the policy front.
The theories on reshoring or onshoring combines a level of optimism with a disdain for the concept of “time lags” and willingness of companies to make substantial multiyear capital outlays when the tariffs could be one election away from material revisions. The problem with emergency declarations to enact so many tariffs is that the “next guy” can simply say – in whole or in part – that “the emergency is over.”
See also:
Home Starts Dec 2025: Wrapping a Weak 2025 2-18-26
Market Lookback 2-17-26
Market Commentary: Asset Returns 2-16-26
CPI Jan 2026: Reassuring Numbers, Missing Pieces 2-13-26
Existing Home Sales Jan 2026 2-12-26
Payrolls Jan 2026: Into the Weeds 2-11-26
Employment Jan 2026: Good Headline, So-So Mix 2-11-26
Retail Sales Dec 2025: Muted Year-End 2-11-26
Market Lookback: Monkey Business 2-9-26
Switzerland-US Trade: A Deficit that Glitters 2-3-26
US-Taiwan Trade: Risks Behind the Curtain 2-1-26
Trade Deficits: Math Challenge 1-30-26
China Trade: Shrinkage Report 1-28-26
Mexico Trade: Gearing up for More Trade Trouble? 1-27-26
Canada-US Trade: Trump Attack N+1 1-25-26
PCE Income & Outlays Nov 2025: Resilient Consumer, Higher Inflation 1-24-26
3Q25 GDP: Updated Estimate 1-22-26
Policy Mud on the Wall: Consumer Debt, Residential Mortgages 1-15-26
2025 Spread Walks and Multicycle Return Histories 1-5-26
Annual Return Differentials: HY vs. IG Across the Cycles 1-3-26
 |
|