
Annual Return Differentials: HY vs. IG Across the Cycles
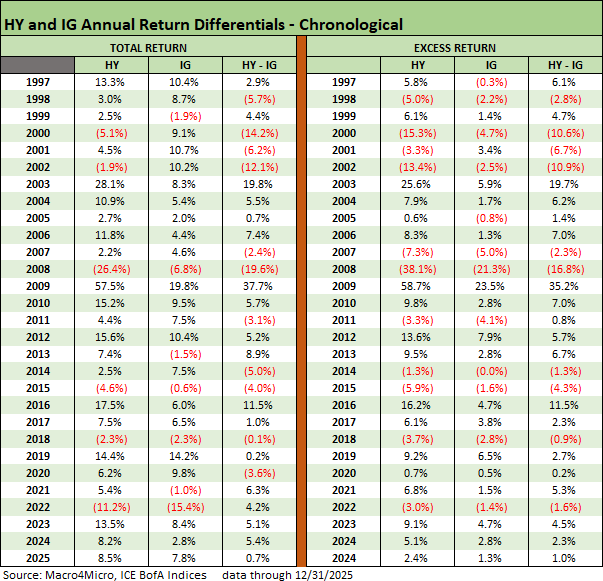
We look at the running total return vs. excess return differentials for HY vs. IG since 1997.


Duration vs. credit balancing act will be very tricky in 2026.
We look at the HY vs. IG differentials for total return and excess return with 2025 posting a +1.0% incremental excess return favoring HY and +0.7% favoring HY in total return as the long end of the UST remained stubborn.
While the refinancing activities have slowly restored the weighted average coupon to around 6.6% for HY vs. 4.5% for IG, spread compression was minimal during calendar 2025 with IG at -3 bps and HY at -11 bps. At +281 bps, HY index OAS at year end was back inside the June 2007 bubble range.
The wide range of views on how the FOMC, inflation, and top-down macro trends will play out for UST curve shapeshifting underscore a daunting challenge to replay the respectable balance across IG and HY. The latest dot plot showed a wide range (see FOMC: Dot Plot Scatters for 2026 12-10-25).
The overall bundle of risk variables brings considerable uncertainty with a list including FOMC politicization and division, payroll weakness (notably in small business), lingering inflation worries, potential tariff lag effects, the USMCA “review” risks, and stressed geopolitical relationships with major trade partners such as the EU and Canada. Of course, Venezuela brings some issues such as WTF?
The path into 2026 for credit risk premiums begins with the intrinsic risk of very tight absolute spreads that look more like June 2007 during the bubble years. That means less compensation for moving down the credit risk spectrum. That backdrop implies more downside exposure in credit pricing.
For those in HY bonds, the realities of very compressed quality spread differentials always make for difficult risk-reward symmetry since bad economic news or sharp equity sell-offs (or both) drive credit spread widening from the bottom up.
The good news looking back across history is that HY rarely underperforms IG in excess returns. In this market, the IG performance will be heavily about duration risk and the stubborn long end – just as we saw in 2025. The UST bull steepener was the catalyst for good bond performance across 2025, but the steepening has pushed back against the “bull flattener” optimists (see Market Lookback: Last Call for Unusual Behavior 12-22-25).
Record UST supply, record deficits, and the need for record UST demand is set against weak dollar trends in 2025 and the potential for more of the same in 2026. Driving major allies away from the US and overtly attacking some (notably the EU) on the geopolitical front and talking “annexation” is not going to reduce the UST demand risk.
As we head into a fresh round of FOMC handicapping, there is much to ponder. We see dubious prospects for Fed independence running alongside a wide range of views on inflation and UST shapeshifting (steeper vs. flatter). The “interest rate risk vs. credit risk” trade-off is not getting easier given the moving parts. We vote for wider spreads and a steeper curve in 2026.
Excess return differentials low but positive in 2025
The “HY minus IG excess return differential” is a small number at only 1.0% for 2025. That does not make for great risk symmetry or compensation for credit risk to start 2026. The table shows 8 of the last 10 years posting positive excess return differentials since 2016 while HY energy turmoil had roiled the 2014-2015 differential performance.
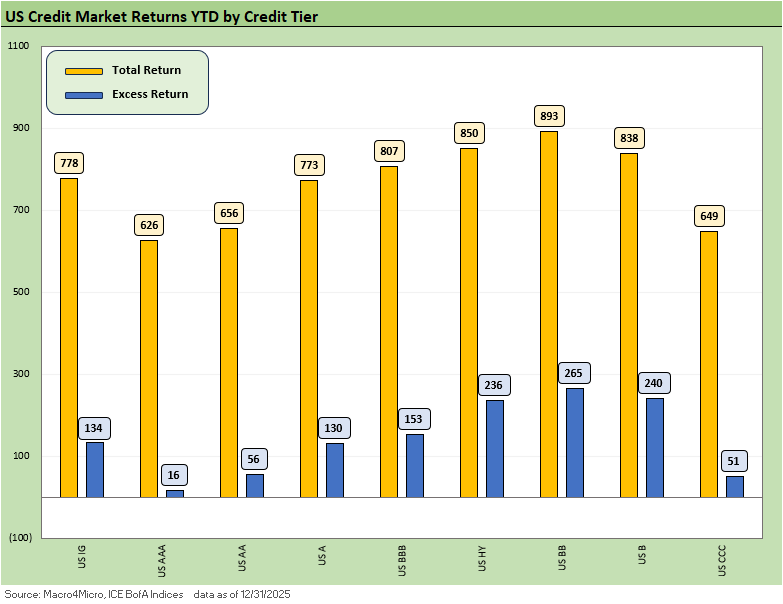
The recent years and relative differentials get back into the HY lite strategy and the merits of trading off tighter spreads with better risk-reward symmetry than that seen in the mid to lower B tier. Generally, we have seen better relative risk-return in the BB tier during 2025 and across the credit cycles as evident in returns across the credit tiers.
In recent years, we see small negative differentials in problem years such as 2022 and 2018. For 2022, that is somewhat reassuring given the inflation shock. For 2018, the major equity and bond indexes were all in negative return range.
As we detail in the next chart, the duration + credit performance played out well for the BB tier in 2025 while interest rate risk had a year that will be hard to replicate even with all the talk around multiple Fed easings.
Negative excess return differentials from bygone years
Where we have seen weakness in HY excess returns vs. IG in the past (i.e., negative differentials in the above chart), any material underperformance was limited to some very ugly years such as the TMT Implosion in 2000 to 2002 (add Enron and a few other headliners) and the 2008 bank/broker meltdown that also saw various industry shocks such as automotive.
Modest underperformance during economic expansion periods with high-risk appetites such as the late 1990s are rare, but the 1998 -2.8% excess return differential tied into the August 1998 Russia default, EM contagion risk, the LTCM mini-panic, and Lehman rumors that rolled into the fall. That flareup drove a material spread gap in the fall and evoked an FOMC easing response.
During expansion periods such as 1998, 2014, 2015 and 2018, you can still face the risks of negative excess return differentials in HY. The potential trigger point in 2026 will be inflation, FOMC surprises, and the USMCA renegotiation. The trade and tariff issues offer some similarities to 2018 as does the FOMC wildcard. Inflation is a newer experience across recent cycles. The extreme equity valuations in tech especially can also wag HY spreads in the event of a correction. 2018 had a combination of corrections and near bear markets.
See also:
Total Return Quilt Across Asset Classes 2008-2025 1-2-26
Cyclical Histories: Will Facts Be in Vogue in 2026? 1-2-26
3Q25 GDP: Morning After Variables to Ponder 12-27-25
Durable Goods Oct25: Core Capex Still in Gear 12-23-25
Market Lookback: Last Call for Unusual Behavior 12-22-25
Existing Home Sales Nov 2025 12-21-25
November CPI: Tricky Navigation 12-18-25
Employment Nov 2025: Bad News is Bad News 12-16-25
Payrolls Nov 25: Into the Weeds 12-16-25
The Curve 12-15-25
Market Commentary: Asset Returns 12-14-25
Market Lookback: FOMC Fragments, Rate Debates Murky 12-13-25
FOMC: Dot Plot Scatters for 2026 12-10-25
 |
|