
Total Return Quilt Across Asset Classes 2008-2025
We update the asset total return quilt for final 2025 numbers across 16 asset classes and 18 years.


Tech showing endurance at altitude.
Using a range of ETFs, we update the annual total return quilt across 16 asset classes, major benchmarks, and across equities and bonds since 2008 (18 years). Benchmarks with higher tech weightings and non-dollar ETFs ranked in the upper tier during 2025 and in 7 of the last 10 years.
2025 shows the tech-heavy NASDAQ and S&P 500 in the top 3 but posting annual returns below what those large cap benchmarks generated in 2024, 2023, and 2021 with the 2022 inflation and tightening cycle beatdown setting the stage for the big rebound.
The fact that the EUR ETF is in the lead on this chart reflects the dollar weakness that bolstered relative returns for EUR vs. dollar indexes. International diversification paid off in 2025. Not shown in this chart but also posting superior performance were ETFs with exposure to EM (VWO) and similar ETFs for China, Canada, and Mexico.
The worst #1 “winning score” since 2008 was posted in 2018 with the short UST ETF the winner at under 2%. 2018 was a year with a few 1,000-point drops. That year featured NAFTA renegotiation and global tariff threats into 2019 that eventually saw capex and exports weakened as the Fed rode to the rescue in 2H19. That detail seldom comes up in Trump’s citing “the greatest economy in history” (see Cyclical Histories: Will Facts Be in Vogue in 2026? 1-2-26). 2026 will face questions on tariffs and the FOMC also with the USMCA up for review.
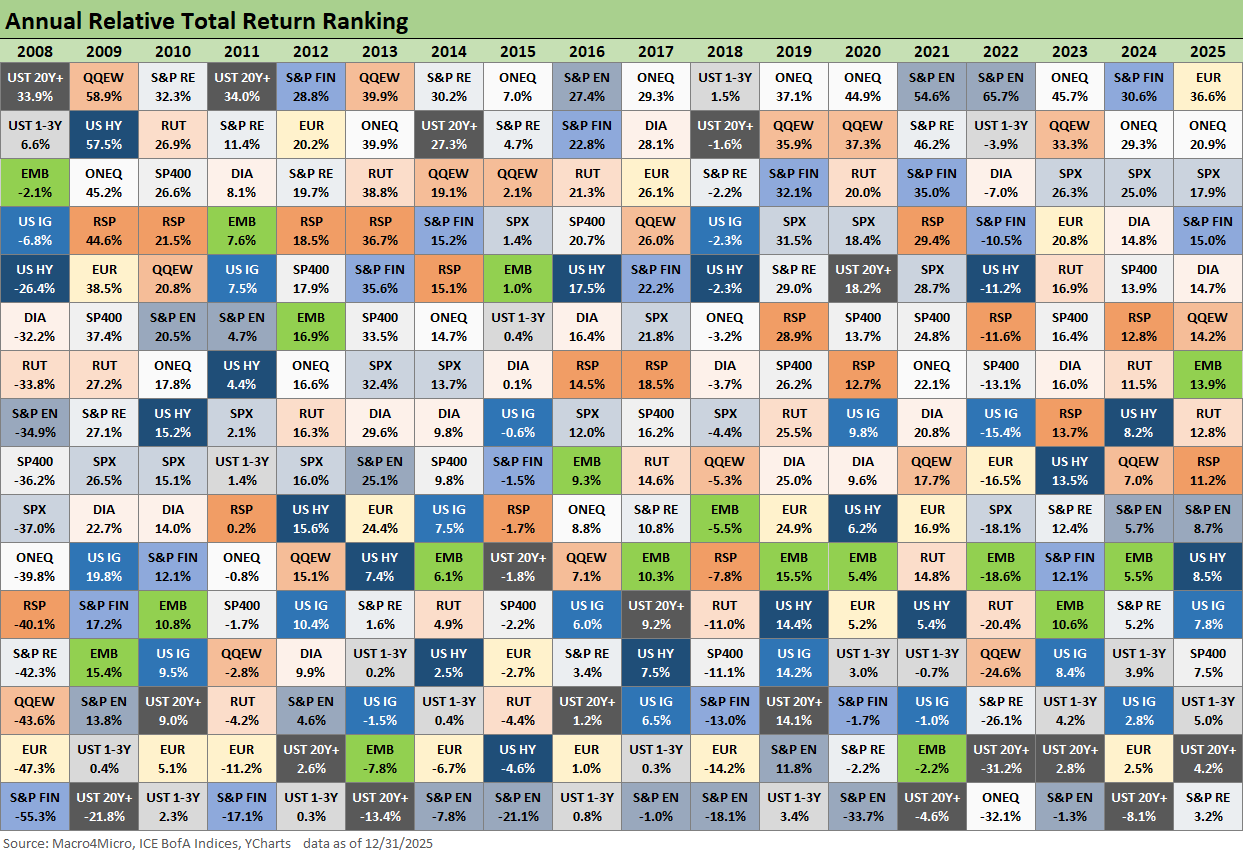
The return quilt above frames the annual total returns across a range of asset classes since 2008 with 18 years and 16 benchmark and subsector ETFs. We start with the onset of the credit crisis in 2008 in the aftermath of the recession onset in Dec 2007 (per NBER).
As a reminder, the timeline includes a protracted period of ZIRP since late 2008 and then into QE after Dec 2015. The market shifted into normalization mode in 2016 until monetary policy reverted to ZIRP in March 2020 with COVID before ending in March 2022.
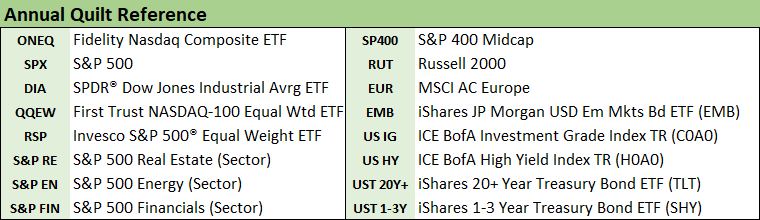
We chose the benchmark ETFs for ease of data generation across various time horizons. We break out the tickers below for those less familiar with the full array of ETFs. Bonds ranked in the bottom tier in a year of bullish equity returns.
The annual rankings show tech-centric benchmarks such as NASDAQ and/or the Equal Weight NASDAQ 100 (QQEW) in the top slot for 7 years and in the #2 ranking in another 2 years. That is 9 of 18 years. For the last 9 years since the start of Trump 1 and across Biden and into Trump 2, we see tech biased ETFs #1 or #2 for 6 of 9 years with only 2018, 2021, and 2022 falling off the pace from tech-heavy ETFs being in the top 2 rankings.
Breaking up the top tier of leaders was the Energy ETF in 2021 and 2022 with the Russian invasion of Ukraine pumping up energy equities in 2022 before those were pulled back in 2023 to 2025. The energy inflation spike has had lasting, damaging effects on affordability even with oil prices declining.
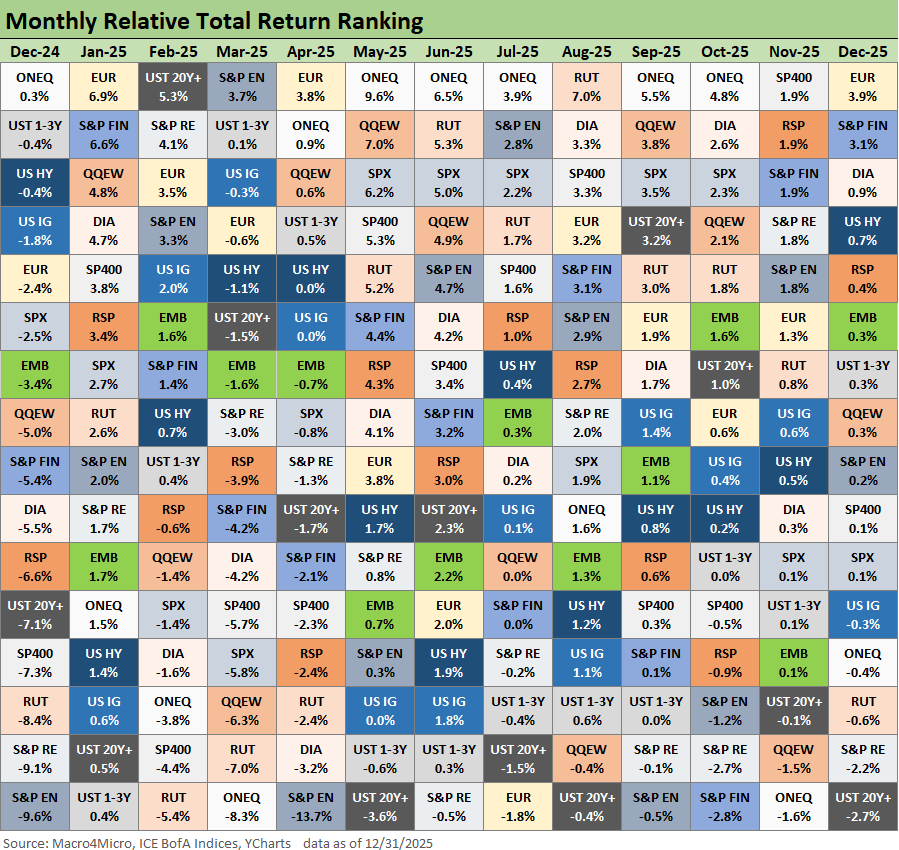
The above quilt breaks out the monthly lookback for the same ETF group. With NASDAQ at #1 for 6 of 12 months and NASDAQ or the Equal Weight NASDAQ (QQEW) ranked #2 in 3 other months, it is safe to say tech ruled this year. The tech-heavy S&P 500 was also in the top 3 for another 5 months.
Bonds performed well with the bull steepener across the UST curve, but this has been a cycle where equities have ruled and old-fashioned bond math cannot compete with that. An important note on the annual and monthly returns is that S&P Financials performed well and the bank system is getting votes of confidence for now.
The small cap performance at +12.8% for 2025 also ties into the view of the cycle and asset quality risks of regional banks. Private credit has tested nerves lately on asset quality anxiety and an ominous metals short squeeze has been lurking in the background noise. We have seen 6 of the past 7 years with solid double-digit returns for small caps. We even saw Russell 2000 and Midcaps take the #1 spot in August and November, respectively, in 2025 when tech sold off.
See also:
Cyclical Histories: Will Facts Be in Vogue in 2026? 1-2-26
3Q25 GDP: Morning After Variables to Ponder 12-27-25
Durable Goods Oct25: Core Capex Still in Gear 12-23-25
Market Lookback: Last Call for Unusual Behavior 12-22-25
Existing Home Sales Nov 2025 12-21-25
November CPI: Tricky Navigation 12-18-25
Payrolls Nov 25: Into the Weeds 12-16-25
 |
|