
Market Lookback 2-17-26
We look at the latest move in UST shapeshifting and credit spreads with the 10Y UST knocking on the 4.0% door.


Getting ready for more GDP data. Toys to shape and reform.
The macro data is catching up since the shutdown, and this week brings the advance estimate for 4Q25. We can expect a wave of political exercises locking in on annualized numbers or nominal numbers or both to paint 2025 as an economy that dwarfed the best of the 1980s and 1990s. As usual, we will lock in on PCE and fixed investment (see 3Q25 GDP: Updated Estimate 1-22-26, Cyclical Histories: Will Facts Be in Vogue in 2026? 1-2-26, 3Q25 GDP: Morning After Variables to Ponder 12-27-25).
The CPI and payroll numbers last week helped the macro story even if there are quite a few line items that push back on cyclical overconfidence. The lower headline and core CPI remain above target, but there is a growing base of market watchers who do not take 2.0% seriously (getting below 2.0% for a protracted period took multiple crises). The reality in CPI that is not part of the pitch is that food inflation is higher than 2024 and the energy support from lower gasoline does not diminish the household pain in energy services in electricity and piped utility gas (see CPI Jan 2026: Reassuring Numbers, Missing Pieces 2-13-26).
Payroll as the swing factor for FOMC policy will need more numbers to fortify the easing story line since the quality of the mix is weak (too much “Health Care and Social Assistance”) while the FOMC has not really shown its hand on AI multiplier effects. The Fed is likely as confused on AI fallout as the equity markets right now (see Market Commentary: Asset Returns 2-16-26). Presumably the AI and payroll commentary (What is full employment?) will bring some forceful ambiguity. The market awaits the messaging from the incoming Fed Chair.
The strong rally in the UST curve this past week might rejuvenate the UST bull flattener fans as the 10Y UST got close to 4.0% (4.05% as we go to print this afternoon). The 3.6% handle on the 10Y UST seen (briefly) at the start of the easing cycle (Sept 2024) can serve as fuel for the optimists seeking the bull flattener and lower mortgage rates or as a discussion topic for why a bear steepener ensued after that date with record deficits, mixed macro trends, a weaker dollar and strained relations with major sources of UST demand around the world. The recovering good news in the consumer sector and the much-ballyhooed trillions in fixed investment promised by trade partners and how that flows into multiplier effects are forward-looking wildcards.
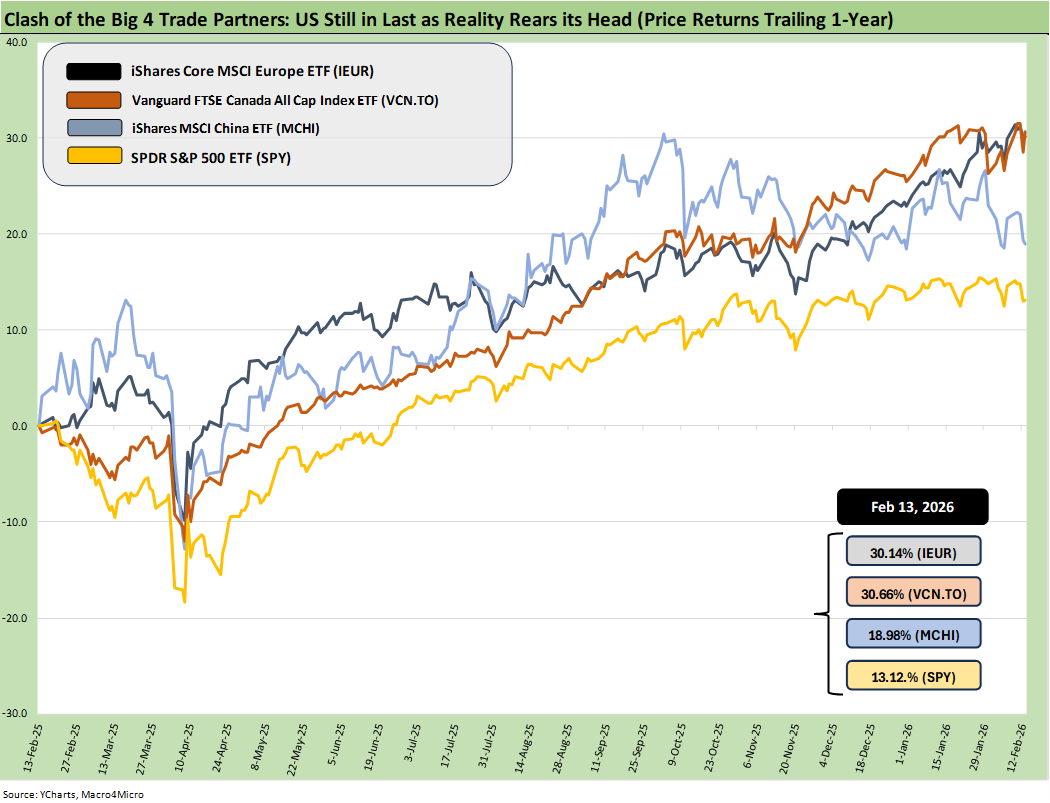
The above chart updates the running returns on benchmark ETFs that cut across the Big 4 trade partner equity markets and reflect currency effects. The chart has been a recurring one with the US remaining in last place. The nondollar effects offer an easy reminder that there are more than a few ways to invest in international exposure while diversifying dollar risk. Europe and Canada are well ahead.
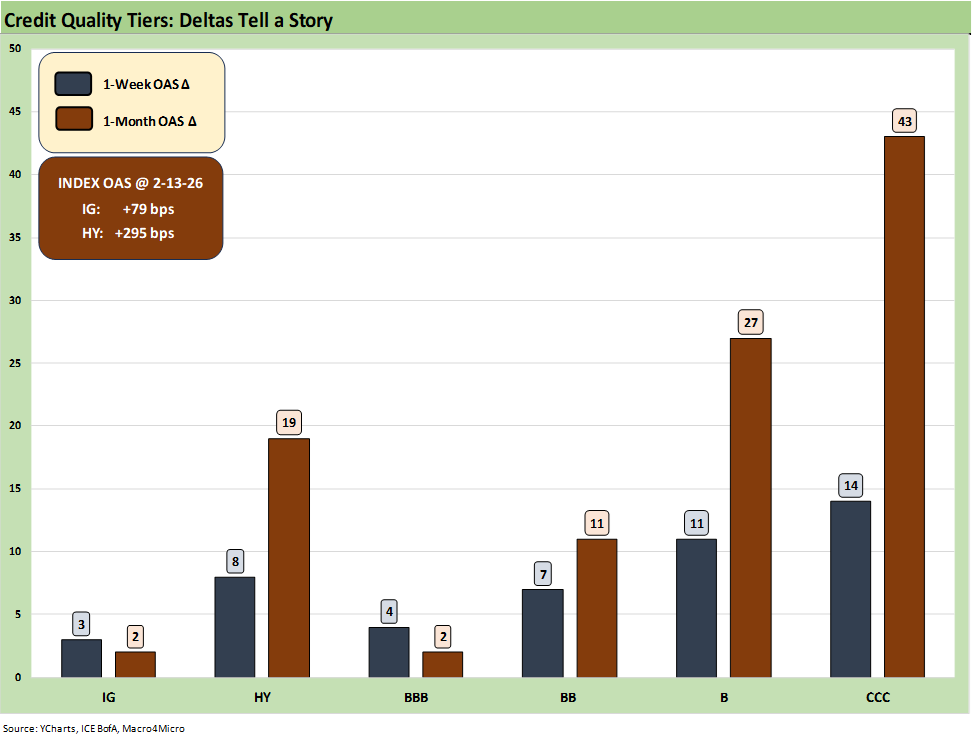
The above chart updates the trailing 1-week and 1-month credit spread deltas for IG and HY and from the BBB tier down to the CCC tier. The theme has been spread widening while IG and HY OAS still remain at very low levels in absolute terms.
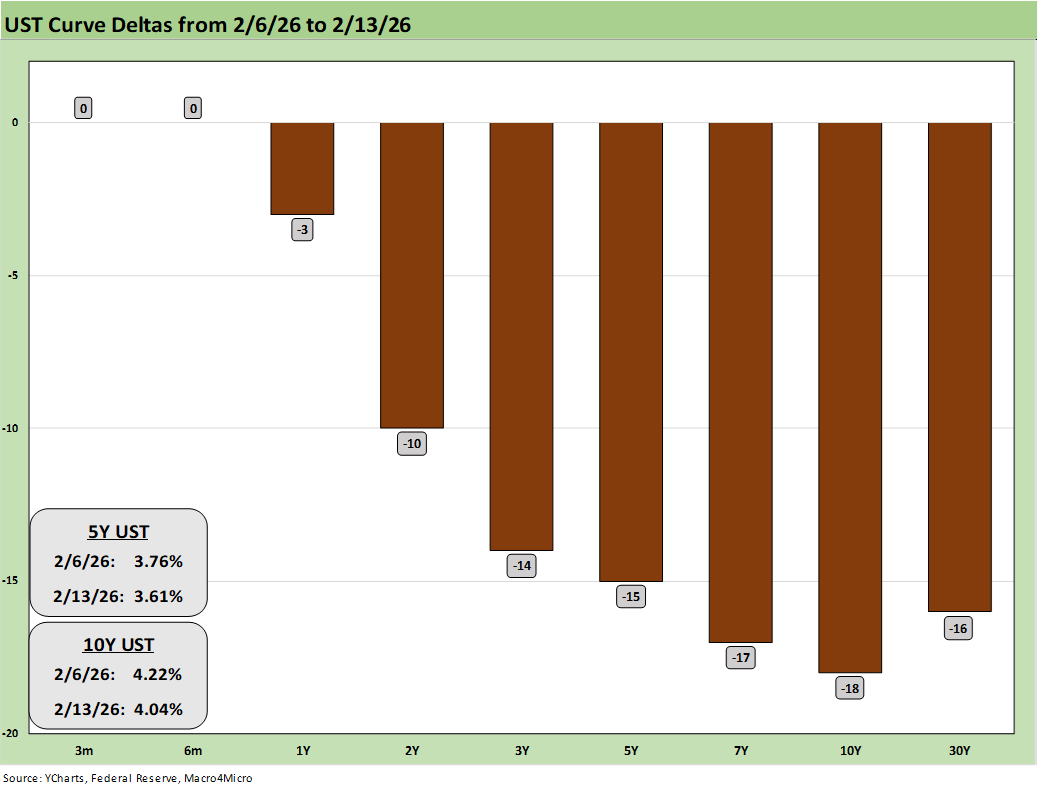
We looked at the UST deltas for the week in a commentary we posted earlier on LinkedIn. This is largely a cut and paste of that note:
The optimism of the UST bull flattener crowd just got a lift this past week as duration was rewarded and CPI numbers improved. All the bond ETFs we track posted positive returns.
As we detail in the chart above, the double-digit decline in UST yields from 2Y to 30Y rewarded bond returns as we cover in a separate LinkedIn post. We also are seeing anxiety pick up across tech subsectors that includes worries around “tech-on-tech violence” from potential AI side effects on software and providers of analytics and data. That recent development brings some new drama to dislocation risk and potential valuation and payroll pressures.
The payroll debate continues with the 130K job adds showing a consensus “beat.” That modestly reshaped the discussion after the weak JOLTS numbers, the ugly Challenger report, and soft ADP release had cast a pall over job prospects.
The details of the 130K are discussed in our Substack commentary, but the excitement of higher-than-expected jobs is curbed by the fact that over 123K of the additions fall under the “Health Care and Social Assistance” category. That is considered a low multiplier effect occupation. The overall mix factor is suboptimal and narrowly concentrated.
The lagging Manufacturing payroll in the Jan 2026 details at least showed a rare 5K addition but are down -83K YoY. That opens up the tariff topic as a headwind in reality even if being sold politically as a tailwind.
Jan 2026 payrolls offered headline bragging rights as did the lower CPI, but the inflation line items still have a lot of worrisome CPI comparisons including food (higher now than in 2024). We also see energy services as a drag with high inflation in electricity and piped utility gas as one of a number of troubling and stubborn consumer realities. The coffee, beef, and sweet consumers are especially unhappy.
The current 4.0% handle 10Y UST is well above the 3.6% handle of Sept 2024 when the easing cycle began. That was before the bull flattening expected by many transformed into a bear steepener. Mortgages are still hanging around the low 6.0% area. People will have a very hard time making a case for lower UST supply given the revised estimates on deficits.
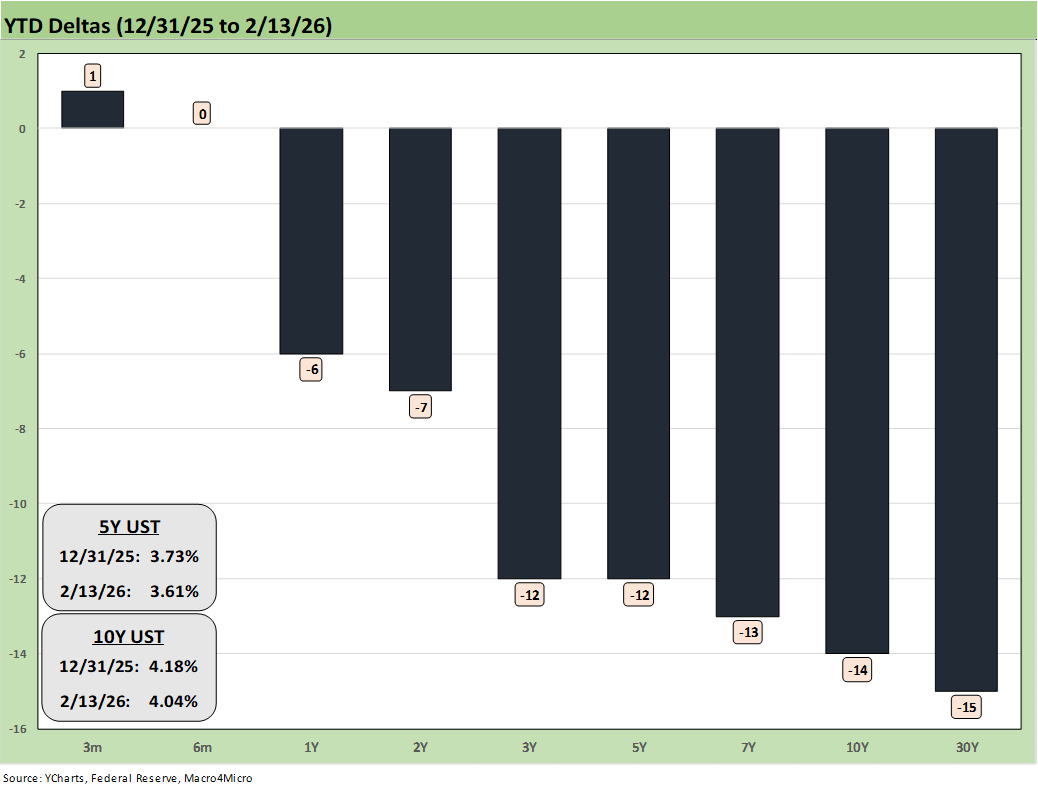
The YTD deltas were heavily about the moves just this past week with good news for duration and bonds but still a lot of questions on the timing of FOMC action on the front end. The front-end inversion remains an anomaly as the curve steepened beyond 2Y.
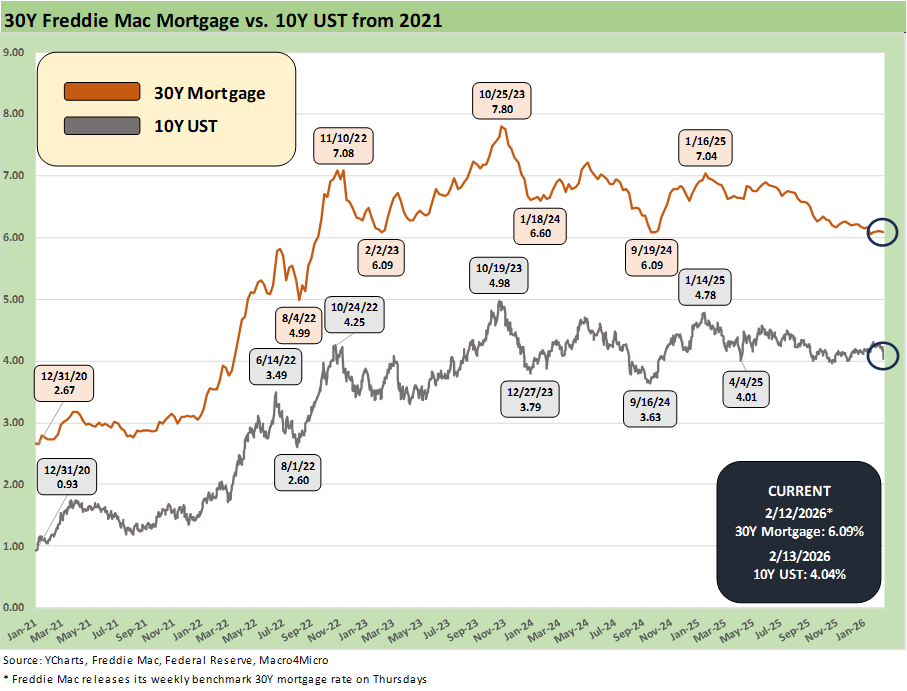
The above time series updates the 10Y UST vs. the Freddie Mac 30Y benchmark (set on Thursday). The dip to the low 4.0% range for the 10Y UST was favorable as it flowed into a low 6.0% range on mortgages (6.04% for Friday close in Mortgage News Daily). The action has been rangebound for the 10Y UST after the exciting drop to a 3.6% handle 10Y UST with the initial round of easing back in Sept 2024.
The ensuing steepener since that earlier period has been a challenge for the bond bulls who keep hoping that flatter and lower from the long end might tag team with a more material shift lower with Fed easing (see The Curve 12-15-25). The longer end is what drives housing, so there is no shortage of skin in the game. Global military adventurism could keep deficits moving higher (war costs money) as the US fleet positions near Iran and the 2027 defense budget plans are calling for a 50% increase.
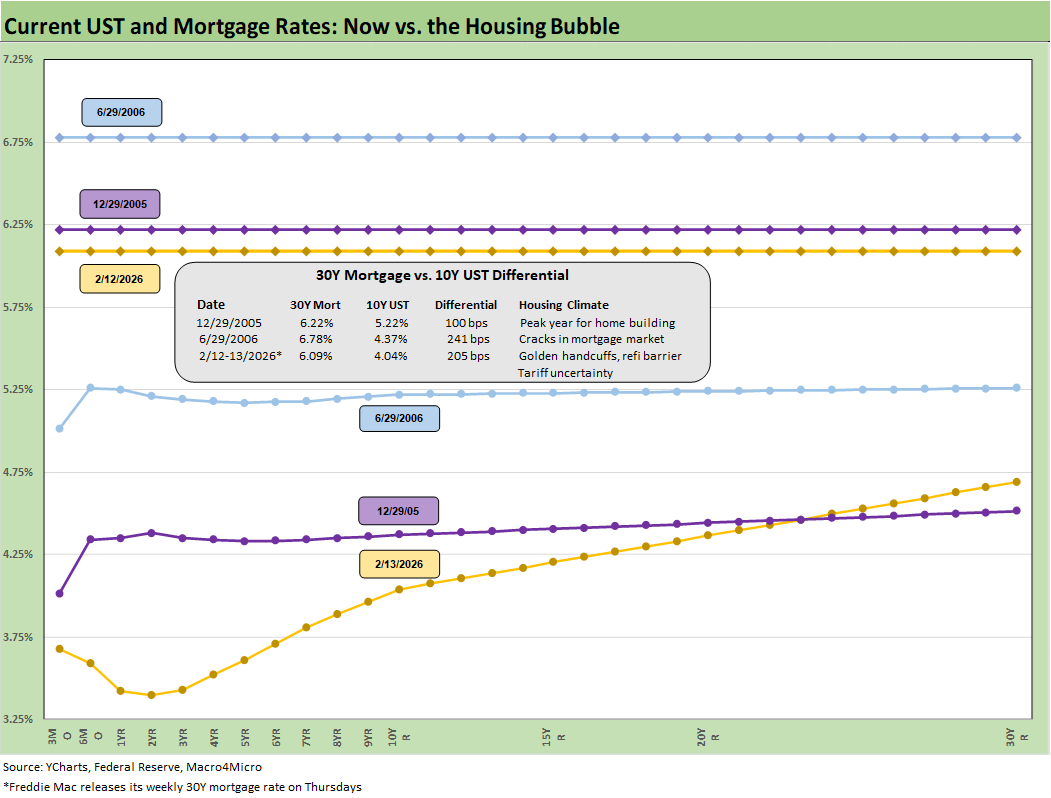
The above chart updates the latest UST curve with the Freddie Mac 30Y (horizontal lines). We picked the Dec 2005 and June 2006 periods as comps for the UST curve and mortgages since 2005 was the peak homebuilder year and June 2006 was when the mortgage quality problems were growing more concerning. Any RMBS structure with a remote pulse seemed to get rubber stamped.
The steep curve of today contrasts with the flat UST curves of those earlier periods, making for interesting discussion points as covered in other commentaries along the way. We see 6% handle mortgage rates both then and now despite a lower UST curve today. That keeps mortgage rate bulls in the game.
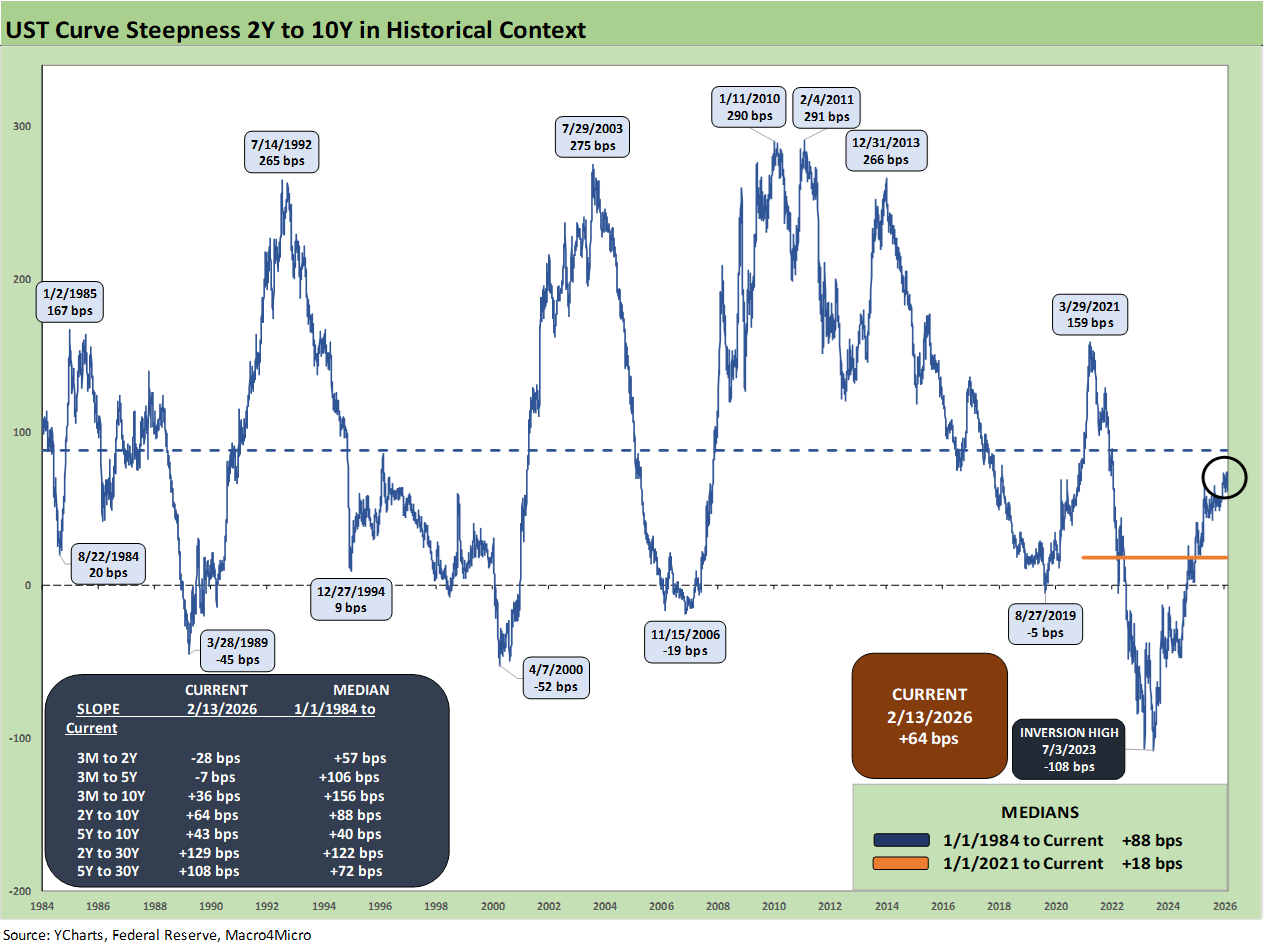
The above chart updates the 2Y to 10Y curve segment slope across time from 1984. The current 2Y to 10Y slope of +64 bps as of Friday is modestly inside the long term median of +88 bps. The FOMC easing potential together with the supply-demand anxiety tied to record UST funding needs could get that slope back to median levels very easily.
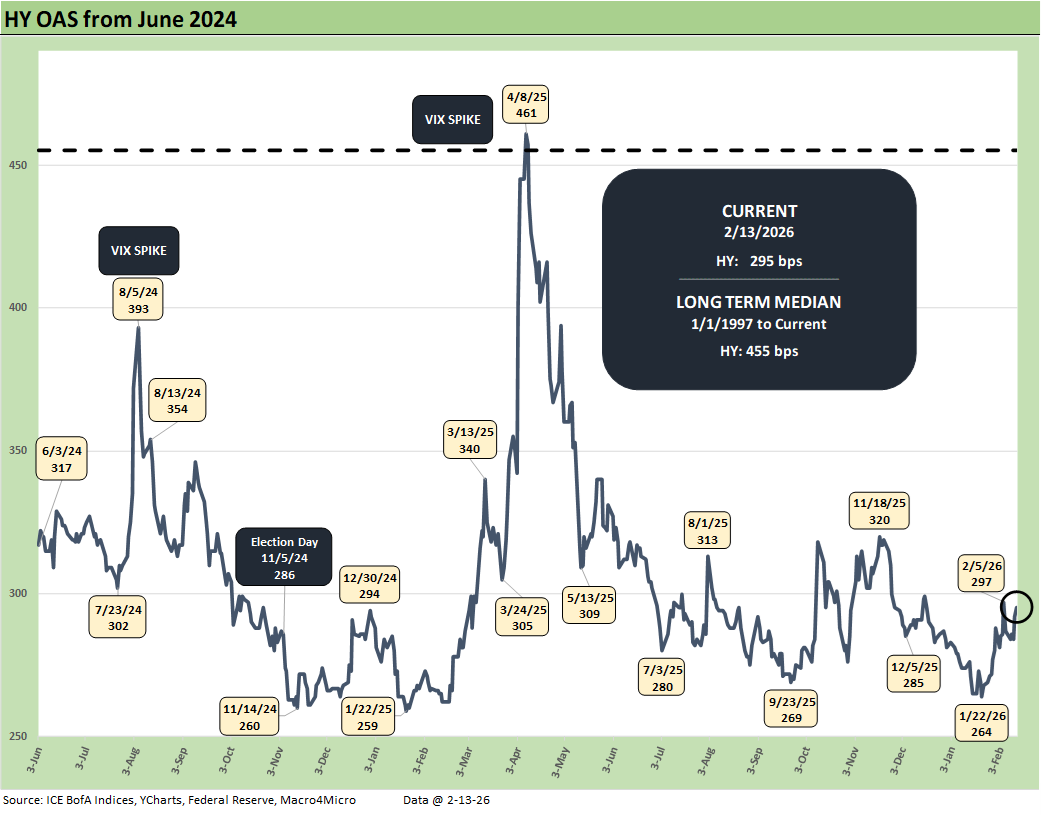
HY OAS widened on the week by +8 bps to +295 bps, but that remains inside the June 2007 bubble range and dramatically inside the long-term median of +455 bps as noted. As we saw with Liberation Day when HY OAS spiked to +461 bps in April 2025, it takes a lot to drive a sustained spread widening trend.
With this economic backdrop, that catalyst for pain would likely need to fall under the heading of geopolitical event risk. Invading a NATO ally (Greenland/Denmark) would qualify, but Iran would likely be viewed more in the context of CPI and inflation. Iran would be damaging, but Greenland would be an other-worldly risk extrapolation exercise with trade war proliferation (EU, Canada) being a handicapping exercise.
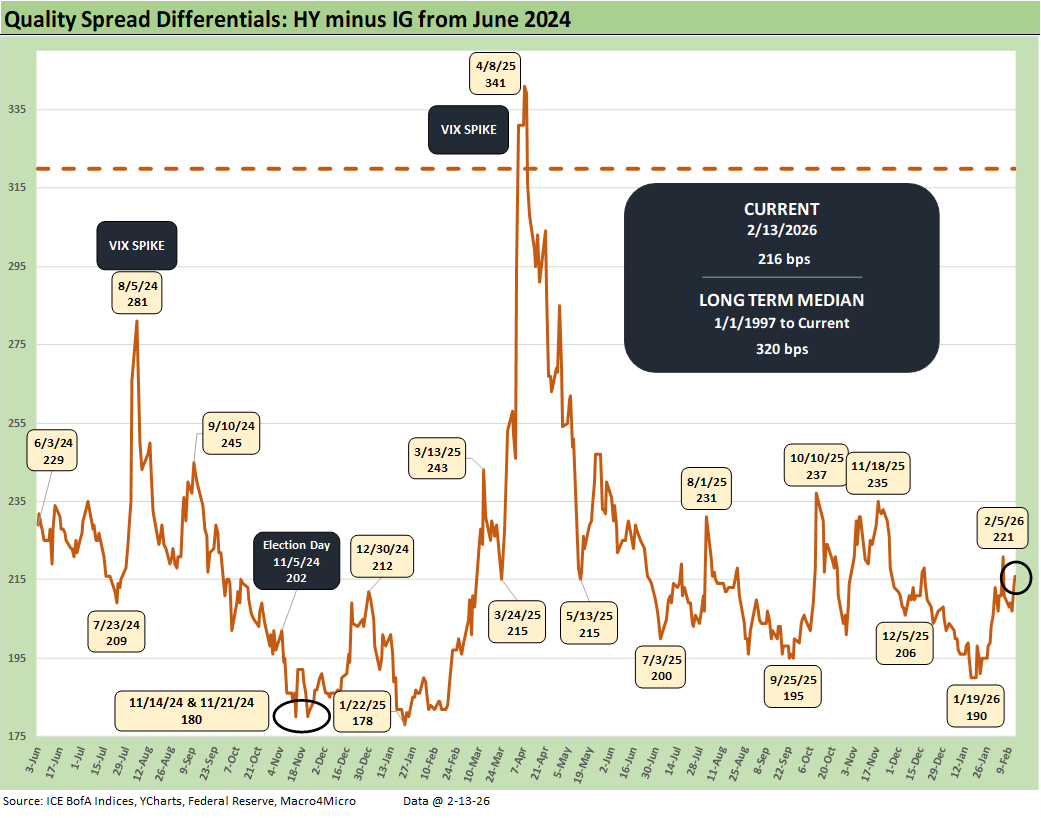
The “HY OAS minus IG OAS” quality spread differential of +216 bps remains well inside the long-term median of +320 bps. HY was +8 bps on the week while IG was +3 bps, the quality spread widening was quite mild.
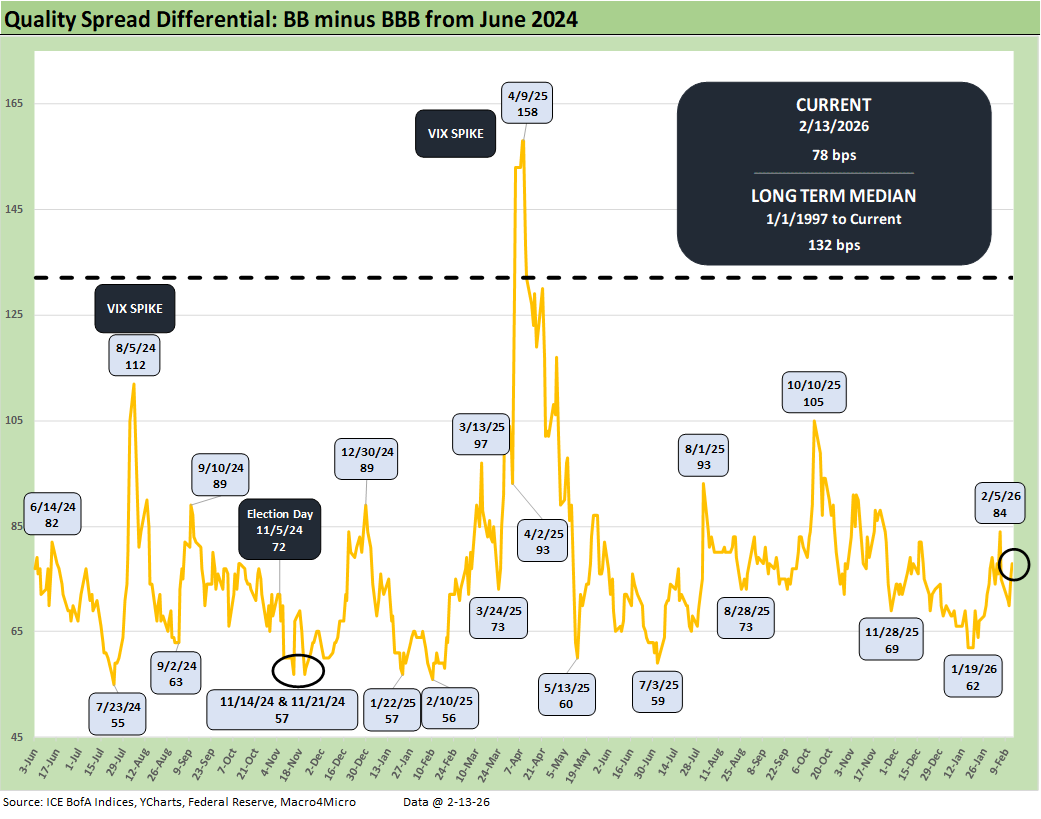
The “BB OAS minus BBB OAS” quality spread differential of +78 bps is also well inside the long-term median of +132 bps. The BB tier moved +7 bps wider on the week and BBBs +4 bps wider, so the credit spread action and risk repricing has been mild.
See also:
Market Commentary: Asset Returns 2-16-26
CPI Jan 2026: Reassuring Numbers, Missing Pieces 2-13-26
Existing Home Sales Jan 2026 2-12-26
Payrolls Jan 2026: Into the Weeds 2-11-26
Employment Jan 2026: Good Headline, So-So Mix 2-11-26
Retail Sales Dec 2025: Muted Year-End 2-11-26
Market Lookback: Monkey Business 2-9-26
Market Commentary: Asset Returns 2-8-26
Switzerland-US Trade: A Deficit that Glitters 2-3-26
US-Taiwan Trade: Risks Behind the Curtain 2-1-26
Market Commentary: Asset Returns 2-1-26
Trade Deficits: Math Challenge 1-30-26
China Trade: Shrinkage Report 1-28-26
Mexico Trade: Gearing up for More Trade Trouble? 1-27-26
Canada-US Trade: Trump Attack N+1 1-25-26
PCE Income & Outlays Nov 2025: Resilient Consumer, Higher Inflation 1-24-26
3Q25 GDP: Updated Estimate 1-22-26
Industrial Production Dec 2025: CapUte Resilience 1-17-26
Policy Mud on the Wall: Consumer Debt, Residential Mortgages 1-15-26
CPI Dec 2025: Sideways Calms Nerves – For Now 1-13-26
2025 Spread Walks and Multicycle Return Histories 1-5-26
Annual Return Differentials: HY vs. IG Across the Cycles 1-3-26
Total Return Quilt Across Asset Classes 2008-2025 1-2-26