
Existing Home Sales Jan 2026
A bad news release for existing home sales volumes down -8.4% saw all regions lower MoM. YoY median prices increased.


OK. I will settle for a 3BR, 2 bath.
Supply, affordability, mortgage rates, consumer confidence, buy vs. rent economics and a view on forward job risks are part of a big menu of macro variables to weigh.
The reality is that mortgages are sticky and thus feeds the existing supply challenge as sellers balk given what lies on the other side for the seller looking to move up, move on, or cash out.
Volumes were down year over year in all 4 major regions with a decrease MoM in the massive South region as well as in the West and Midwest MoM. Only the very small Northeast market was up sequentially MoM in volumes.
Median existing home sales prices ticked slightly higher yet again YoY to $396.8K. Median prices were up in the Northeast (+5.8%) and Midwest (+2.3%), essentially flat (+0.1%) in the South, and down (-1.4%) in the pricey West region. The West still saw prices north of $600K with the Midwest on the low end at $295.4K. The Northeast weighed in at $505.4K and South at $351.2K.
The above chart shows the sales volume delta by price tier for Jan 2026, and we see 5 of the 6 price tiers posting negative growth with only the $1M+ club slightly higher. We look at this price tier mix from a different angle in the final chart in this collection.
As we discuss in the final chart below, the market share by region appears to have some typos from NAR such as the 41.8% share for the $250K to $500K. That 41.8% market share for that price tier seems too far off the norm (usually around 45%) and the % shares don’t add to 100%. On a positive note, the conclusion on a lousy month does not change.
Mortgage rates have been stubborn as they are hovering in the low 6% area. While those rates are materially lower than the 6.87% of one year ago, the monthly payment math is still not working well for those looking to cash out, move up, or simply relocate. Expectations for a bull flattener in the UST market that would translate into low to mid 5% mortgage rates have been thwarted so far as we cover in other commentaries.
The three Fed cuts in the fall of 2025 (-75 bps) followed 3 actions (50, 25, 25) in the fall of 2024, and that in turn translated into UST curve steepening along the way (6.09% Freddie Mac as of Thursday). Back in the fall of 2024, the UST rally along the curve saw mortgage rates right around today’s level after easing while the 10Y UST dropped down to around 3.6%. That soon gave way to a steepening and tough road for mortgages into 2025 and now 2026.
Those expecting the 10Y UST to follow fed funds lower have been relatively disappointed since the easing cycle got underway, so the latest debates on FOMC actions under Warsh do not come with a sense of automatic bull flattening and lower mortgage rates.
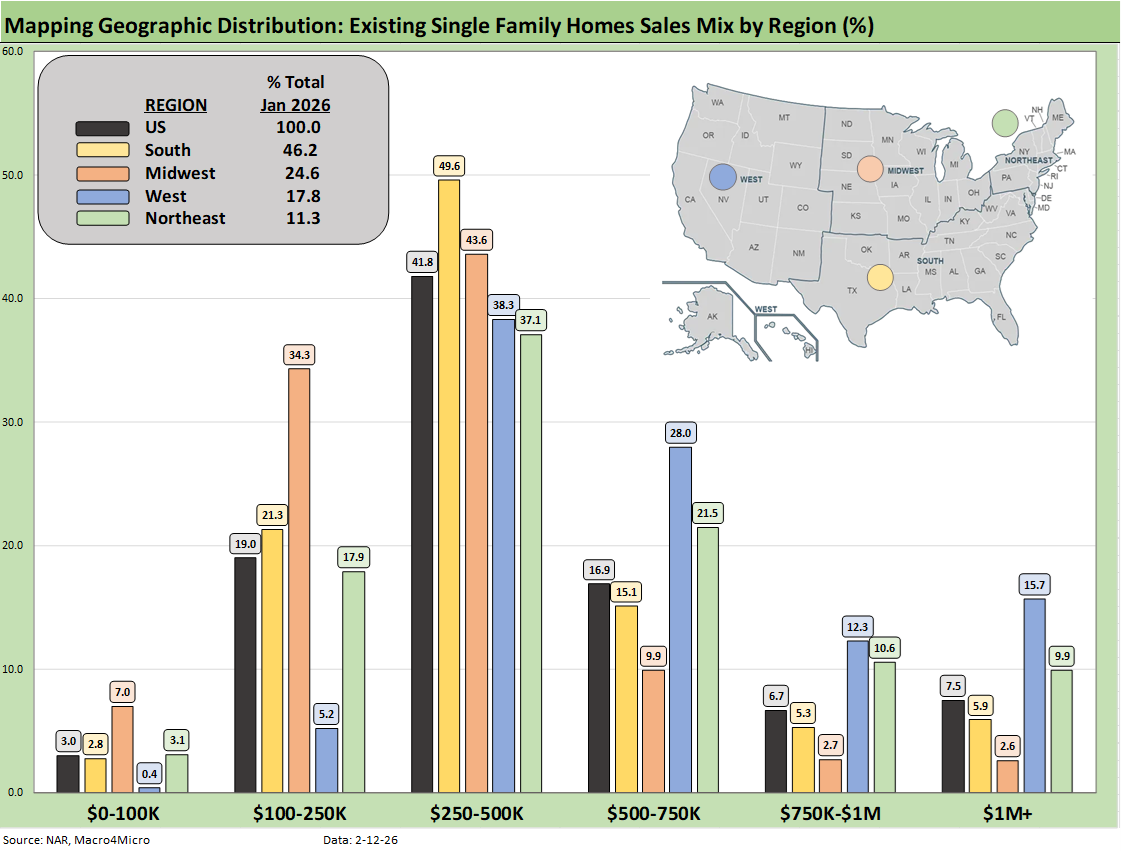
The above chart shows the geographic mix of volumes and details on price mix by region. The South is the main event in single family volumes whether new or existing at over 46%.
For the bar chart, we break out the mix for each region by price tier. For example, the South shows almost 50% (49.6%) of its existing home sales volume in the $250k to $500K range and over 15% of its sales in the $500 to $750K bucket.
The high cost of homes in the West (notably California) is clear enough just by glancing at the bar chart with almost 16% at prices over $1 million. The second highest in the $1 million club is the Northeast at almost 10%. The market share of the $1 million tier started declining recently in a good sign for the tiers below that lofty level.
We see a big concentration in the $250K to $500K although the $100K to $250K bracket for the Midwest stands at over 34%. The map explains what states are in each Census region. There is a very wide range of home price profiles in the West and Midwest states.
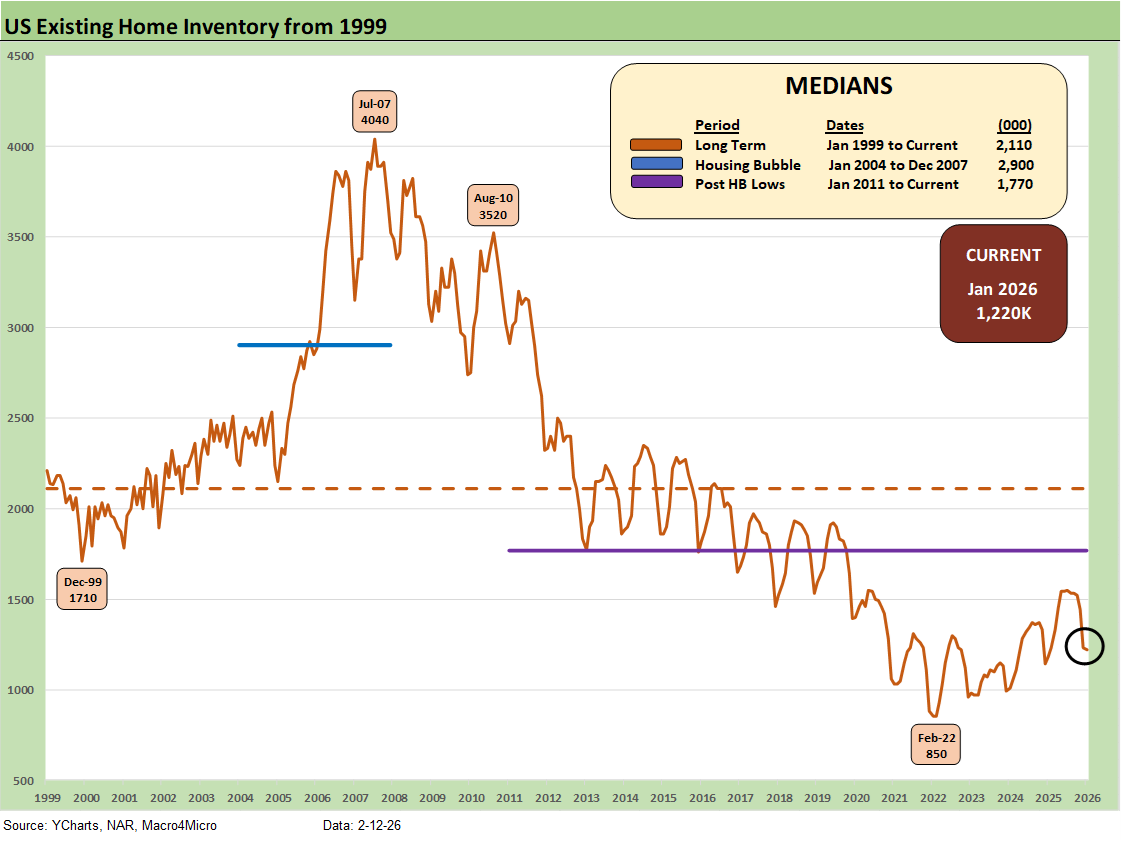
Inventory for total existing homes ticked lower MoM (as revised) to 1.22 million units for -0.8% MoM but was still +3.4% higher YoY vs. Jan 2025. Current inventory is well below longer term medians including 2.1 million for the post-1998 median. The median from Jan 2011 (homebuilding lows) to current times is 1.77 million. In other words, existing home sales inventory remains extremely low even if the level is materially higher than the stunning low of 850K of Feb 2022 ahead of the end of ZIRP in March 2022.
The existing home inventory balance had shown a steady rise off the sub-1 million lows of 2022-2023. Inventory had risen to the 1.3 million handle range in 2024 before dipping back down to a recent low of 1.14 million to close out 2024. We bounced off those numbers in 2025 to get back above 1.5 million handles before the recent move lower to 1.2 million handles.
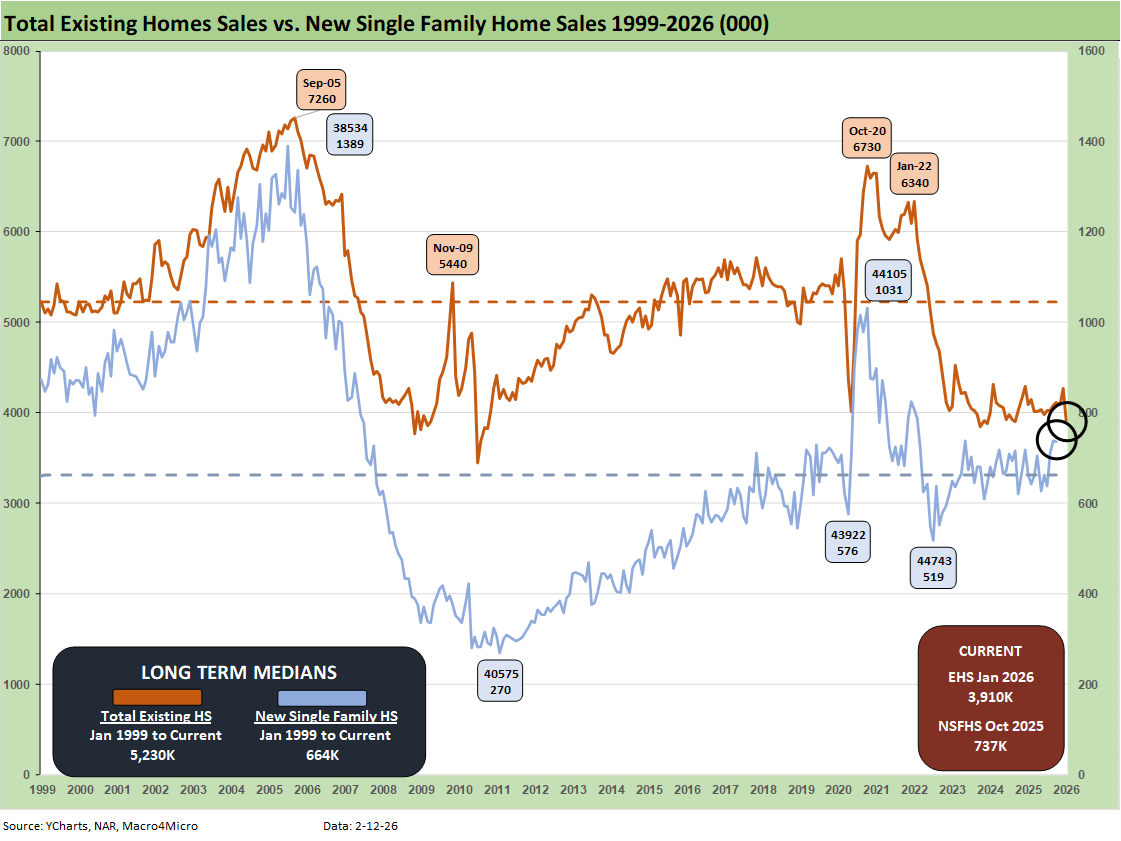
The above two-sided chart updates the trend line in total existing home sales vs. new single family homes. We had been operating without new home sales data from the Census Bureau since the shutdown, but we now have some updates (Note: the latest Jan 13,2026 release from the Census covers through Oct 2025). The Census is very slow to catch up. From what we see on the Census site, the Nov and Dec home sales should be updated next week.
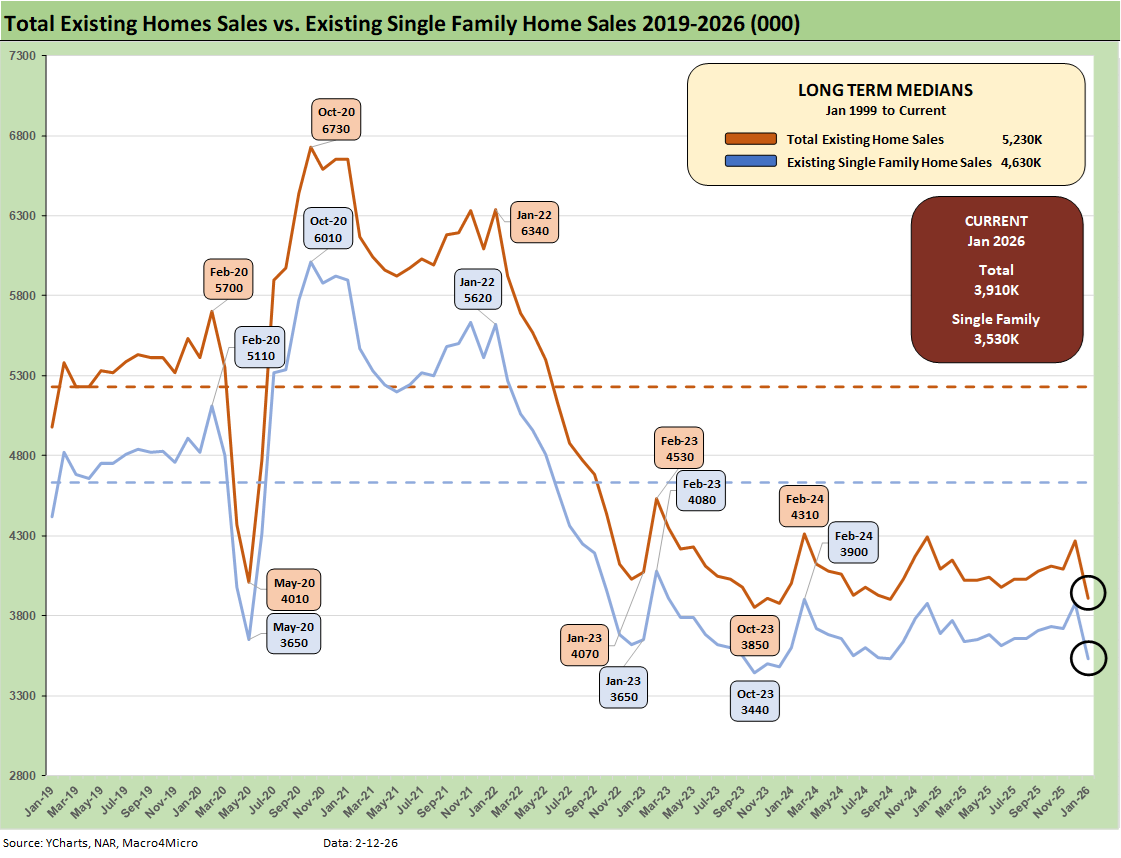
The above chart breaks out the timeline for existing single family alone of 3.53 million vs. total existing home sales of 3.91 million, which is well below the long-term median (from Jan 1999) of 5.23 million for total existing homes. Existing single family was -9.0% sequentially and -4.3% YoY (SAAR). The lower line is ex-condo/ex-coops. We saw 380K in condo and coop sales in Jan 2026, down from 400K YoY in Jan 2025 and down from 390K in Dec 2025.
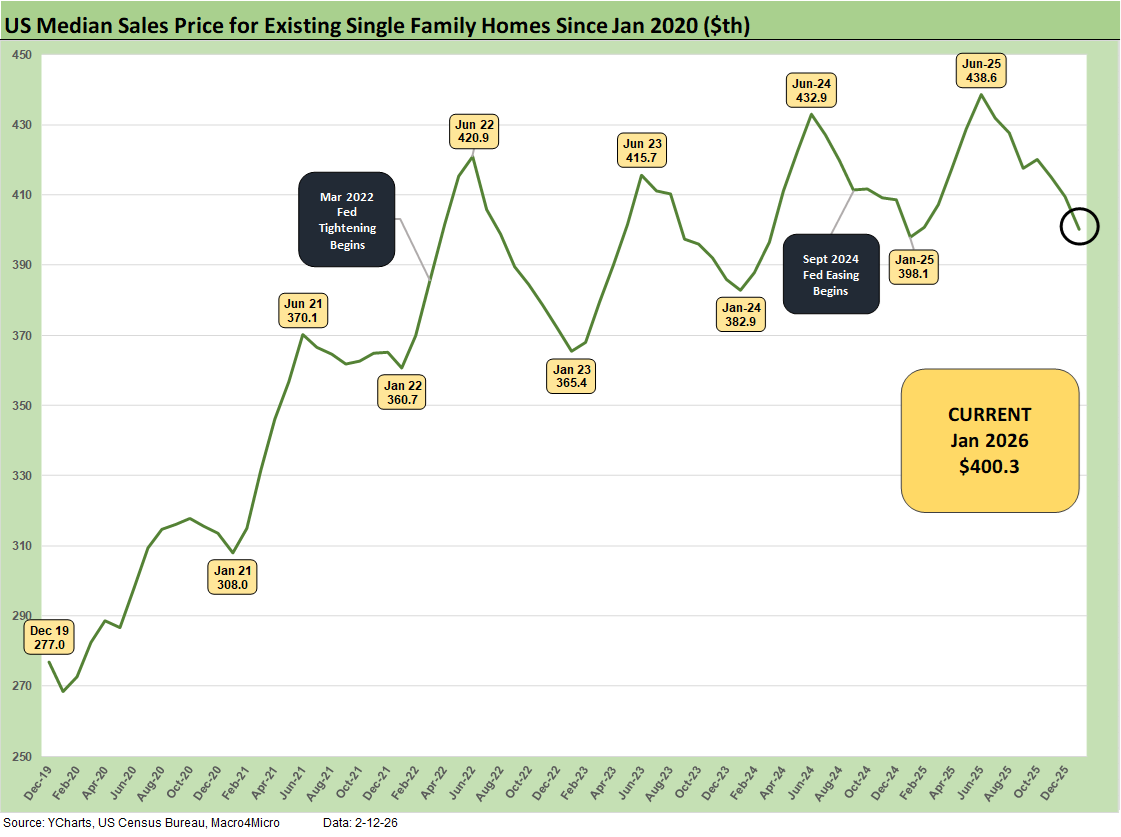
The above chart updates the median price for existing single-family homes at $400.3 K after June 2025 hit a record $438.6K. The median price in Jan 2026 is dramatically above the $308K level back in Jan 2021 and $277K in Dec 2019 when mortgage rates were in a different zip code.
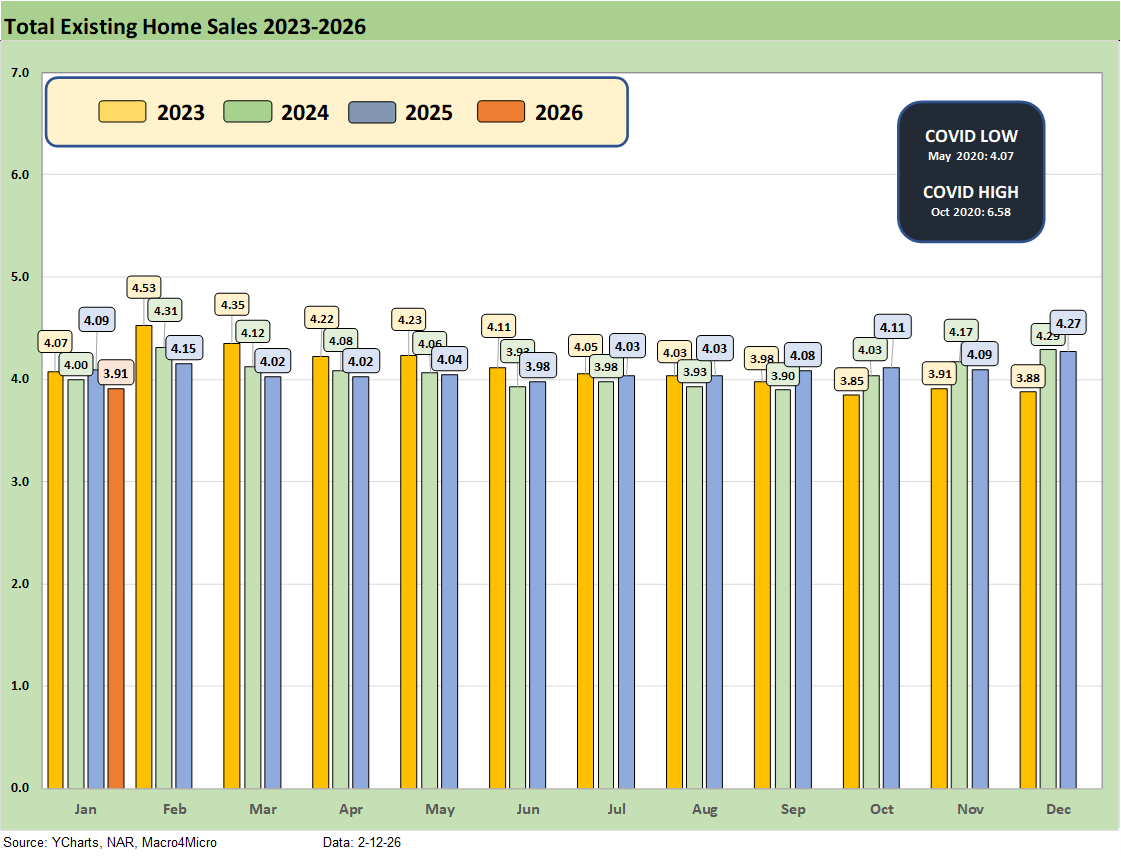
The above chart updates the monthly existing home sales across the timeline from Jan 2023 through Jan 2026. In the interest of visual quality, we had to delete the 2022 months when the market was posting 6 million and 5 million handle sales volumes in the first half of that year. The current existing home sales volume is a long way from the mid-6 and high 5 million handles of 2021 and then into early 2022 when many homeowners had refinanced and new buyers locked in low mortgages. ZIRP ended in March 2022 and then the UST migration began and dragged mortgages to highs in 2023.
The Jan 2026 total of 3.91 million is back below the May 2020 COVID trough of 4.07. We had a few more sub-4 million handles along the way as noted in the chart, so the 2023-2026 period has been brutal for real estate brokers.
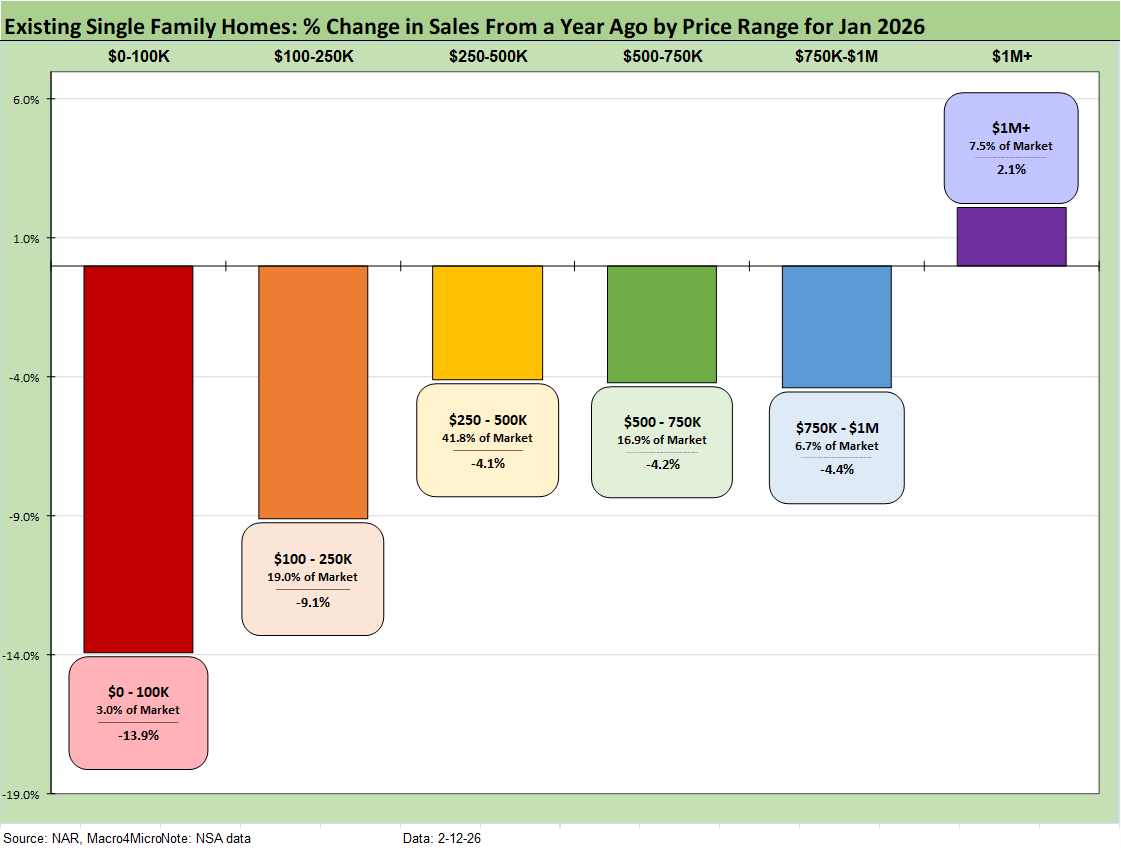
The above chart has some data quality issues as we revisit the topical area addressed earlier on the existing home sales deltas by price tier. The largest tier is the $250K to $500K at typically around 45% of sales volumes. That tier was listed at 41.8% above in the chart release earlier. We assume that there will be some corrections since the total is below 100%.
See also:
Payrolls Jan 2026: Into the Weeds 2-11-26
Employment Jan 2026: Good Headline, So-So Mix 2-11-26
Retail Sales Dec 2025: Muted Year-End 2-11-26
Market Lookback: Monkey Business 2-9-26
Market Commentary: Asset Returns 2-8-26
Switzerland-US Trade: A Deficit that Glitters 2-3-26
US-Taiwan Trade: Risks Behind the Curtain 2-1-26
Market Commentary: Asset Returns 2-1-26
Trade Deficits: Math Challenge 1-30-26
China Trade: Shrinkage Report 1-28-26
Mexico Trade: Gearing up for More Trade Trouble? 1-27-26
Canada-US Trade: Trump Attack N+1 1-25-26
PCE Income & Outlays Nov 2025: Resilient Consumer, Higher Inflation 1-24-26
3Q25 GDP: Updated Estimate 1-22-26
Industrial Production Dec 2025: CapUte Resilience 1-17-26
Policy Mud on the Wall: Consumer Debt, Residential Mortgages 1-15-26
CPI Dec 2025: Sideways Calms Nerves – For Now 1-13-26
2025 Spread Walks and Multicycle Return Histories 1-5-26
Annual Return Differentials: HY vs. IG Across the Cycles 1-3-26
Total Return Quilt Across Asset Classes 2008-2025 1-2-26