
Market Commentary: Asset Returns 2-23-26
After a rough month for tech and rotation into value, PCE inflation throws a monkey wrench into FOMC policy chatter.


How dare you?! Let’s make it 15%.
A busy week for economic releases and tariff chaos overshadows the basic reality that annual GDP for 2025 (2.2%) was down from 2024 (2.8%) with personal consumption expenditure growth lower in 2025 (2.7%) vs. 2024 (2.9%) and fixed investment growth lower in 2025 (+2.7%) vs. 2024 (+3.0%). As far as Golden Ages go, 2025 is in a different block on the periodic table. The 4Q25 GDP numbers were subpar also (see 4Q25 GDP (Advance Est.): Less Distortion This Time 2-20-26).
Higher PCE inflation marked a setback on Friday with the headline PCE price index rising to 2.9% from 2.8% and Core PCE moving to 3.0% from 2.8%. Interest rate sensitive sectors saw that flow into weekly returns for subsector and industry ETFs (see PCE Income & Outlays Dec 2025: Inflation Reversal? 2-20-26).
The asset return picture the last week was solid and steady despite the headlines, but the FOMC handicapping is showing higher odds of no change in April and June as the consumer appears to be steady with PCE outpacing DPI in the Friday release even though the 4Q25 advance estimate of 2.4% for PCE was down from 3Q25 and well below 3Q24 and 4Q24.
The trade policy wonks are working their way through the numbers on the SCOTUS IEEPA smackdown, but Trump has always had myriad laws on the books where Congress had delegated their constitutional control of tariffs to the Executive branch. The main distinctions are behavioral and in terms of negotiating leverage since Trump just cannot threaten a 200% tariff on French wine at his whim (he has actually done that before).
Process and law and timelines will rule tariff economic risk while screwing up the ability of capital budgeting pros to plan. That is not an aphrodisiac for reshoring/onshoring capex. The USMCA review also lurks. The Section 122 path limits the tariff rate and the timeline and needs to eventually go to Congress during an election year. The Section 301 and 232 gambits have been actively used since Trump 1.0, so tariff chaos will still reign. That said, there are clear and specific legal statutes and not just mood swings. My favorite Section 232 national security tariff is upholstered furniture (guard against the terrorist threat of uncomfortable chairs).
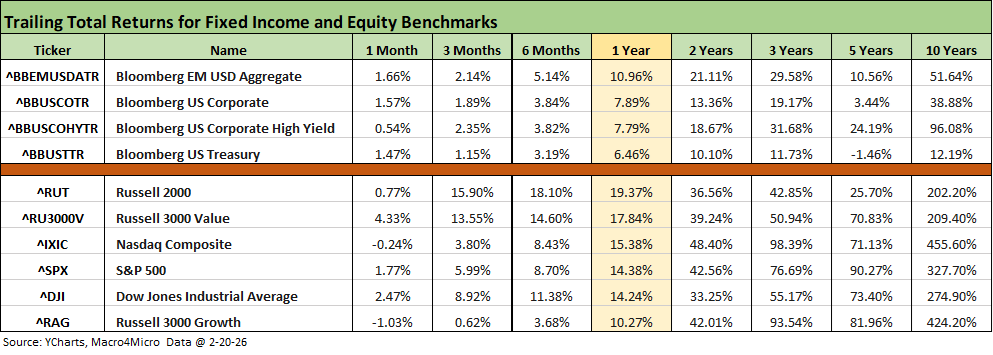
The above table updates the benchmarks for the debt and equity markets we monitor. We see the debt benchmarks in positive range across recent timelines while equities have seen value beat growth the past month on the AI chaos and sudden wave of second-guessing on winners and losers. Investors are struggling to find the sweet spot on valuation metrics in a sector rife with the speculation that is intrinsic to longer term forward valuation models.
The credit spread backdrop remains mired in the range of past credit cycle peaks and notably in HY where the OAS is below the high end of the June 2007 bubble month. HY OAS is +17 bps wider on the month and -9 bps tighter on the week at +286 bps. As we have covered in numerous past commentaries, that HY OAS is dramatically inside the long-term median of around +455 bps.
The rolling return visual
In the next section, we get into the details of the 32 ETFs and benchmarks for a mix of trailing periods. Below we offer a condensed 4-chart view for an easy visual on how the mix of positive vs. negative returns shape up. We see it as a useful exercise in looking for signals across industry groups and asset classes.
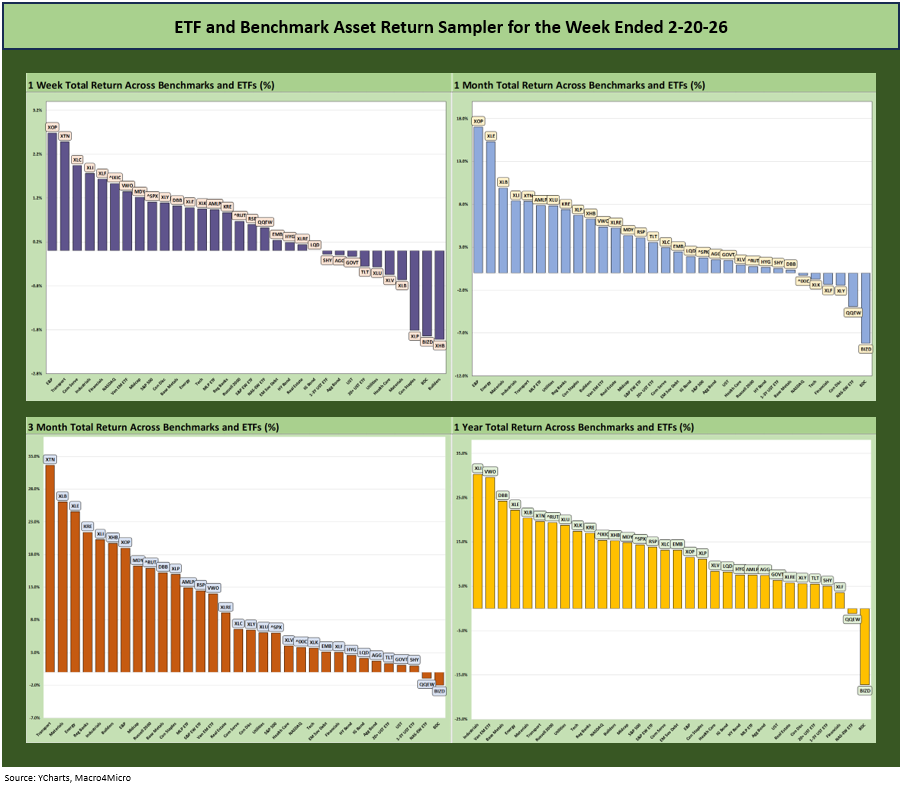
The return symmetry has been favorable despite the recent beatdown of so many tech or tech-centric names. We cover the time horizons and mix details below, but it is hard to see much bad news in the above mix as earnings growth has been impressive and overall economic metrics are at worst constructive despite weaker GDP growth and mindset erosion in inflation.
Trump’s reaction to a clear violation of traditional tariff law as practiced under IEEPA is not helping confidence in his next round of reactions. IEEPA mitigates Trump’s ability to indulge himself in negotiation by Truth Social. The SCOTUS move to 15% also appears to limit his ability to counter trade retaliation with nuclear proclamations (100% and 200% threats, etc.). Of course with Trump that could get tested. We’ll undoubtedly get an earful about the “Greatest Economy in History” built around tariffs in tomorrow night’s State of the Union address.
The Magnificent 7 heavy ETFs…
Some of the benchmarks and industry ETFs we include have issuer concentration elements that leave them wagged by a few names. When looking across some of the bellwether industry and subsector ETFs in the rankings, it is good to keep in mind which narrow ETFs (vs. broad market benchmarks) get wagged more by the “Magnificent 7” including Consumer Discretionary (XLY) with Amazon and Tesla, Tech (XLK) with Microsoft, Apple, and NVIDIA, and Communications Services (XLC) with Alphabet and Meta.
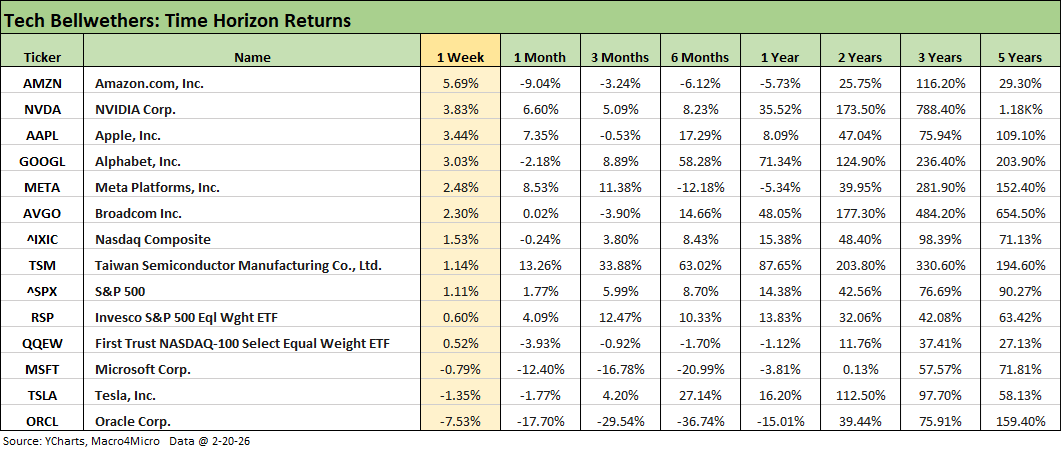
The tech bellwether checklist above shows some comebacks from the recent weakness with 5 of the Mag 7 in the top 5 slots and those 5 better than NASDAQ and the S&P 500. We saw only 3 names from this group in negative range for the week with Microsoft, Tesla and Oracle.
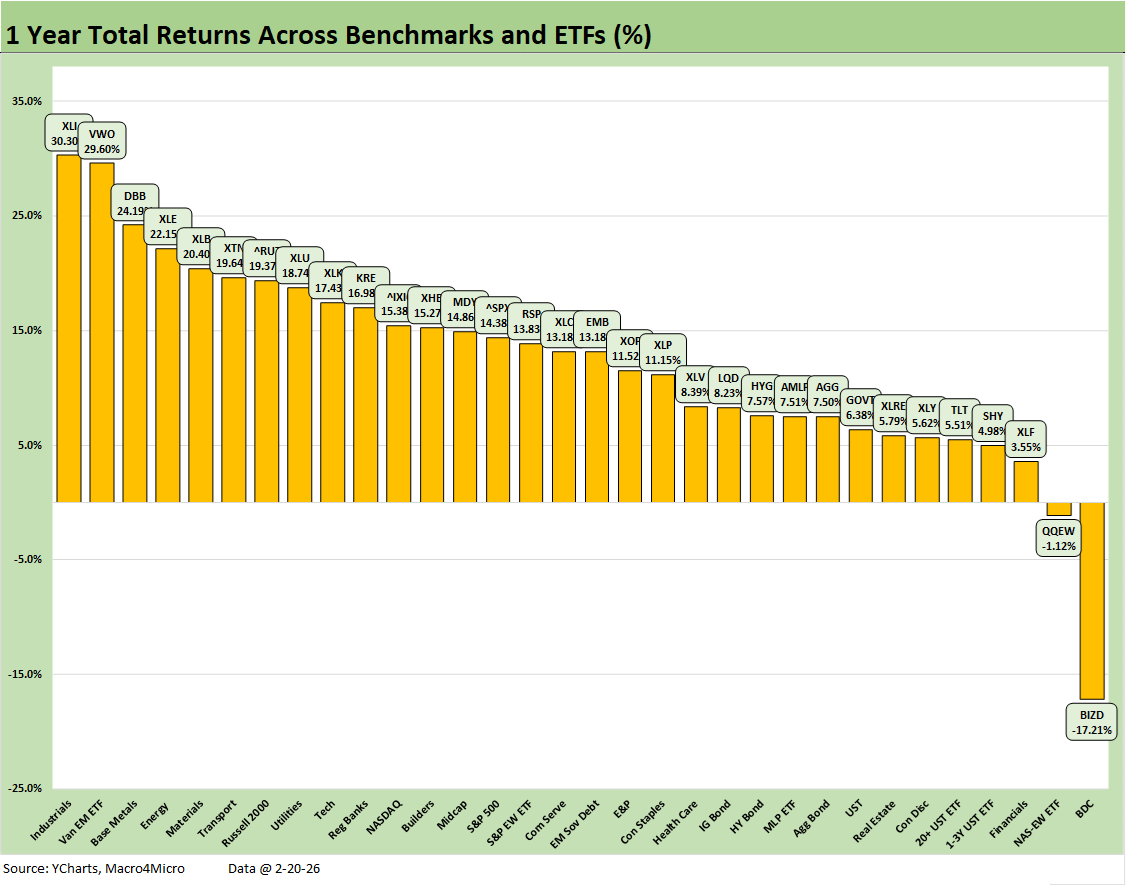
The text below is essentially a cut-and-paste of a LinkedIn post on this chart:
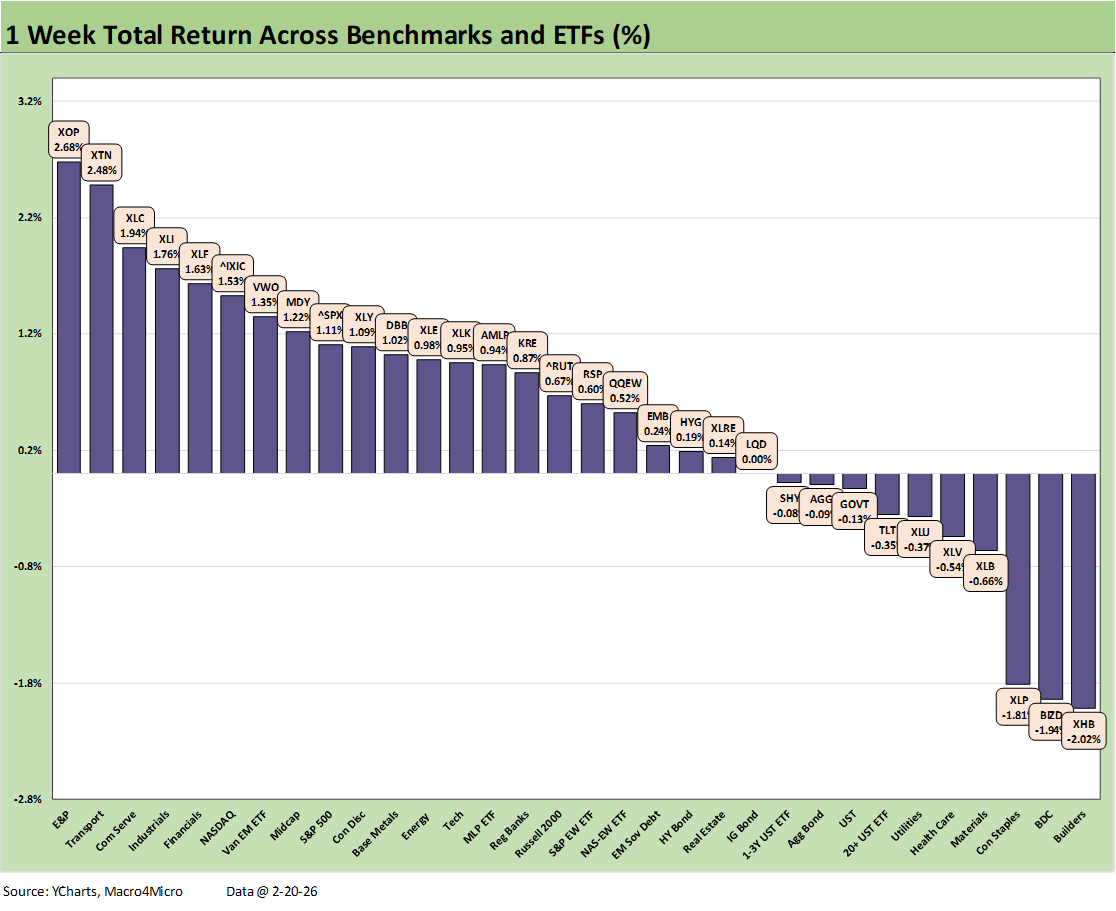
The dominant headlines for the week revolved across SCOTUS ruling against Trump on IEEPA, but the weaker GDP numbers and rising PCE inflation metrics were more immediate and clearly defined variables in terms of the story they told about the curve and sea level industry fundamentals.
The fact that the annual 2025 GDP growth number was only 2.2% vs. 2.8% in 2024 got little headline play with the noise around the IEEPA decision and some White House rage. The unfavorable PCE inflation release shows up in some weaker performers in the chart.
We see our group of 32 benchmarks and ETFs weigh in with a solid score on the week at 22-10 favoring positive with the 4 major benchmarks all positive with two in the top quartile (NASDAQ and Midcaps) and two in the 2nd quartile with the S&P 5000 at the top of the 2nd quartile and Russell 2000 at the bottom of that tier.
The winners at the industry level included E&P with Iran a major X factor. The tech line items also were attempting comebacks on the week with Communications Services (XLC) and NASDAQ back in the top tier. For cyclicals, we see Transports (XTN) and Industrials (XLI). That diversified mix of subsectors was not signaling cyclical worries.
The losers on the week include a heavier mix of lines with interest rate risk and duration exposure including two UST ETFs (GOVT, TLT) along with Homebuilders (XHB) and dividend sensitive equity ETFs such as Utilities (XLU) and Consumer Staples (XLP). The private credit headlines with a focus on OWL and the loan sale commentaries kept the private credit market nervous even though loan sales were pitched as “proving par markets” and showing support from the major institutional bidders.
With inflation anxiety a critical variable around FOMC easing timing and how a UST curve steepener might play out, the stubborn PCE price index this week was clear in the monthly PCE (Income & Outlays) release and also in the PCE price index disclosure with the GDP release for 4Q25.
In the GDP report, the annual PCE price index for gross domestic purchases rose to +2.6% in 2025 from 2.4% in 2024. For the 4Q25 period alone, the same metric rose to +3.7% from +3.4% in 3Q25. In the separate PCE report, the headline number rose to 2.9% from 2.8% and Core PCE price inflation to 3.0% from 2.8%. On a day when GDP was weaker, rising inflation was not good news. FedWatch saw the odds of no FOMC action in April rise to 82.1% (Monday) from 70.1% the prior week. For the June FOMC meeting, the odds of no cut rose to 48.0% (Monday) from 31.4%.
The PCE pressure plus a constructive, balanced set of signals overall last week from macro and micro releases (industrial production/durable goods, mixed GDP, PCE outpacing DPI, new home sales, etc.) and earnings (e.g. WMT) leave the market with plenty of moving parts to digest as it try to sort out what comes next after SCOTUS shot down IEEPA.
The text below is essentially a cut-and-paste of a LinkedIn post on this chart:
The tech recovery this past week does not clear up a lot of speculative moving parts, and companies will have their work cut out to help ease the fear factor around business models and how much damage AI might do.
We will get a key industry earnings report this week with NVIDIA, but now Salesforce (CRM) will also be a focal point. CRM has always been a hot name but now it gets attention for the anxiety around the AI multiplier effects on SaaS players. The doom scenarios being spun are a reaction to AI fallout and what that might mean for other tech sectors from semis to software to business services.
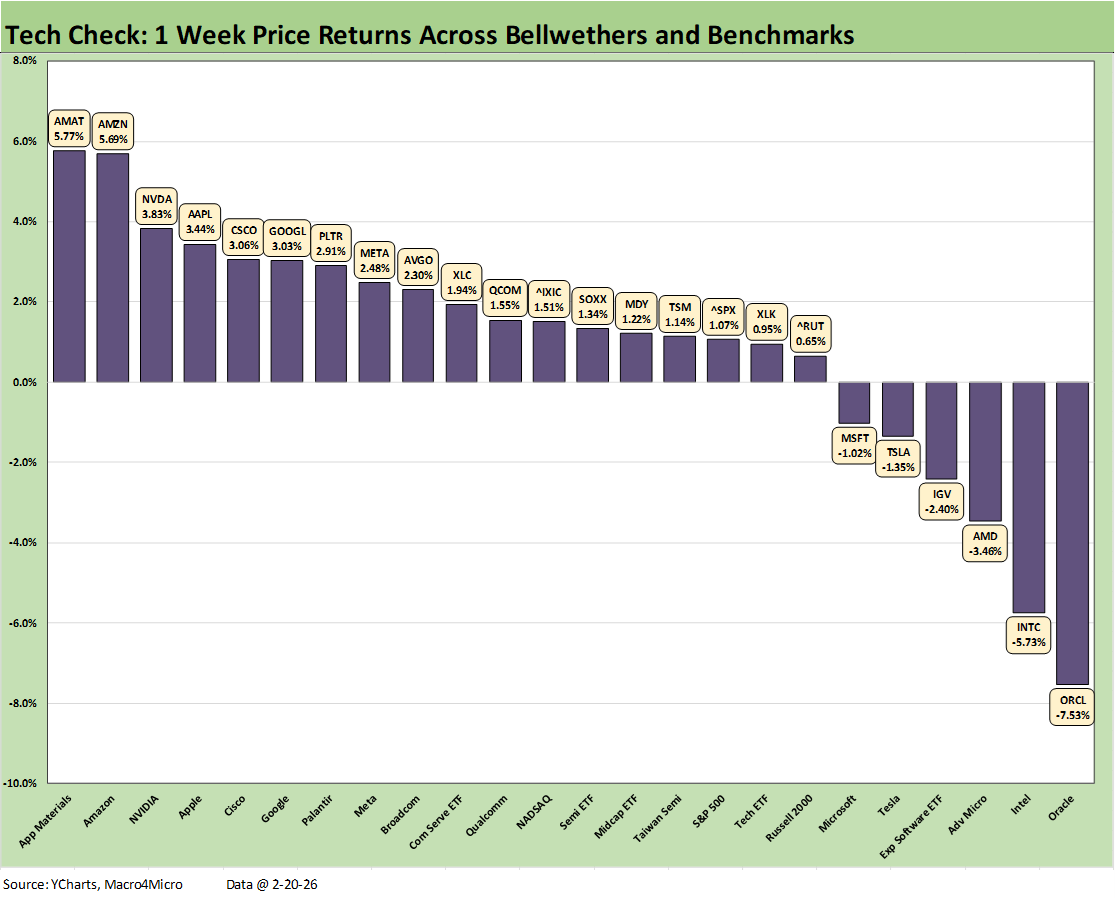
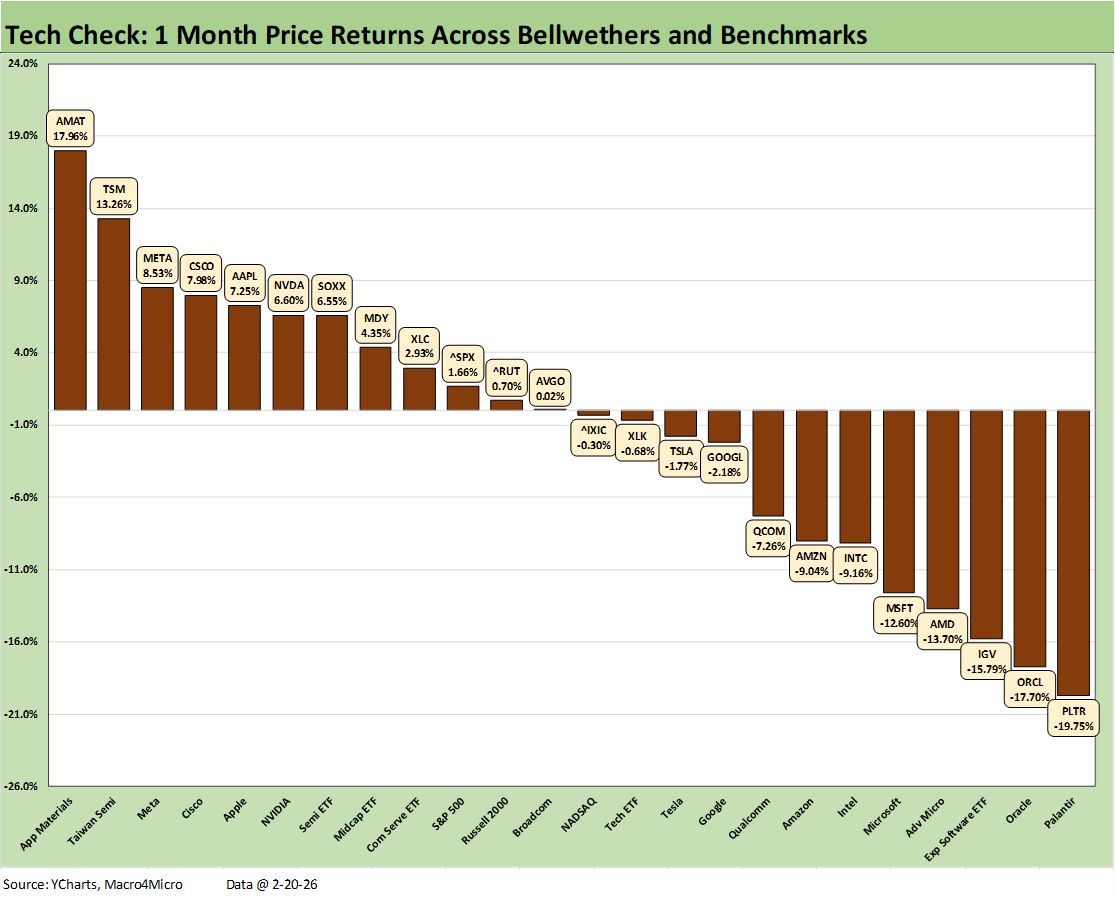
The chart updates the group of 24 asset lines we look at as part of a “tech check” we started doing a few weeks ago with tech chaos and fears around more drastic divergence within and across the tech bellwether universe. That case of nerves has spread with a vengeance to private credit as well as equity markets with so many software names leveraged up on the basis of high margins and recurring cash flows.
This week saw a score of 18-6 positive vs. negative in this mix of 24 names. That score is moving in the right direction relative to the 12-12 score over the trailing 1-month timeline. Oracle is on the bottom again this week and it is one off the bottom for the 1-month period. The 1-month (not shown) sees Palantir on the bottom. PLTR YTD has generated a -23.9% price performance.
The 1-week chart shows Applied Materials on top again at +17.9% along with some legacy leaders in the top quartile such as Taiwan Semi, Meta, Cisco, Apple, and NVDA. The score includes 5 of the Mag 7 in positive range with 4 of the 7 in the top quartile.
Negative returns on the week were seen at MSFT and TSLA in the Mag 7 with Oracle in last at -7.5%. The software ETF (IGV) was in the red zone, and IGV is 3 off the bottom for the trailing 1-month at -15.8% with only ORCL (-17.7%) and PLTR (-19.8%) worse.
We may need to revamp and expand this list to add some content/analytics/data SaaS players. For YTD price returns (2-20-26 close), we would note such examples as S&P Global (SPGI) at -20.1%, Salesforce (CRM) at -30.1%, FactSet (FDS) at -32.8%, and Intuit (INTU) at -42.6%.
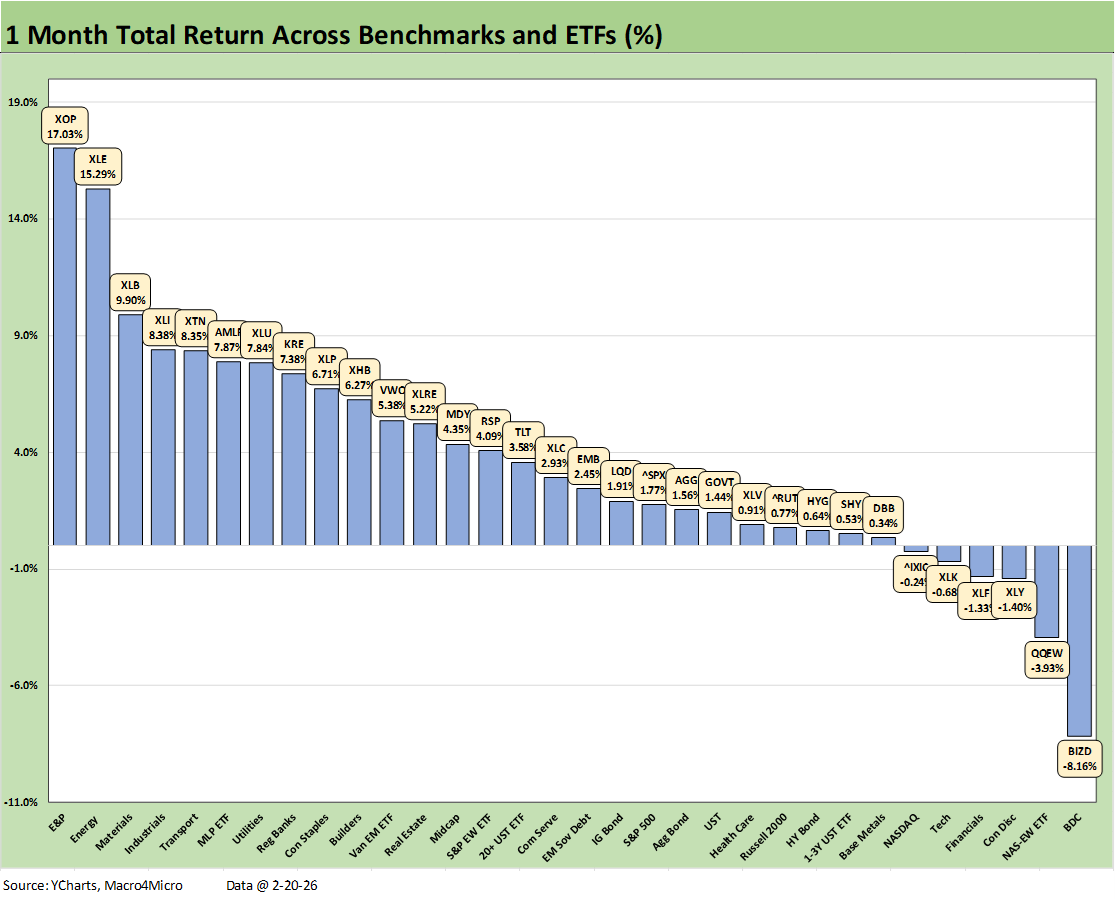
The 1-month score for the 32 benchmarks and ETFs shows 26-6 with weakness in tech the main theme on the loser side of the ledger. The BDC ETF (BIZD) sits in dead last again as tech and software weakness and SaaS business services took a beating and piled onto the existing fears around private credit that had been boiling over after the high-profile credit blowups that brought Jamie Dimon to utter the dreaded “cockroach” theory. The concentration of software issuers or SaaS-based borrowers has received nonstop coverage in recent days.
We see the Equal Weight NASDAQ 100 ETF (QQEW) in second to last, the Amazon-heavy Consumer Discretionary ETF (XLY) in the red, and the Tech ETF (XLK) and NASDAQ also sitting in the bottom tier of negative names. The broad Financial ETF (XLF) has also been feeling the second-guessing of tech exposure hitting major asset managers with XLF lagging badly of late. Meanwhile, Regional Banks (KRE) are at the bottom of the top quartile.
The running 1-month “tech check” posted a score of 12-12, which is still ugly even if improved from 7-17 last week. Palantir remains mired in last place with 5 asset lines in negative double digits. The worst laggards also include Oracle, the Software ETF (IGV), Advanced Micro (AMD), and Microsoft (MSFT).
Applied Materials (AMAT) is on top as investment programs will surge, Taiwan Semi is well set at #2, and then we see some of the legacy leaders in the remainder of the top tier including Meta, Cisco, Apple and the Semi ETF (SOXX).
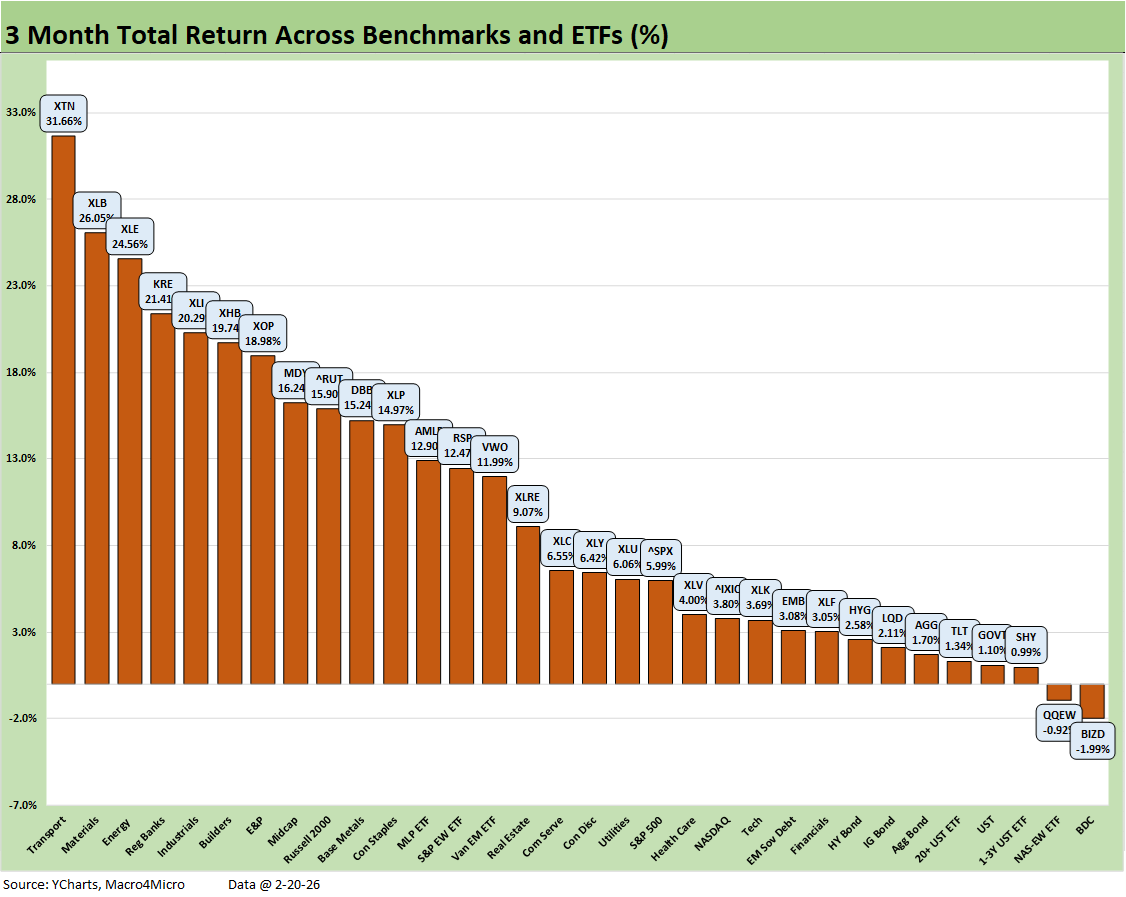
The 3-month returns for the group of 32 weighed in at 30-2 with BIZD in last place, only posting a mild -1.99% return. The bottom quartile includes 6 of the 7 bond ETFs with EM Sovereign bonds (EMB) making it into the third quartile.
We see Midcaps and Russell 2000 small caps well ahead of the large cap S&P 500 and NASDAQ. Midcaps made the top quartile while the Russell 2000 just missed.
The sector rotation dynamics shut tech out of the top quartile with Transports at #1, Materials at #2, two energy names (XLE, XOP), Regional Banks (KRE), and Industrials (XLI) in the mix. Interesting twist is that Homebuilders (XHB) made the top tier for 3 months before resuming a fade with this past week’s bad inflation numbers and some new curve anxiety.
1 year seems like a very long time with post-election policy implementation and a tariff wave joining a musclebound foreign policy strategy (hold that thought on Iran risk and geopolitics). With a pay-to-play UN substitute (Board of Peace) under Trump’s control in process; the relationships with the EU a disaster; Canada and Mexico about to be under siege (literally in Mexico’s case) in the USMCA review; and the post-SCOTUS evolution of tariffs underway, there is much to play out in coming weeks.
See also:
New Home Sales Dec 2025: Fresh Game Clock 2-21-26
PCE Income & Outlays Dec 2025: Inflation Reversal? 2-20-26
4Q25 GDP (Advance Est.): Less Distortion This Time 2-20-26
2025 trade Deficits: Reality vs. Rhetoric 2-19-26
Industrial Production Jan 2026: Capacity Utilization Trends 2-19-26
Home Starts Dec 2025: Wrapping a Weak 2025 2-18-26
Market Lookback 2-17-26
CPI Jan 2026: Reassuring Numbers, Missing Pieces 2-13-26
Existing Home Sales Jan 2026 2-12-26
Payrolls Jan 2026: Into the Weeds 2-11-26
Employment Jan 2026: Good Headline, So-So Mix 2-11-26
Retail Sales Dec 2025: Muted Year-End 2-11-26
Market Lookback: Monkey Business 2-9-26
Switzerland-US Trade: A Deficit that Glitters 2-3-26
US-Taiwan Trade: Risks Behind the Curtain 2-1-26
Trade Deficits: Math Challenge 1-30-26
China Trade: Shrinkage Report 1-28-26
Mexico Trade: Gearing up for More Trade Trouble? 1-27-26
Canada-US Trade: Trump Attack N+1 1-25-26
Policy Mud on the Wall: Consumer Debt, Residential Mortgages 1-15-26
2025 Spread Walks and Multicycle Return Histories 1-5-26
Annual Return Differentials: HY vs. IG Across the Cycles 1-3-26