
Employment Jan 2026: Good Headline, So-So Mix
Employed count higher and unemployed count lower sent unemployment rate ticking down MoM to 4.3% from 4.4% (4.0% in Jan 2025).


The jobs just keep coming…
With mixed payroll color from Challenger and ADP, the BLS weighed in with a solid +130K adds in the Establishment Survey. The Household Survey posted a sequential MoM increase in the employed ranks of +528K and lower Unemployed count of -141K as the civilian labor force grew by 387K.
Manufacturing at least generated a positive number at +5K but moved lower by -83K YoY. Durable Goods rose by 9K but was down by -49K YoY vs. Jan 2025. Nondurable goods ticked slightly lower by -4K MoM. Within the “goods producing” category, construction rose by +33K with “nonresidential specialty trade contractors” the main mover at +25.1K of the +33K.
The tariff-driven reshoring theme for manufacturing will take time and lag under the best of circumstances, but the net growth numbers are hard to find across the two-way traffic of the occupation lines.
In services, we saw “financial activities” decline by -22K and “transportation and warehousing” down by -11.2K with “professional and business services” offsetting that with +34K.
Healthcare and social assistance rose by +123.5K as the services mix still leads the payroll numbers with an intrinsically lower level of economic multiplier effects. Leisure and hospitality weighed in at only +1K as “arts, entertainment, and recreation” faded by -15.6K and “accommodation” at -10.6K. “Food services and drinking places” were +27.8K. Old age and infirmities remain key drivers in payroll counts (The trick is paying for health care or making decisions on other cuts).
Government moved lower by -42K with Federal at -34K and State at -18K and Local at +10K.
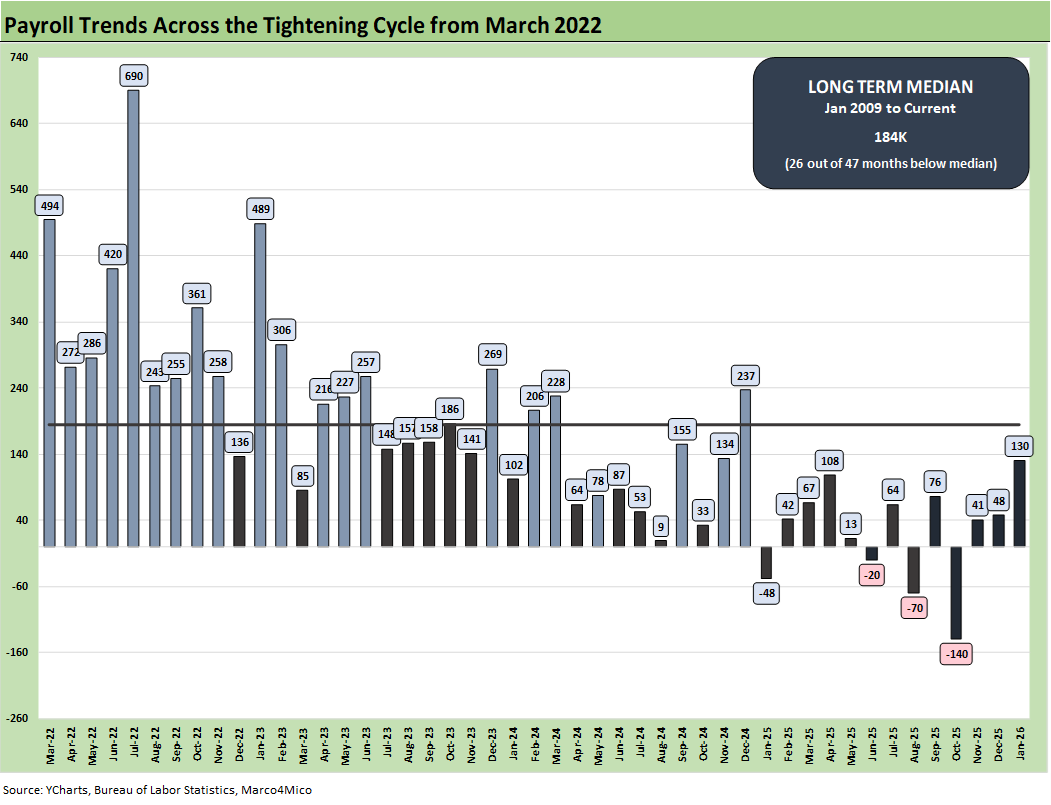
The monthly payroll adds/declines chart above starts in March 2022 with the end of ZIRP and start of the tightening cycle. The bar chart tells an objective data story. The 130K for Jan 2026 is a solid number by 2025 standards. That said, the numbers in 2025 include the only 3 negative deltas on the chart. Furthermore, the 2025 months are all below the post-Jan 2009 median of 188K. That period includes a slice of the longest recession since the Great Depression. Those payroll numbers from Jan 2025 to Jan 2026 offer little room for an end zone dance (or a Golden Age spike) celebrating the jobs score.
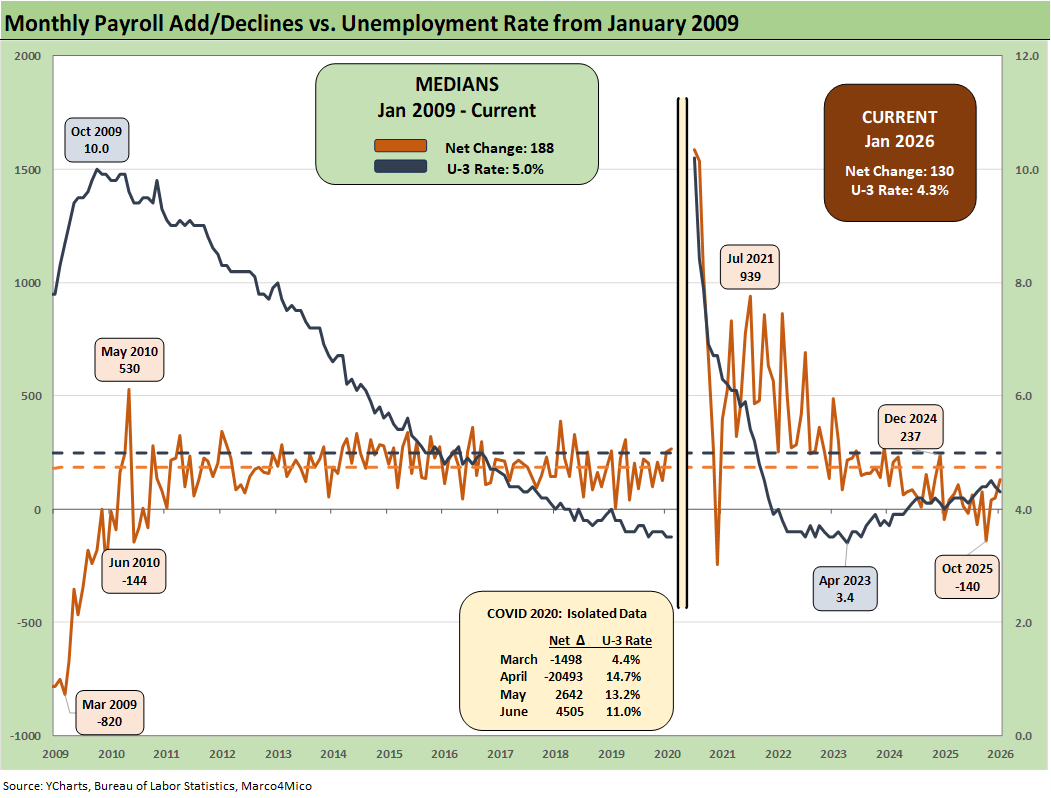
The above chart plots the running job adds/declines since Jan 2009 against the unemployment rate, which ticked lower to 4.3% from 4.4% in December. In the chart, we isolate the worst months of the COVID dislocations in the box for better visuals to capture the other periods. The 4.3% U-3 is still below the long-term median of 5.0%. In past cycles, the 4.3% number would be considered full employment. Payroll has been struggling somewhat in relative terms, but history is kind to 4.3%.
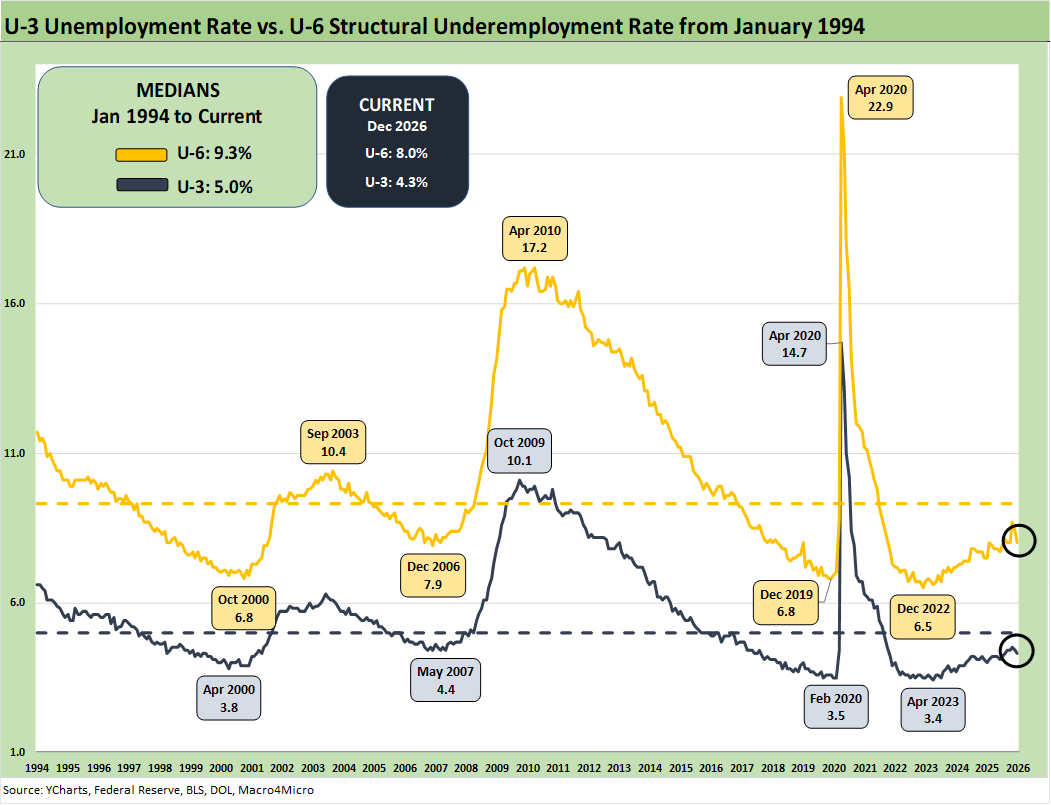
The above chart updates the time series for the U-3 unemployment rate and U-6 structural underemployment rate across the years from 1994. As noted, the current U-3 rate ticked lower to 4.3% for Jan 2026 from +4.4% in December 2025. The Jan 2026 unemployment rate is up from 4.0% in Jan 2025 so the YoY trend is unfavorable.
As a reminder, the U-6 metric is defined with the numerator as “total unemployed + persons marginally attached to the labor force + total employed part time for economic reasons.” The denominator is “civilian labor force + workers marginally attached to the labor force.”
The U-6 is the structural underemployment metric that is always useful to watch. The U-6 jumped to 8.7% in Nov 2025 from 8.1% in Sept 2025. To start 2025, the U-6 rose sharply in Feb 2025 to 8.0% from 7.5% in Jan 2025. The current 8.0 % is well above the 6% handles seen in spring of 2023 but is now at least declining again. The U-6 is still below the median from 1994 of +9.3%, which notably includes the post-crisis shock and the longest recession since the Great Depression.
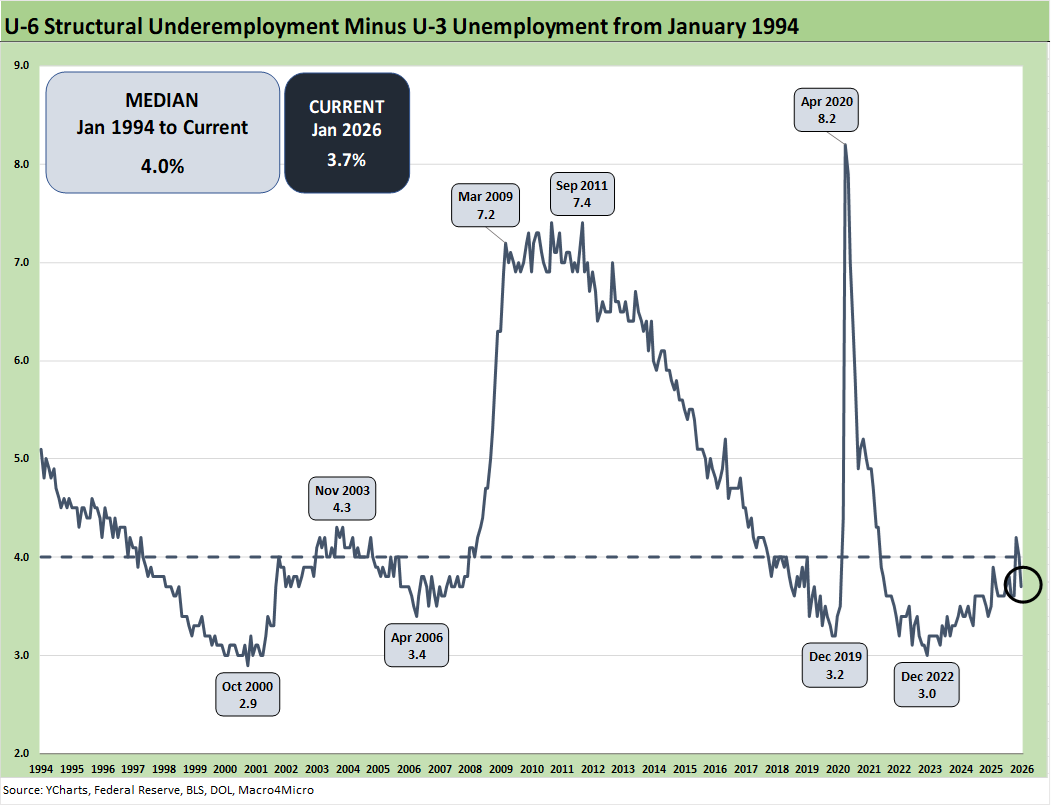
The time series above updates the U-6 minus U-3 differential as a measure of relative employment quality and to flag risks of major dislocations in large swaths of the economy (think oil patch collapse in the late 1980s, tech bubble imploding 2001-2003, financial services and automotive meltdown in 2009).
The current 3.7% differential is back below the long-term median of 4.0%. The job ranks are still vulnerable now but are also in a mixed period where tariffs are still getting worked out with trade partners and the courts.
Many questions will get answers with respect to how tariffs will flow into working capital cycles and new capacity planning. For example, we are seeing major plans to relocate automotive OEM capacity back to the US. That should attract more supplier chain capex. The auto supplier to OEM chain will be a focal point in the upcoming USMCA review process.
In contrast, the idea of a major new aluminum smelter in the US will not happen based on economics and the timeline to build one. Low-cost power is essential for such smelting activities and data centers would be happy to pay a multiple of what an aluminum smelter would see as cost effective. There are a lot of stories along the manufacturing chains with some good and plenty bad. For now, manufacturing payrolls are “net bad.”
Some of the risk issues get swept up in immigration and deportation numbers, but the analysis always comes back to the number of workers with paychecks. Employers will be making decisions to mitigate the tariff damage if they are not passing along the cost in prices or want to limit the scale of the price increase to customers.
There is no hiding from the need for economic reactions along the supplier to customer ecosystem. Someone always pays – including those “paying” with layoffs in tariff cost mitigation decisions.
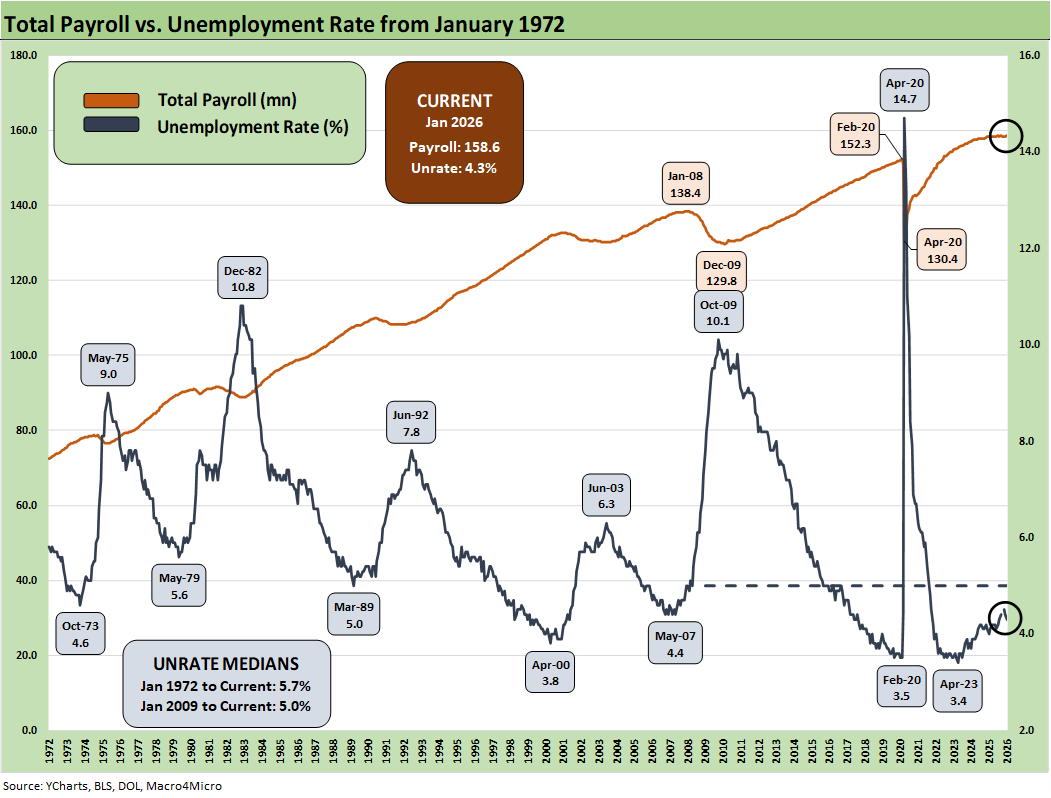
The above chart updates total payroll vs. the unemployment rate. More bodies with more paychecks are always a good thing. The trick from here is how the consumer deploys that paycheck and whether the zero-sum realities of household budgets undercut spending.
We see the ranks of employed in Jan 2026 grow by 528K in the Household Survey. That tells a good story. The +130K in Nonfarm Payroll in the Establishment Data is at least moving sharply in a better direction as detailed in an earlier chart.
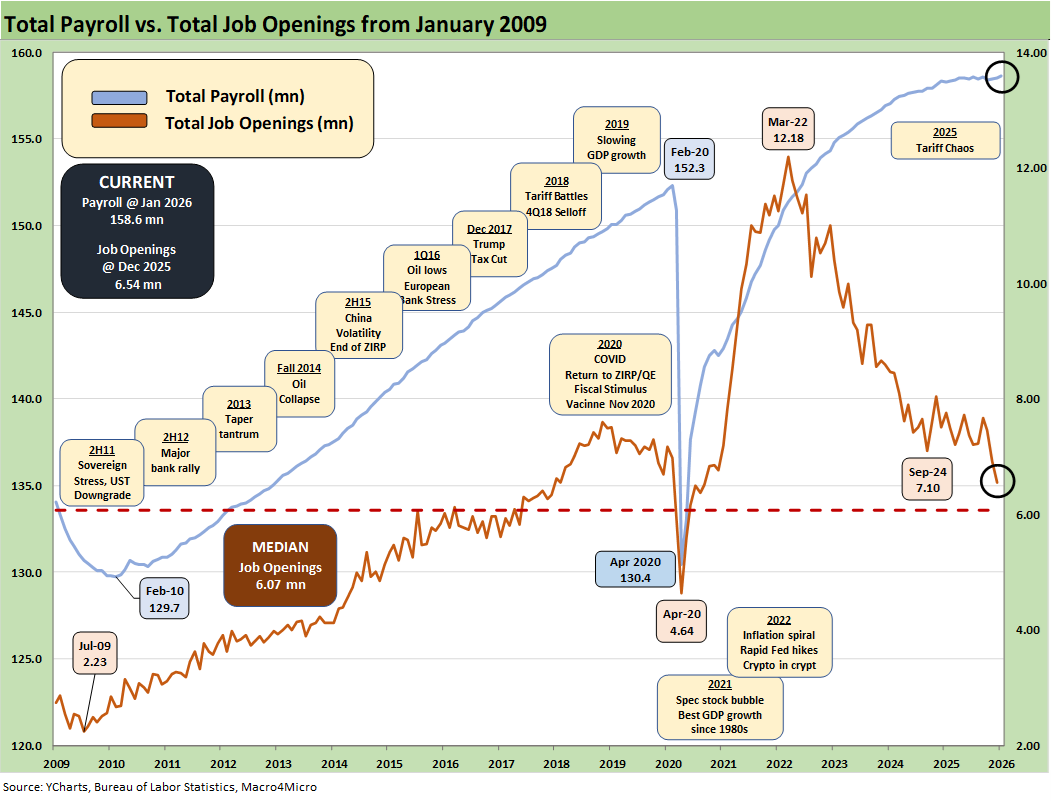
The above chart updates the total payroll number vs. job openings. JOLTS data analysis is still recovering from the shutdown, but we saw Challenger data and ADP numbers painting very guarded payroll color. The Dec 2025 Job Opening data was down by almost 1 million (966K) from Dec 2024 to 6.54 million. On a constructive note, Manufacturing job openings were essentially flat as was Durables.
Management teams have a lot of moving parts to factor into planning whether quantitative or qualitative. The final IEEPA decision from SCOTUS is ahead. The fallout in consumer spending from health care premium increases and retrenchments in SNAP spending and eligibility criteria could signal trouble ahead in the lower part of the “K” household mix.
For some (notably retail and many small businesses), the tariff threat can be existential. The cash drain in “writing the tariff check” and the hit to earnings from the expense line can impair trade credit and fuel bank credit problems for small businesses that are the backbone of payroll counts in the US.
The payroll impact has already been showing up in below-median payroll additions in 2025-2026. As noted in the chart at the top of the commentary, negative payroll months stand out in a time series where the White House had been touting the greatest first year in Presidential History. We now have a full year of payroll data, and the numbers are suboptimal.
Inflation reports had generally brought good news relative to expectations given the scale of the forward threat from tariffs and lagging effects to be seen across working capital cycles. That said, the inflation creep and affordability strain is clearly in evidence and taking a toll on inflation across select product groups.
The overall economic impact is far less than feared given the reality that most trade partners backed down. That said, inflation effects are showing up in the data with more to come this week (see CPI Dec 2025: Sideways Calms Nerves – For Now 1-13-26, PCE Income & Outlays Nov 2025: Resilient Consumer, Higher Inflation 1-24-26)
See also:
Retail Sales Dec 2025: Muted Year-End 2-11-26
Market Lookback: Monkey Business 2-9-26
Market Commentary: Asset Returns 2-8-26
Switzerland-US Trade: A Deficit that Glitters 2-3-26
US-Taiwan Trade: Risks Behind the Curtain 2-1-26
Market Commentary: Asset Returns 2-1-26
Trade Deficits: Math Challenge 1-30-26
China Trade: Shrinkage Report 1-28-26
Mexico Trade: Gearing up for More Trade Trouble? 1-27-26
Canada-US Trade: Trump Attack N+1 1-25-26
PCE Income & Outlays Nov 2025: Resilient Consumer, Higher Inflation 1-24-26
3Q25 GDP: Updated Estimate 1-22-26
Industrial Production Dec 2025: CapUte Resilience 1-17-26
Existing Home Sales Dec 2025: Getting up off the Mat? 1-16-26
Policy Mud on the Wall: Consumer Debt, Residential Mortgages 1-15-26
CPI Dec 2025: Sideways Calms Nerves – For Now 1-13-26
Payrolls Dec 2025 and FY 2025: Into the Weeds 1-10-26
JOLTS Nov 2025: Job Openings and Hires Down, Layoffs Lower 1-7-26
2025 Spread Walks and Multicycle Return Histories 1-5-26
Annual Return Differentials: HY vs. IG Across the Cycles 1-3-26
Total Return Quilt Across Asset Classes 2008-2025 1-2-26
Cyclical Histories: Will Facts Be in Vogue in 2026? 1-2-26
3Q25 GDP: Morning After Variables to Ponder 12-27-25
Durable Goods Oct25: Core Capex Still in Gear 12-23-25