
2025 trade Deficits: Reality vs. Rhetoric
The record trade deficit rattles the tariff theme music and encourages importers and suppliers to “check their premises.”


Didn’t these guys hear about the tariffs?
The trade deficits for 2025 weigh in with a record high goods deficit as we have been seeing along the way (see Trade Deficits: Math Challenge 1-30-26).
We doubt that the massive gap will cause much reassessment by White House tariff policy architects, but the potential or shifts in supplier chain capacity and reshoring plans as well as cost mitigation and pricing strategies will get a raft of new inputs soon enough.
Just ahead is the USMCA reviews and higher levels of tension with the EU, which covers the top 3 trade partners.
If predictability is a key component of capital budgeting decisions and if exemptions are the flies in the ointment for planning, then 2025 was a major setback on multiple fronts for the efficacy of the tariff game plan.
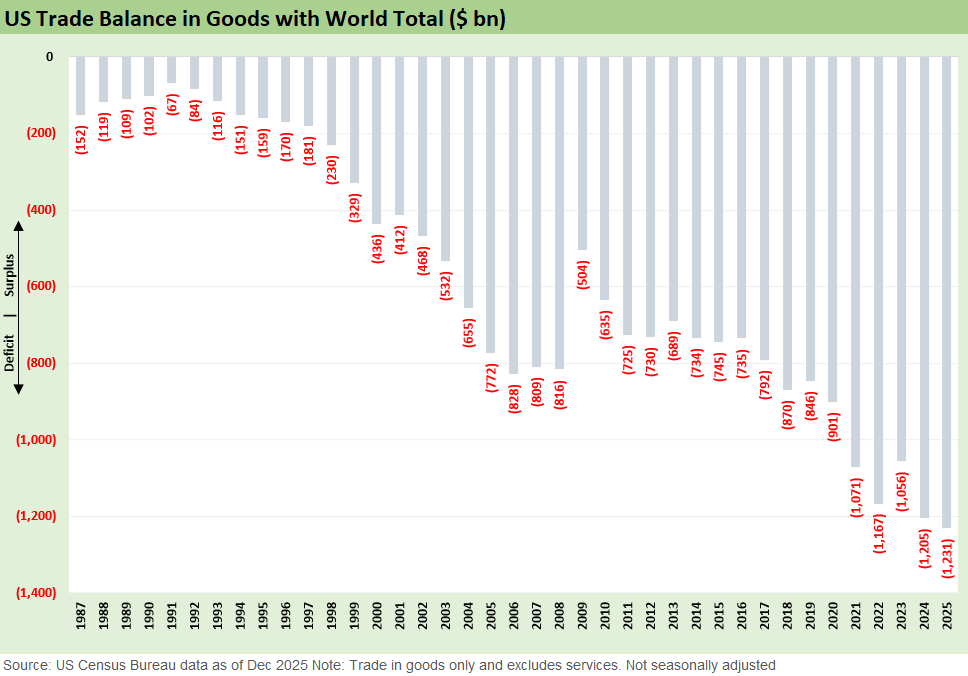
The above chart updates the running history of goods trade deficits. We looked at these issues in a recent commentary (see Trade Deficits: Math Challenge 1-30-26), but the above charts weighs in with the December 2025 and full calendar year numbers.
We will not beat the dead horse too much on how tariffs work in reality and in fact after so many regular demonstrations of double-talk and the avalanche of pure fabrications. The buyer/importer “writes the check” for the tariffs, so it was always a challenge to hear Trump say that he “collected hundred of billions from selling countries.” You don’t hear that as much these days since it is blatantly false.
The trends in the trade deficit balance into 2025 calls into question the main goal of reducing that deficit, which Trump calls a subsidy and “rip off” – as opposed to a free market decision by rational buyers with specific goals and reasons for making the purchase.
The deficit trend also offers a reminder that assumptions are not easy to make around the response to the policy. Decision-makers were hard at work in a very challenging year for markets adapting to tariffs and making purchases and planning cost and pricing actions. Managers had to take action from the seller to the buyer/importer or across the tiers of supplier chains to the finished goods customer.
The fact is not an opinion as to who write the check – the importer/the buyer – but the biggest “variables” are around whether the seller cut prices, the buyer took out costs to mitigate the impact, ate the costs (reduced margin), or passed the cost along in price. In terms of capex decisions and capacity investments, those will unfold over years. Doing nothing and framing up the landscape and trade risks (USMCA review, EU trade war risk etc.) is an option for many.
This week we heard the White House and Hassett attack the Fed’s latest tariff study without the Trump tariff architects offering any evidence of anything from their own “research.” That is par for the course since Hassett, Navarro et al have their outcomes written down in advance long before any economic events took place. Those views will not change. It is like election outcomes. Facts don’t matter.
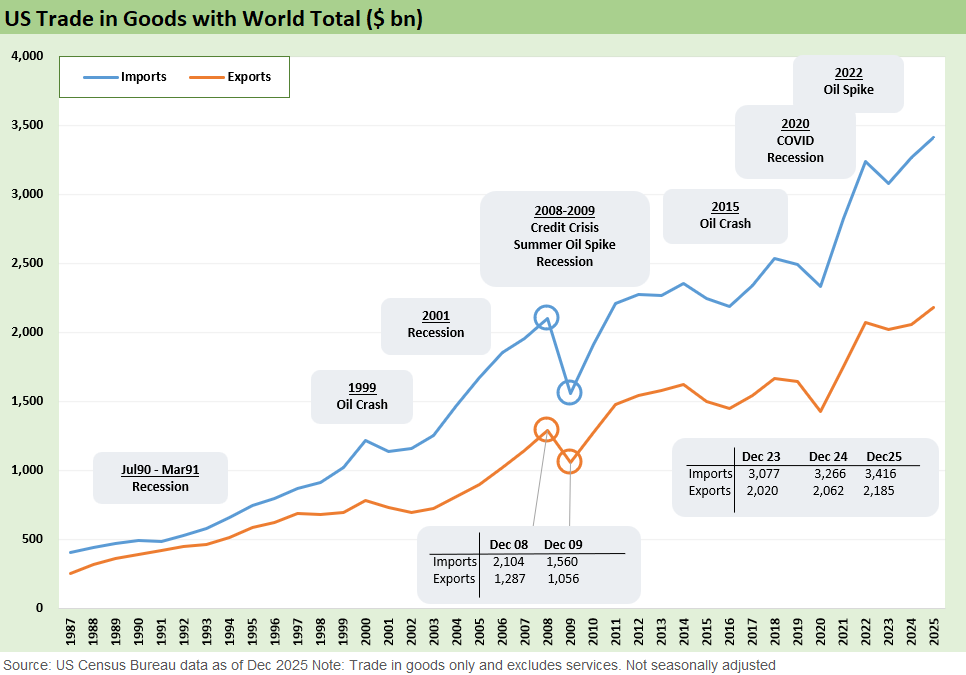
The above chart updates the running import and export timeline behind the record trade deficits. The reality is that both are upward sloping in a growing global economy and growing US economy. When the US grows, the importers still have well established supplier chains intact even if some have faced enormous pressure on the tariff impacts. Rising material costs (notably, steel and aluminum, etc.) still have room to flow along the supplier chains into 2026 as goods manufacturers make decisions on pricing and work with customers.
Currency effects have not been helpful with the dollar weaker and the costs of nondollar goods rising in tandem with tariffs higher (and frequently changing). Back in 2017, when the House tax bill (led by Ryan of Wisconsin and Brady of Texas) wanted to use a 20% border tax “tariff” on imports to take the place of US corporate taxes, they assured the market (with their expert academic witnesses) that the dollar would strengthen so much that it would offset the 20% tariffs. Well, here we are 8 years later with the dollar crushed and tariffs high if erratic. That is a flashback to other days. In those long-ago days, the GOP leaders also used the word “tax” to describe tariffs. That has since been disallowed.
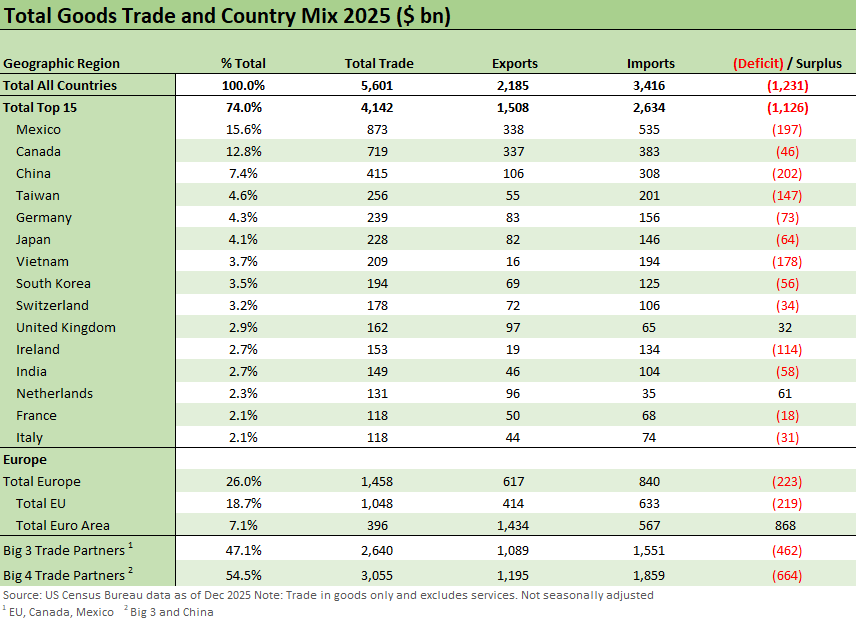
The above chart updates the ranking and moving parts of the top US trade partners. The Big 3 comprised 47% of “total trade” (imports + exports while the Big 4 totaled 54.5%. The mythologies for framing deficits uses different measurement in sections of the Census trade data, but the basic conclusions do not vary.
Mexico is #1 as a nation and #1 in imports. Canada and Mexico are a dead heat in exports, but the value added mix in the Canada list wins. Mexico also has a lot of round-trip US exports that come back across the border as imports. We have covered Taiwan’s rise in more detail separately (see US-Taiwan Trade: Risks Behind the Curtain 2-1-26). Switzerland is also a very distinctive trade story with the role of gold moving in both directions (see Switzerland-US Trade: A Deficit that Glitters 2-3-26).
Other Tariff commentary:
Switzerland-US Trade: A Deficit that Glitters 2-3-26
US-Taiwan Trade: Risks Behind the Curtain 2-1-26
Trade Deficits: Math Challenge 1-30-26
China Trade: Shrinkage Report 1-28-26
Mexico Trade: Gearing up for More Trade Trouble? 1-27-26
Canada-US Trade: Trump Attack N+1 1-25-26
US-Canada Trade: 35% Tariff Warning 7-11-25
India Tariffs: Changing the Music? 7-11-25
Taiwan: Tariffs and “What is an ally?” 7-10-25
Tariff Man Meets Lord Jim 7-8-25
South Korea Tariffs: Just Don’t Hit Back? 7-8-25
Japan: Ally Attack? Risk Free? 7-7-25
US-Vietnam Trade: History has its Moments 7-5-25
US Trade in Goods April 2025: Imports Be Damned 6-5-25
Tariffs: Testing Trade Partner Mettle 6-3-25
US-UK Trade: Small Progress, Big Extrapolation 5-8-25
Tariffs: A Painful Bessent Moment on “Buyer Pays” 5-7-25
Trade: Uphill Battle for Facts and Concepts 5-6-25
Tariffs: Amazon and Canada Add to the Drama 4-29-25
Ships, Fees, Freight & Logistics Pain: More Inflation? 4-18-25
Tariffs, Pauses, and Piling On: Helter Skelter 4-11-25
Tariffs: Some Asian Bystanders Hit in the Crossfire 4-8-25
Tariffs: Diminished Capacity…for Trade Volume that is…4-3-25
Reciprocal Tariff Math: Hocus Pocus 4-3-25
Reciprocal Tariffs: Weird Science Blows up the Lab 4-2-25
Tariffs: Enemies List 3-6-25
US-Mexico Trade: Import/Export Mix for 2024 2-10-25
Aluminum and Steel Tariffs: The Target is Canada 2-10-25
Trade Exposure: US-Canada Import/Export Mix 2024 2-7-25
US Trade with the World: Import and Export Mix 2-6-25
The Trade Picture: Facts to Respect, Topics to Ponder 2-6-25
Tariffs: Questions to Ponder, Part 1 2-2-25
US-Canada: Tariffs Now More than a Negotiating Tactic 1-9-25
Mexico: Tariffs as the Economic Alamo 11-26-24
Tariff: Target Updates – Canada 11-26-24
Trump, Trade, and Tariffs: Northern Exposure, Canada Risk 10-25-24
Trump at Economic Club of Chicago: Thoughts on Autos 10-17-24
Facts Matter: China Syndrome on Trade 9-10-24
Tariffs: Questions that Won’t Get Asked by Debate Moderators 9-10-24
The Debate: The China Deficits and Who Pays the Tariff? 6-29-24
Trade Flows: Deficits, Tariffs, and China Risk 10-11-23
 |
|