
Payrolls Jan 2026: Into the Weeds
An inflection for private payrolls shows some labor market momentum against revisions that sees 2025 payroll growth materially weaker.


Nonfarm payrolls rose +130K to start the new year as private payrolls surged +172K, offset by -42K in government. Gains broadened out across services and goods producing sectors but healthcare remains a dominant driver contributing +124K adds this month.
The annual benchmark revisions show that 2025 job growth was materially weaker at +15K average monthly payrolls gains vs. the pre-revision +49K number. We had already seen fragility in the labor market prior to the revisions given the quickly narrowing breadth and reliance on healthcare adds and this supports that deterioration. These annual downward revisions used to get a lot of commentary from Trump when they happened under Biden but the commentary is lighter this time.
The bright side from today’s report against the backdrop of revisions is that the most recent prints are trending back towards positive. The three-month average rebounded to +73K for headline and that improves when focusing on private payrolls to a +103K three-month average. It is another report that gives just enough mixed signals to keep kicking the can down the road on where the labor market is going.
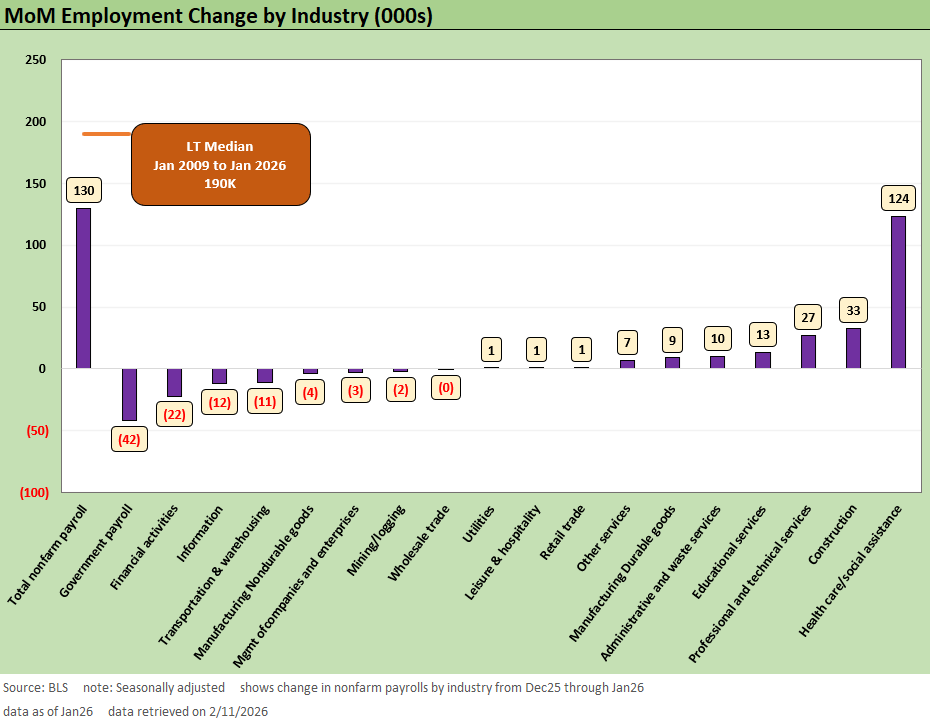
The above shows the January MoM employment change across a broader range of drivers with some stronger signals of private-sector momentum. The breadth still has not meaningfully improved from previous months, but the composition is more encouraging in this morning’s print.
Healthcare and social assistance is again the largest contributor at +124K, but this month sees both construction (+33K) and durable goods (+9K) providing strong relative growth. A mild bounce back this month for the manufacturing lines is positive for the broader economic picture and might be meaningful given policy actions in 2025 to stimulate these industries. The market will need to see more months of sustained positive payroll additions in manufacturing. The YoY trend remains deeply negative. This could be a start.
Weakness this month was concentrated in Government payrolls (-42K) with its drivers disconnected from the broader labor market. Aside from that, we see financial activities (-22K) and information (-12K) with material declines. Information has been in a mild contraction across the past 3 years as motion picture and publishing industries have seen headcounts shrink.
As we look at this report, the positive takeaway is the composition across services and goods growing as signals where there could be some footing to gain momentum in the labor market. There is still outsized narrow concentration but some services lines are loosening up.
We remain cautious given the outlook for possible job displacement from AI and similar tools as adoption rates are quite impressive. The stabilizing signal from today’s report is likely once again overstated with downward revisions becoming the norm. We will wait for upcoming releases to see if private labor market momentum is maintained as 2026 progresses.
Into the weeds…
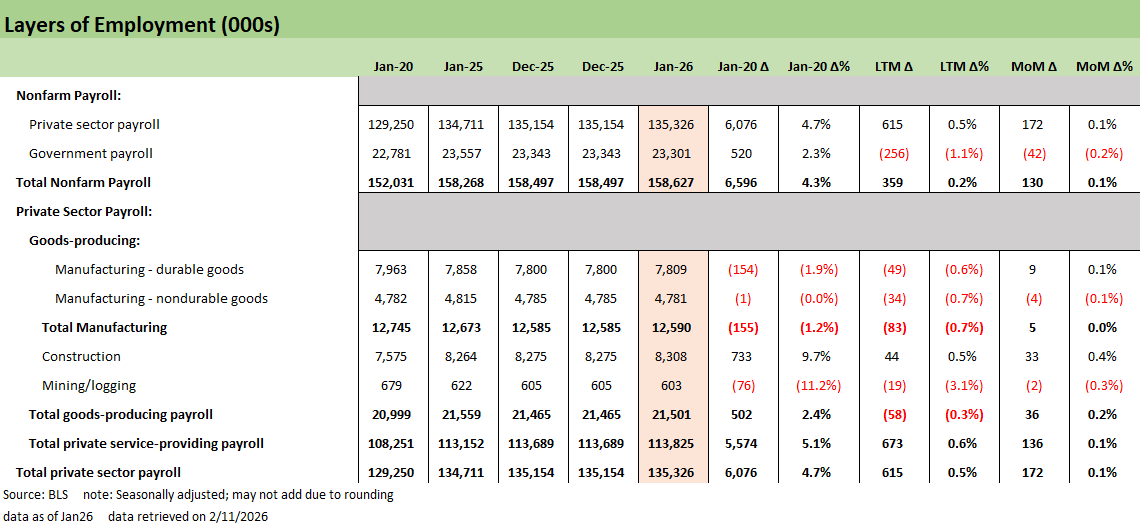
The above chart provides the big split across private vs. public and services vs. goods-producing. The Private services category remains the primary driver of job growth in the US, while goods-producing rebounded to start 2026 after only construction had been positive last year. Government continues to see payrolls contract with this month negative across both Federal and State payrolls.
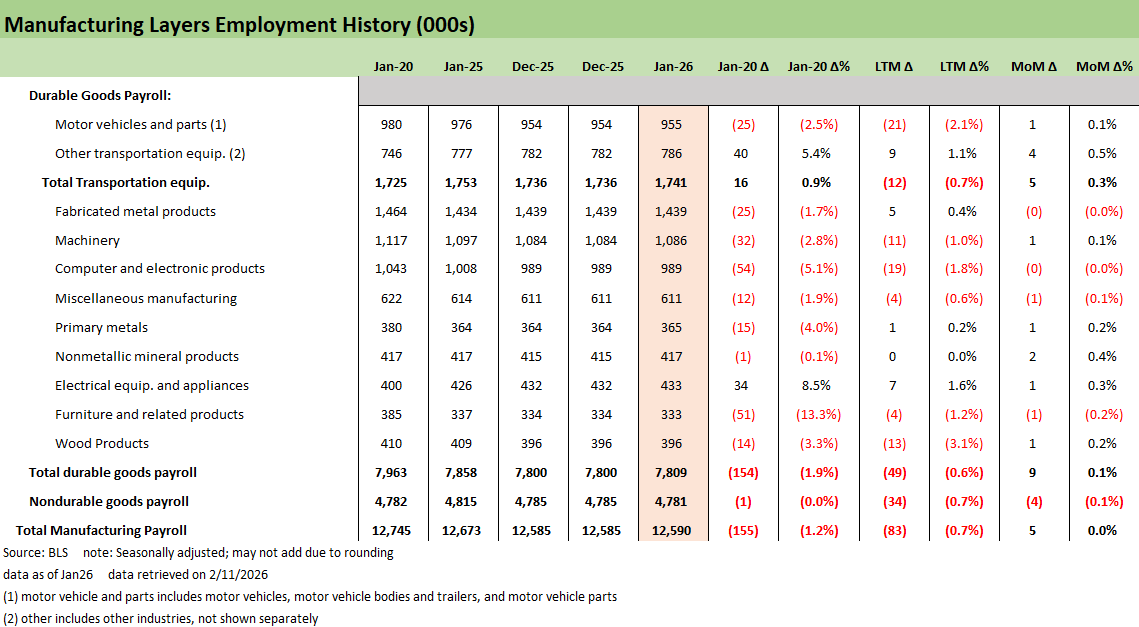
The manufacturing payroll mix is shown above. We see generally positive results leading to +5K higher this month split across +9K durables and -4K nondurables. We focus on the durables details above with growth in January spread across most areas though with transportation equipment leading the pack at +5K.
Given the policy focus on reshoring manufacturing this past year, seeing growth to start 2026 is encouraging, but the revisions now show where there is a larger hole to climb from to start a manufacturing renaissance. At least for now the bleeding might be slowing and there might be at least some stabilization for now.
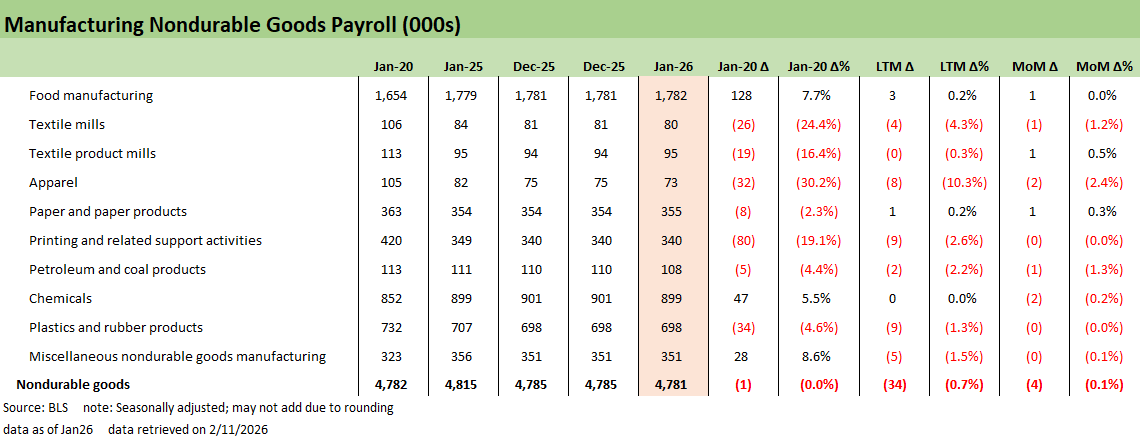
Nondurable manufacturing activity posted a typical mixed bag of results skewed towards declines. The above lines are not the growth engine of the manufacturing base, but there are some key support sectors to watch like petrol, chemicals, and plastics. These continue to be declining sectors across the manufacturing base and likely to continue to weigh on manufacturing payroll growth.
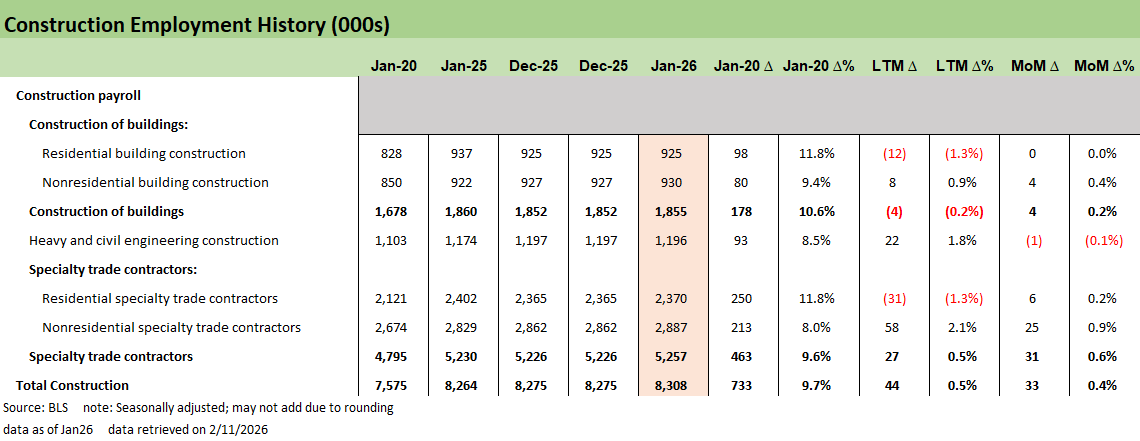
The revisions released this morning show a more benign construction growth picture for 2025. That being said, the January surge of +33K is a positive signal for nonresidential projects where capital spending for data infrastructure projects remains intact. Given the large investment commitments of major tech firms, we see this as the closest bridge between AI capex narratives and labor stabilization within the payrolls print.
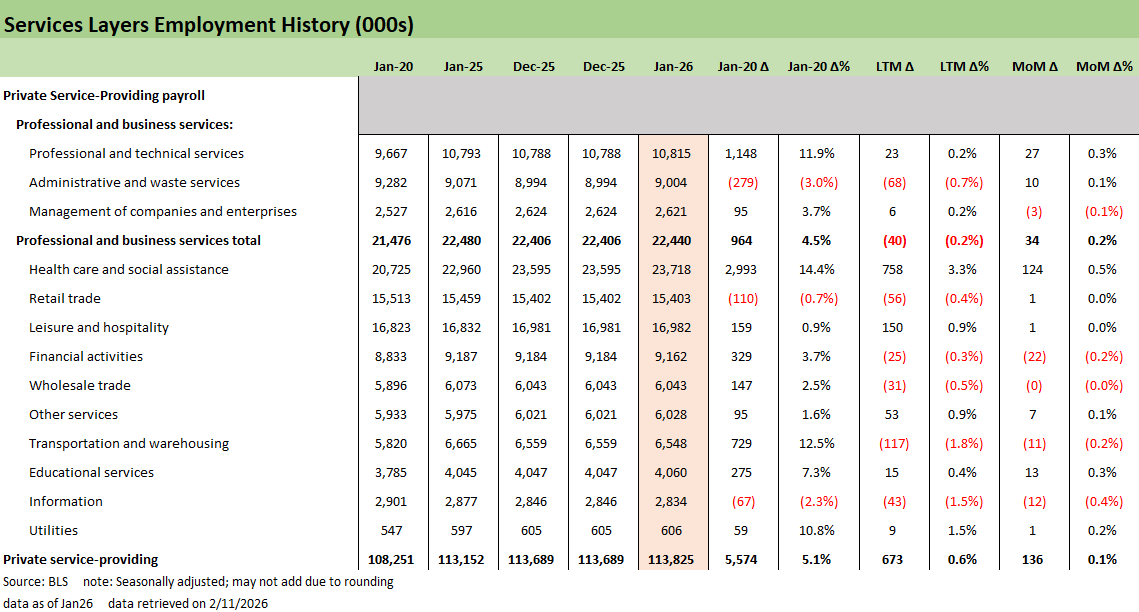
Services payroll numbers are still the core of the report from a gains perspective. Healthcare and Social Assistance is the major driver again at +124K with a much more mixed read across other lines. We have discussed where we think the narrow concentration of gains leaves a much more fragile labor market than the headline suggests. This latest print still supports that view even with slightly positive signals in manufacturing.
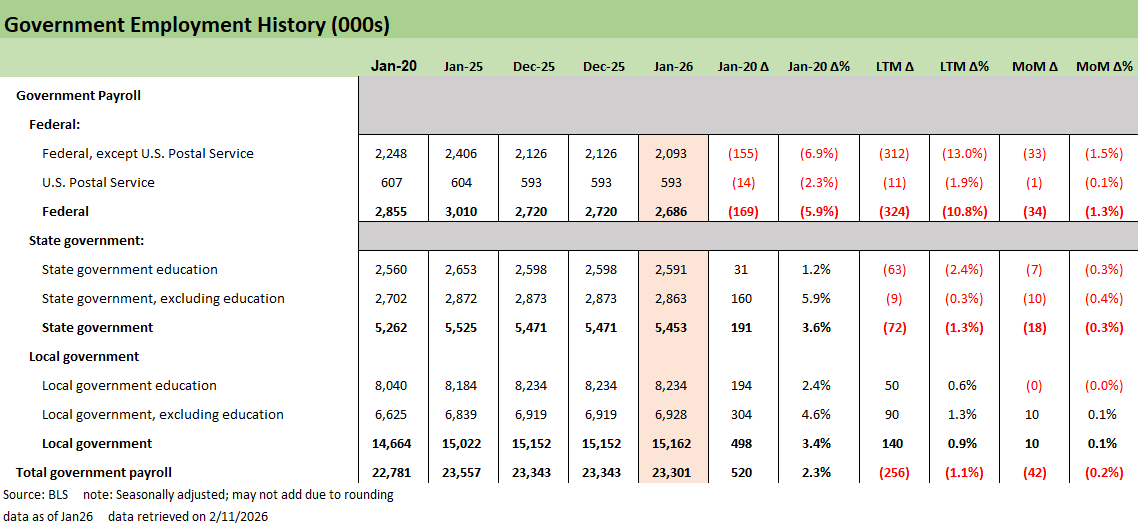
Finally, the Government lines above continue the bleed from public payrolls with this month seeing -42K. Federal payrolls made up -34K of the decline but this month also sees State at -18K, with Local a +10K offset. Government remains a drag on the aggregate numbers and the practical way to look at recent reports is to exclude these government lines. The cyclical signals are elsewhere as government lines will be volatile across layoffs and shutdown drama. That said, government retrenchment in payroll will flow into GDP lines depending on government consumption and investment. Many of the people are gone and more than a few department and agencies gutted or shutdown.
See also:
Employment Jan 2026: Good Headline, So-So Mix 2-11-26
Retail Sales Dec 2025: Muted Year-End 2-11-26
Market Lookback: Monkey Business 2-9-26
Market Commentary: Asset Returns 2-8-26
Switzerland-US Trade: A Deficit that Glitters 2-3-26
US-Taiwan Trade: Risks Behind the Curtain 2-1-26
Market Commentary: Asset Returns 2-1-26
Trade Deficits: Math Challenge 1-30-26
China Trade: Shrinkage Report 1-28-26
Mexico Trade: Gearing up for More Trade Trouble? 1-27-26
Canada-US Trade: Trump Attack N+1 1-25-26
PCE Income & Outlays Nov 2025: Resilient Consumer, Higher Inflation 1-24-26
3Q25 GDP: Updated Estimate 1-22-26
Industrial Production Dec 2025: CapUte Resilience 1-17-26
Existing Home Sales Dec 2025: Getting up off the Mat? 1-16-26
Policy Mud on the Wall: Consumer Debt, Residential Mortgages 1-15-26
CPI Dec 2025: Sideways Calms Nerves – For Now 1-13-26
Payrolls Dec 2025 and FY 2025: Into the Weeds 1-10-26
JOLTS Nov 2025: Job Openings and Hires Down, Layoffs Lower 1-7-26
2025 Spread Walks and Multicycle Return Histories 1-5-26
Annual Return Differentials: HY vs. IG Across the Cycles 1-3-26
Total Return Quilt Across Asset Classes 2008-2025 1-2-26
Cyclical Histories: Will Facts Be in Vogue in 2026? 1-2-26
3Q25 GDP: Morning After Variables to Ponder 12-27-25
Durable Goods Oct25: Core Capex Still in Gear 12-23-25
Market Lookback: Last Call for Unusual Behavior 12-22-25
3Q25 GDP: Morning After Variables to Ponder 12-27-25
 |
|