
2025 Spread Walks and Multicycle Return Histories
We update the 2025 HY and IG spread walks in what was a remarkably measured year for spreads given the stakes.


I thought Venezuela liked me?
As part of the usual calendar year lookback exercise, we already updated total returns and excess returns including HY vs. IG return differentials (see Annual Return Differentials: HY vs. IG Across the Cycles 1-3-26).
We also updated the multi-asset return quilt since 2008 and for the monthly numbers in 2025 (see Total Return Quilt Across Asset Classes 2008-2025 1-2-26).
What is striking about the 2025 pattern was that even in the worst of the Liberation Day panic in early April, HY OAS barely edged past the long-term median.
The HY bond market remained relatively unflappable given the macro stakes with a rolling 3-months move wider from Feb to April of +126 bps followed by -108 bps tighter in May-June-July.
As we look ahead to 2026, Trump just moved military adventurism and annexation back onto the risk list as it all gets more serious with Colombia, Greenland, and Mexico (among others) hearing threats. The election year decision-makers might ask about the unpredictable cost-benefit analysis and priorities of such actions in the context of higher, soul-crushing health insurance premiums.
Sacking a Venezuelan dictator is no big deal for markets at all. The real concern is around extrapolation from here on the next attacks and planned annexations and how far Trump will go, especially in the cases of Europe, Mexico and Canada. At some point, people will punch back.
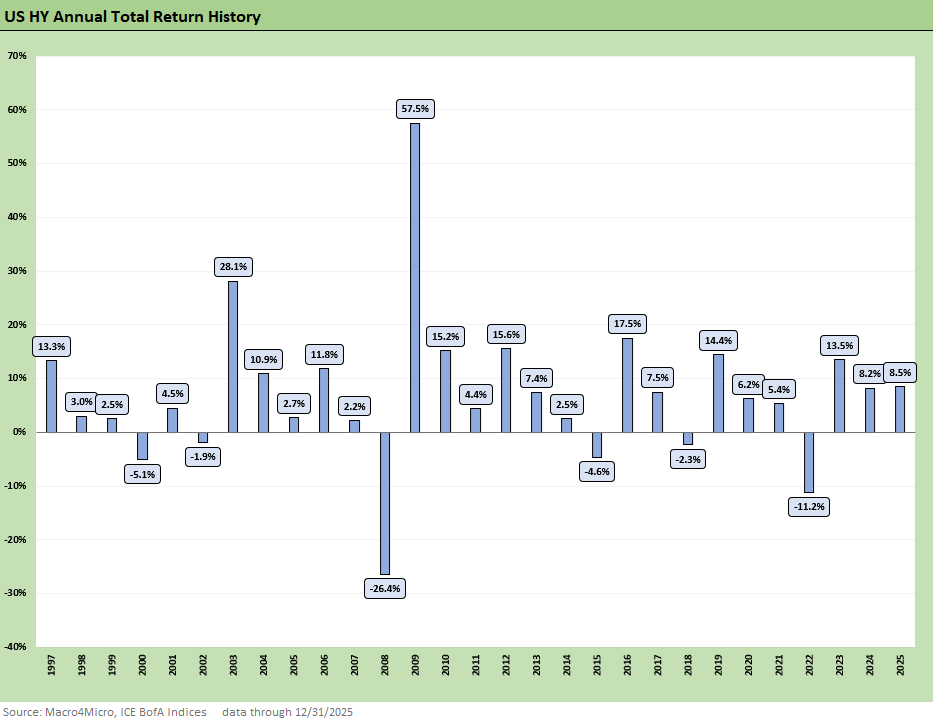
The above chart offers a visual variation on historical HY total returns back to 1997, which we already discussed in earlier notes (see Annual Return Differentials: HY vs. IG Across the Cycles 1-3-26, Total Return Quilt Across Asset Classes 2008-2025 1-2-26).
The past 2 years (2024-2025) are framed around what one might expect in total returns as a haircut to the long-term return on equity assets. The 2023 return of +13.5% comes with an asterisk of the 2022 sell-off in risk during the tightening cycle and inflation mini-panic. During 2022, HY posted -11.2% return on materially wider spreads and adverse curve action.
There was no rivaling equities in recent years for total returns post-COVID. As income products go, HY bonds delivered as promised when factoring in the combination of coupon, duration and relative risk of a BB tier heavy benchmark. The riskier action in credit is over in private credit with its own distinctive attributes in the underlying asset base. That is where the most highly leveraged transactions lurk with the captive credit funds. Private credit will remain the bigger challenge to sort through ahead.
Private credit had emerged as the “new” growth market in credit (those of us who started our credit careers in “private placements” in insurance portfolios need to put quotation marks around “new”). Private credit is an evolution of an old theme with different structures and many small and midcap borrowers. That will be the big credit cycle test ahead.
HY bonds: cash income and/or reinvestment is still the same dynamic…
The simplistic way to look at this HY return chart is to say “it takes a lot of trouble to send the total return into negative range with a 6% handle weighted average coupon.” Cash income and/or reinvestment in riskier credit has been a proven, sound asset allocation over time in the case of HY bonds.
These are annual returns, but the power of compounding is still there to build wealth along the risk reward spectrum between high quality bonds and equities. What the UST curve will deliver to HY total returns in 2026 is a critical variable given the expectation of easing running alongside the fear of steepening if inflation goes the wrong way.
For those with confidence in muted economic pressures in 2026 but concerns around the long end of the curve, HY is a good place to be relative to UST or IG index exposure. Making a highly confident curve call (flatten vs. steepen) has been a struggle across 2024-2025. For example, the bullish UST expectations for a flattener in 2024 did not play out as planned by many.
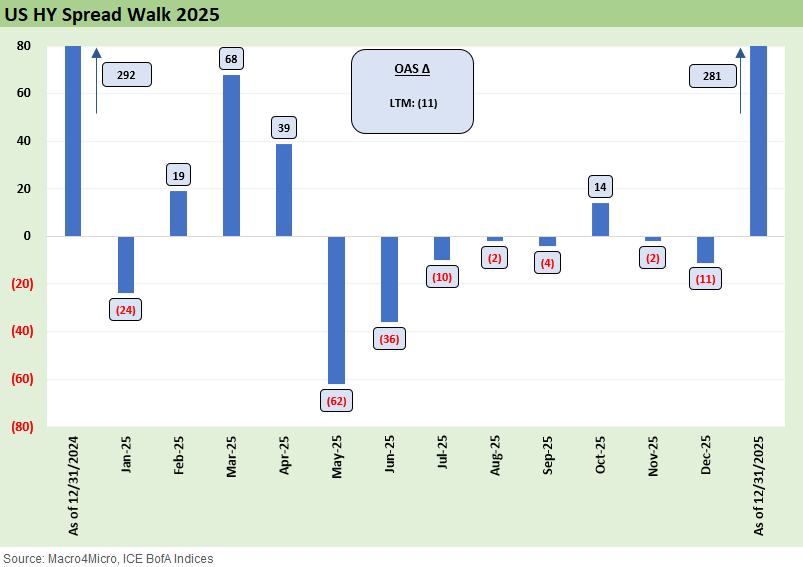
The 2025 HY spread walk is detailed above. That visual shows a very restrained year for HY spreads considering the chaos of tariff policy implementation. The “seller pays” misinformation was somewhat of a confidence killer with respect to policy consistency or even a conceptual or factual grasp on the part of the primary architect of the plan in the White House.
Gauging what the long-term tariff structures will look like has proven impossible after the representation of “permanence” at launch. The goalposts keep moving, and we see many open items with the largest trade partners even as relationships are deteriorating sharply.
The steady and ongoing adjustments (including news on kitchen cabinets and upholstered furniture this past week) complicates working capital management, pricing strategies, vendor/supplier chain planning, and customer negotiations that could be longer term in nature (multi-year contracts, etc.). Regardless of any change in tariffs, small businesses have been pummeled as ADP detailed in its November numbers. We get BLS payrolls and ADP this coming week.
The memories of credit spreads in 2025 tend to lock in on Liberation Day and that brief shock that saw HY OAS hit +461 bps in early April (see Reciprocal Tariff Math: Hocus Pocus 4-3-25, Tariffs: Diminished Capacity…for Trade Volume that is… 4-3-25). That spread level was only slightly above the long-term median, and that is a reminder that recessions and credit contraction can make life much worse. It would take something extraordinary to get spreads back above the long-term median in 2026.
The above chart offers a reminder that much of the tariff anxiety was already getting rolled into HY spreads before Liberation Day back in March ( Footnotes & Flashbacks: Credit Markets 3-31-25). We see the rolling Feb-March-April months delivering +126 bps of HY spread widening followed by -108 bps of tightening in the rolling 3 months of May-June-July.
As the UST market “plumbing” and the dollar was getting roiled by the tariff shock in April, the immediate adjustments and policy moonwalking kicked into gear. “Official” policy morphed quickly to reassure markets when equity markets, currency nerves, and UST dislocations got Treasury’s attention. While Bessent has overwhelmingly served as a repetitive mouthpiece supporting the Trump line and spinning numbers in only the best light, he did at least step in to mitigate some damage in April.
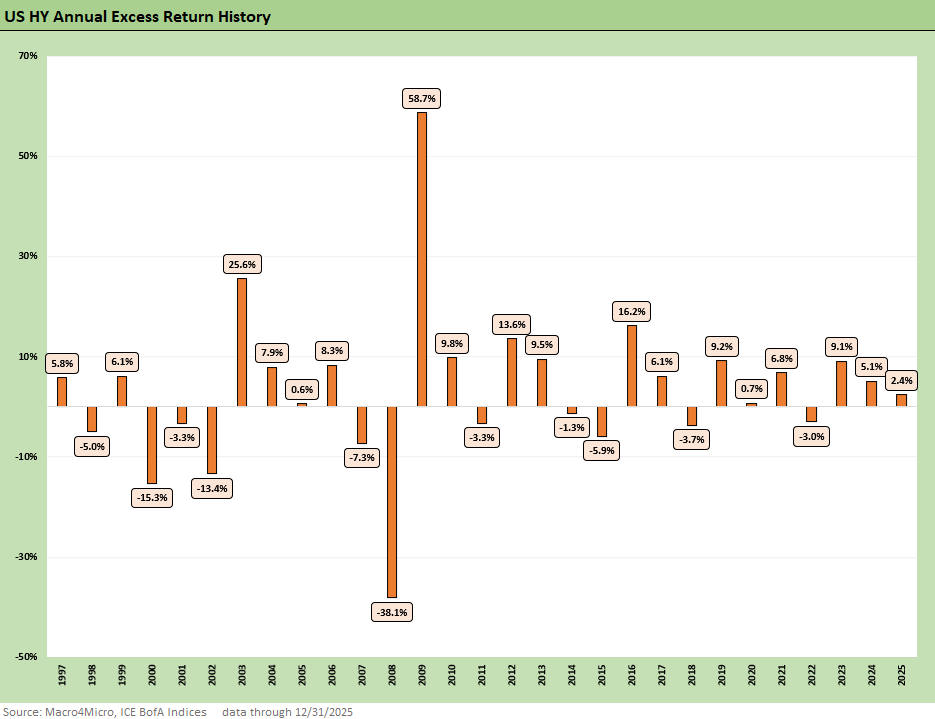
The above chart updates the longer-term excess return history for US HY. With spreads compressed and only -11 bps of tightening in 2025, the coupon and the UST curve is the main event with spreads likely more in the bucket of adverse symmetry risk. The wild ride across the credit cycles for HY is something we’ve covered frequently and in detail in other commentaries. The 2008-2009 journey was one for the ages.
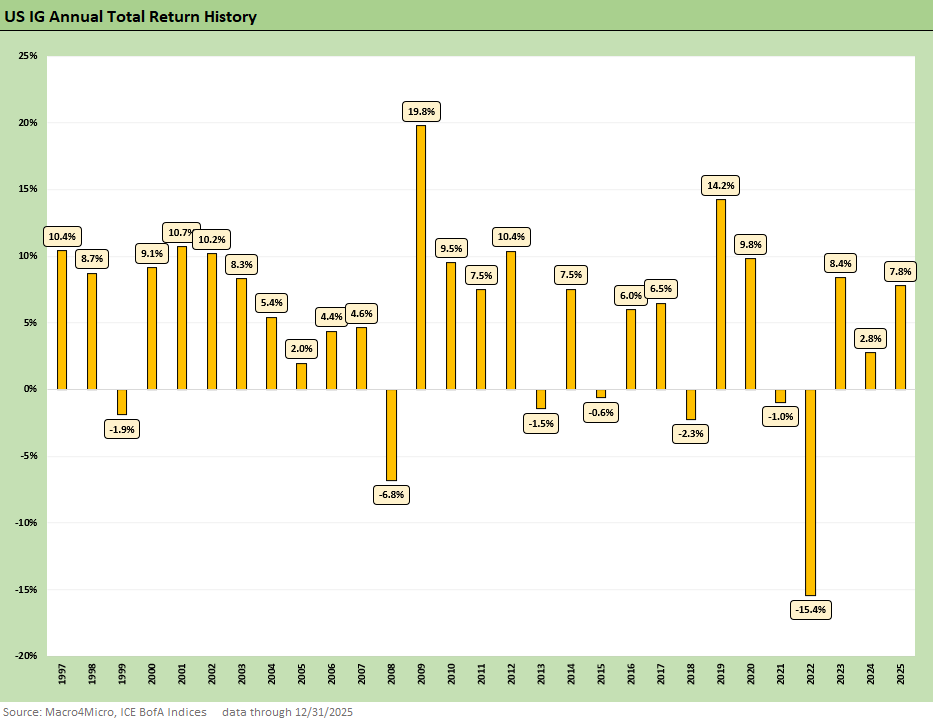
The IG total return history certainly shows a wild pattern given how the credit crisis emanated from the single A and BBB tier with financial systemic risk spikes. Then came ZIRP and QE with a fresh UST rally out of 2011 and the global sovereign crisis (centered in the EU) into the year of “whatever it takes” from the Eurozone in 2012. The bank bond rallies spread into the IG index as systemic risk settled down. Credit spreads and risk appetites soared in late 2012 and into 2013. During 2013, the good news set off the “taper tantrum” steepening and hit duration.
More recently, the IG market has been riding the bull steepener during 2025 with the main events ahead tied to the “flattener vs. steepener” debate for the UST and IG index. The FOMC debate (How many? How soon?) is obviously quite important, but duration losses or wins – or absence of victory – get set by the market and not the Fed.
The above IG total returns in 2025 have been wagged by the UST bull steepener we have been tracking through the year (The Curve 12-15-25). The total return differentials between IG and HY were quite narrow as IG benefited from the curve effect (see Annual Return Differentials: HY vs. IG Across the Cycles 1-3-26). That said, HY also saw UST support with the declines favoring shorter to intermediate duration bonds (see The Curve 12-15-25).
The dominant headwinds for the UST markets have been largely tagged as “supply” and “inflation fear.” The supply-demand factor is a mix of Econ 101 and where along the curve US Treasury liability management plan generates supply. Trump appears focused on getting T-Bills into the negative real return zone and wants fed funds under 1%. That is not a demand aphrodisiac and could bring more fallout for the dollar and tariff-adjusted import costs.
Trump also faces record budget deficits and will face a budget that will get worse given recent headlines. The cost of geopolitical whims and adventures will add up quickly. A snatch-and-grab has a very different budget need than pacifying a resistance, a need to enforce, or resources committed to execution of a transfer of oil assets to US companies. The growing deficit and growing borrowing needs mean more UST supply and budget negotiation risk in Congress.
Since Trump this week also threatened Colombia, Mexico, and Greenland (i.e. Denmark, the EU, and NATO) the idea of undermining UST demand globally might catch on. With the USMCA up for review in coming weeks, the excess return risk pricing factor could start to rear up as well. A trade battle with Mexico, Canada, and/or the EU would hurt all economies and global trade. Those risks are not off the table.
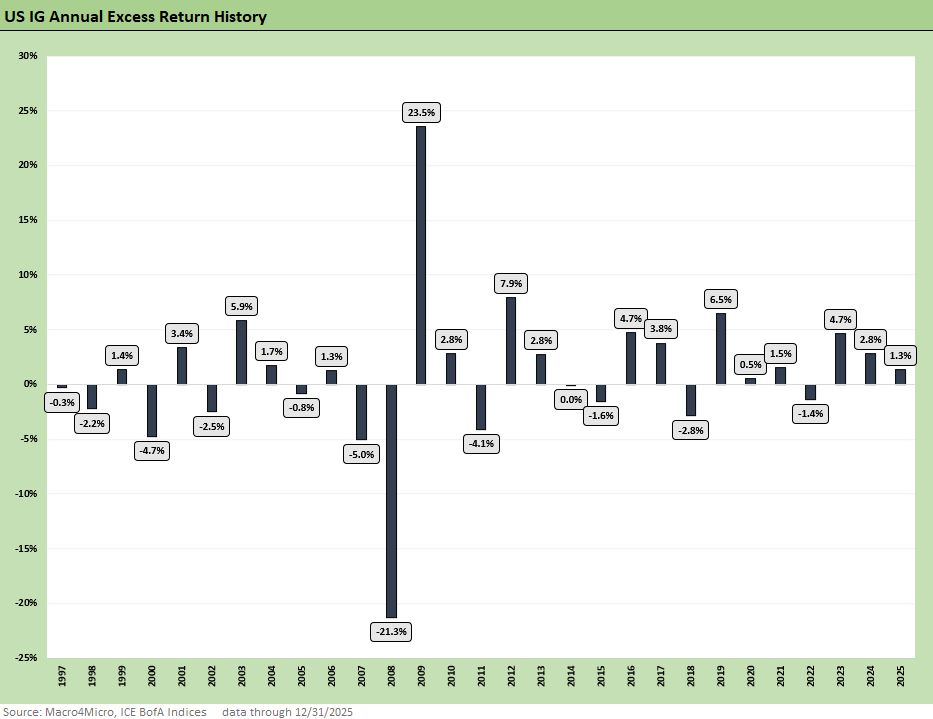
As we noted earlier in the IG total return chart, it is rare when a crisis emanates from the upper tiers, but banks and brokers clearly have had their moments of setting off shocks across the decades. That is a separate story for another time, but regional bank crises of Texas Banks, S&Ls, the regional commercial real estate meltdown in the early 1990s, and the failed securities firms (and spiking counterparty risk) are all on the books from the 1980s to 2000’s. We even had a mini panic in some regional banks as recently as 2023. Powell and the Fed handled that one masterfully.
Negative excess returns in the chart have a lot of stories from the TMT bubble years (plus Enron and Worldcom), across 2005 (auto downgrades), and the 2007-2008 financial crisis period (that also sucked in autos). We had a fresh bank systemic flashback in 2011 triggered by sovereign fears. We see the negative impact of energy setbacks in 2015 as many BBB tier names hit a spread wave.
The year 2018 seems to be forgotten with all the “greatest economy in history” nonsense as all major bond and equity benchmarks finished the year in negative return range that included a mini oil market crash at year end and sharp equity sell-offs from small caps to midcaps spilling into HY (see Histories: Asset Return Journey from 2016 to 2023 1-21-24, HY Pain: A 2018 Lookback to Ponder 8-3-24).
The theory on why you spread risks across IG and HY is that you win on duration in IG if HY spreads take a beating on “events” or fundamentals. Those basic strategies do not change much across the years. Every now and then you get the Full Monty of bullish risk appetites, strong equity market optimism, and tight spreads all at the same time. 2025 was one of those times.
The fact that an easing cycle was underway while stocks were booming and spreads rallying makes 2025 unusual. The real difference in this current period is inflation lurking as a threat and the potential for stagflation as something we have not seen in decades - even if a much, much milder version than the 1979-1982 experience (see UST Moves 1978-1982: The Inflation and Stagflation Years 10-18-23).
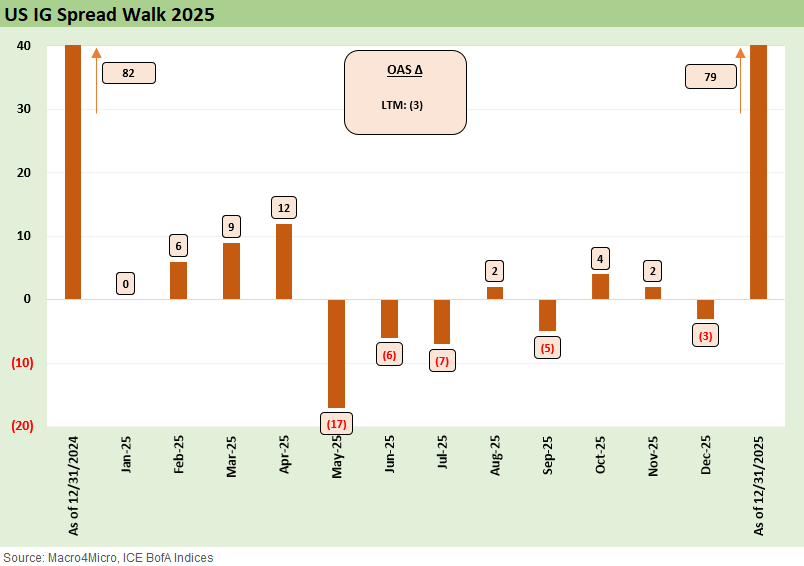
The above chart recaps the IG spread walk in 2025 as the year began in the spread zone of multicycle lows. The IG index OAS has remained near past credit cycle peaks at the beginning of 2025 and then finished -3 bps lower at +79 bps.
See also:
Annual Return Differentials: HY vs. IG Across the Cycles 1-3-26
Total Return Quilt Across Asset Classes 2008-2025 1-2-26
Cyclical Histories: Will Facts Be in Vogue in 2026? 1-2-26
3Q25 GDP: Morning After Variables to Ponder 12-27-25
Durable Goods Oct25: Core Capex Still in Gear 12-23-25
Market Lookback: Last Call for Unusual Behavior 12-22-25
Existing Home Sales Nov 2025 12-21-25
November CPI: Tricky Navigation 12-18-25
Employment Nov 2025: Bad News is Bad News 12-16-25
Payrolls Nov 25: Into the Weeds 12-16-25
The Curve 12-15-25
Market Commentary: Asset Returns 12-14-25
Market Lookback: FOMC Fragments, Rate Debates Murky 12-13-25
FOMC: Dot Plot Scatters for 2026 12-10-25
 |
|