
Employment Situation Feb 2026: Payrolls Get Ugly
We see 5 of the past 9 payroll releases negative even before Iran effects flow in. The plot thickens for the FOMC.


It’s all in how you deliver the message. Or does down really mean down?
The Friday payroll release was obviously grim so it took a back seat to sorting through all the moving parts of the headlines out to the Middle East and Iran that keep adding new elements of risk with the expectation of more problems to come.
The raw numbers tell the story. The Establishment Survey shows a decline of -92K. The Household Data shows a decline in total employed in Feb 2026 from January 2026 of -185K and a decline of -426K YoY vs. Feb 2025. The ranks of the unemployed rose by 203K from Jan 2026 and by 467K vs. Feb 2025. Even Kevin Hassett and Scott Bessent cannot paint a smiley face on Feb 2026 payroll numbers (try as they may).
Manufacturing jobs declined again with both Durables and Nondurables down. Goods-producing payrolls overall were down with Construction also down. Private services producing payroll was down by -61K (with Health Care distortions) and the usually reliable Leisure and Hospitality down. We will look at the occupational deltas in a separate commentary. Government was also down for the month.
Even with Iran dominating the headlines and driving more upward revisions in estimates on inflation, the payroll numbers will matter a great deal as the election year plods along with higher inflation, lower payrolls, and more household discretionary strain from gasoline and fuel costs that will pile onto high electricity and piped utility gas inflation. The Golden Age is on hold despite strong demand from The Ballroom.
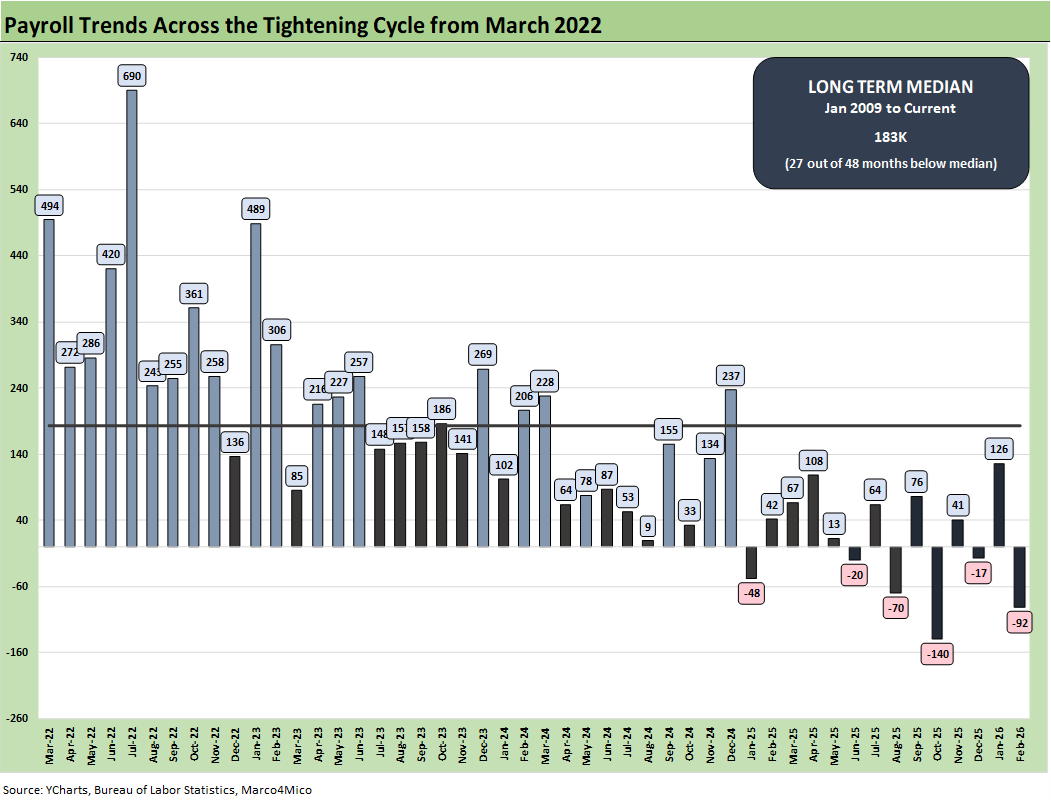
The monthly payroll adds/declines chart above starts in March 2022 with the end of ZIRP and start of the tightening cycle. The bar chart tells an objective data story. The -92K for Feb 2026 drove the U-3 rate higher to 4.4% from 4.3% in January.
The numbers in 2025 and 2026 include the only negative deltas on the chart with 6 months in the red. Furthermore, the 2025-2026 months are all below the post-Jan 2009 median of 183K. That long-term median period includes a slice of the longest recession since the Great Depression, so it is not a high bar to clear. Those payroll numbers from Jan 2025 to Feb 2026 offer no bragging rights.
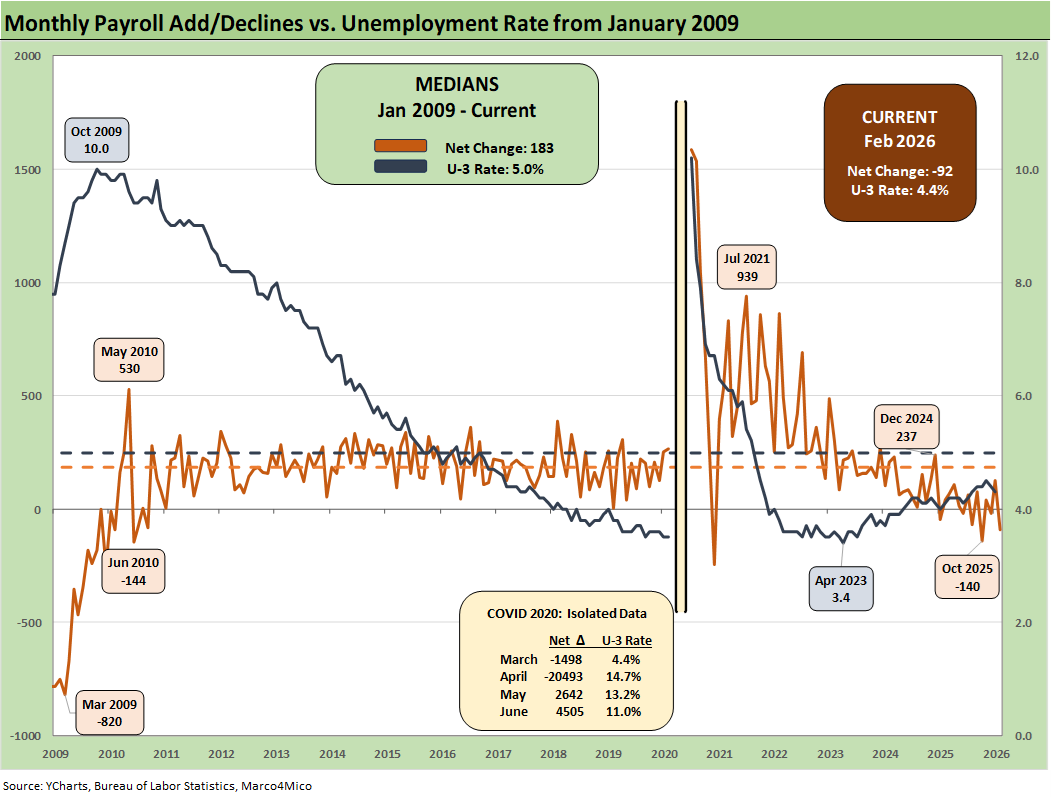
The above chart plots the running job adds/declines since Jan 2009 against the unemployment rate, which ticked higher MoM to 4.4% from 4.3%. In the chart, we isolate the worst months of the COVID dislocations in the box for better visuals to capture the other periods. The 4.4% U-3 is still below the long-term median of 5.0%. In past cycles, the 4.4% number would be considered full employment, so that is still a solid number across the cycles. Payroll has been struggling somewhat in relative terms, but history is kind to 4.4%. If the 2025-2026 frame of reference is 2024 (not a good jobs year) then the 2025-2026 numbers are not so bad. If we compare it to the 2022-2023 period, the current numbers are grim.
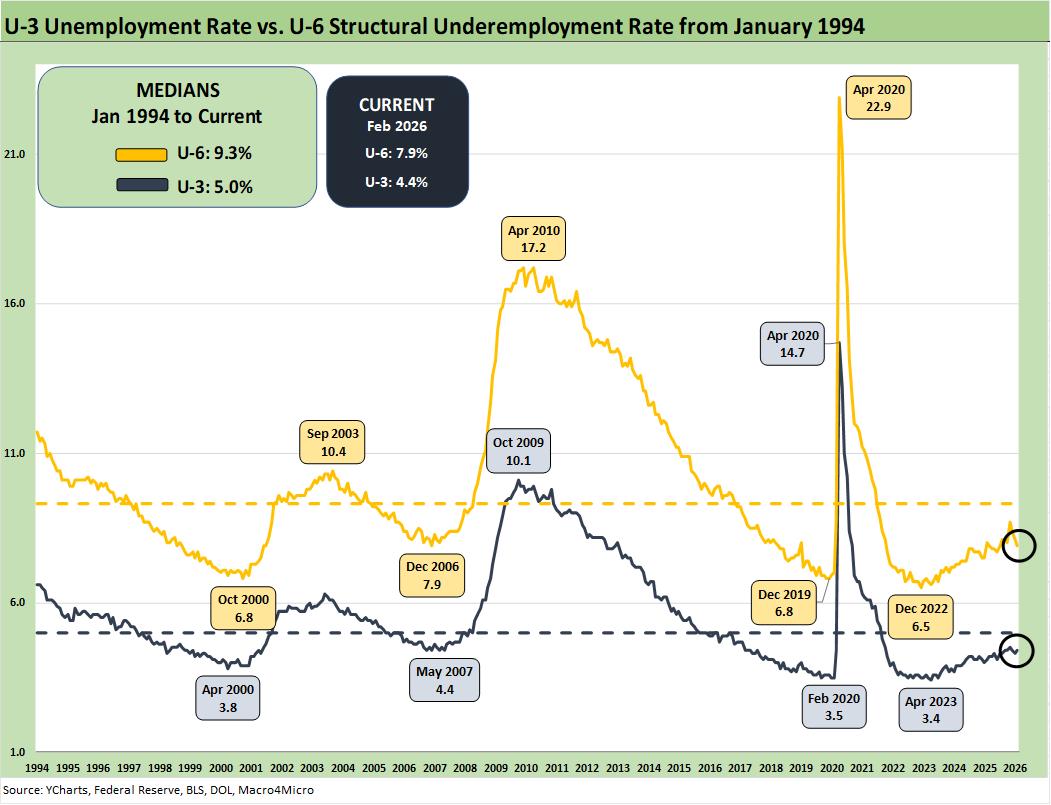
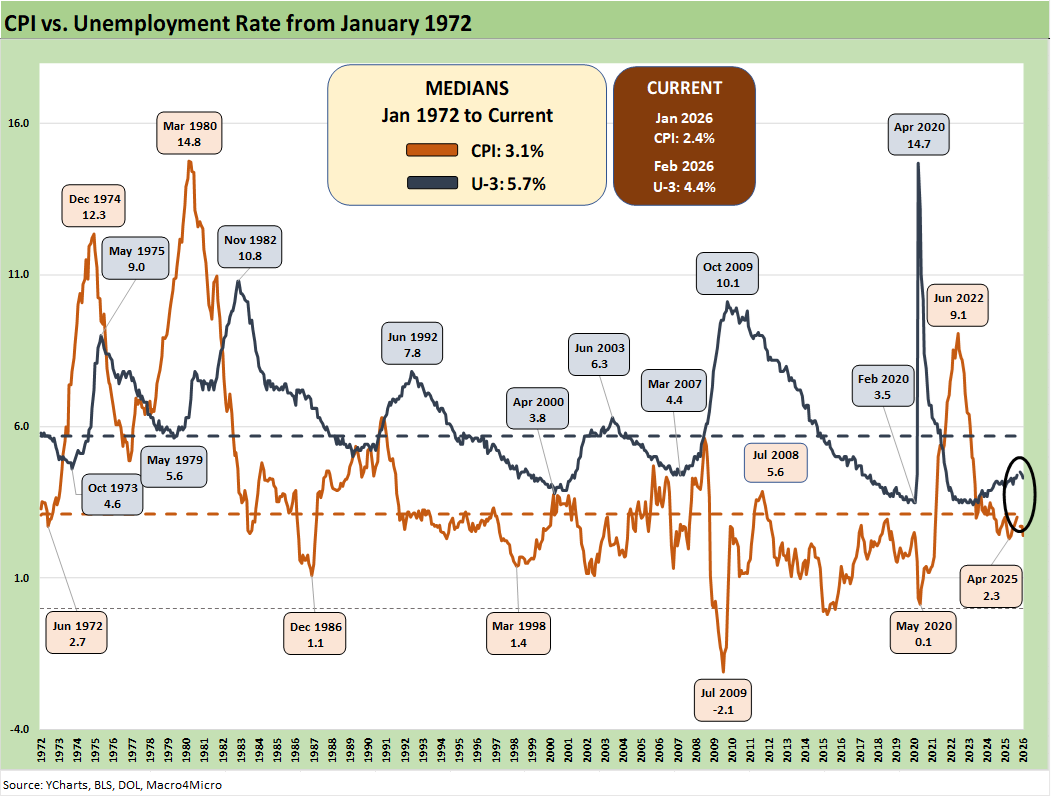
The above chart updates the time series for the U-3 unemployment rate and U-6 structural underemployment rate across the years from 1994. As noted, the current U-3 rate ticked higher to 4.4% from 4.3%. The Feb 2026 U-3 is 2 ticks higher YoY from 4.2% in Feb 2025.
As a reminder, the U-6 metric is defined with the numerator as “total unemployed + persons marginally attached to the labor force + total employed part time for economic reasons.” The denominator is “civilian labor force + workers marginally attached to the labor force.”
The U-6 is the structural underemployment metric that is always useful to watch. The U-6 jumped to 8.7% in Nov 2025 from 8.1% in Sept 2025. To start 2025, the U-6 rose sharply in Feb 2025 to 8.0% from 7.5% in Jan 2025.
The current 7.9 % is well above the 6% handles seen in spring of 2023 but is now at least declining again. The U-6 is still below the median from 1994 of +9.3%, which notably includes the post-crisis shock and the longest recession since the Great Depression.
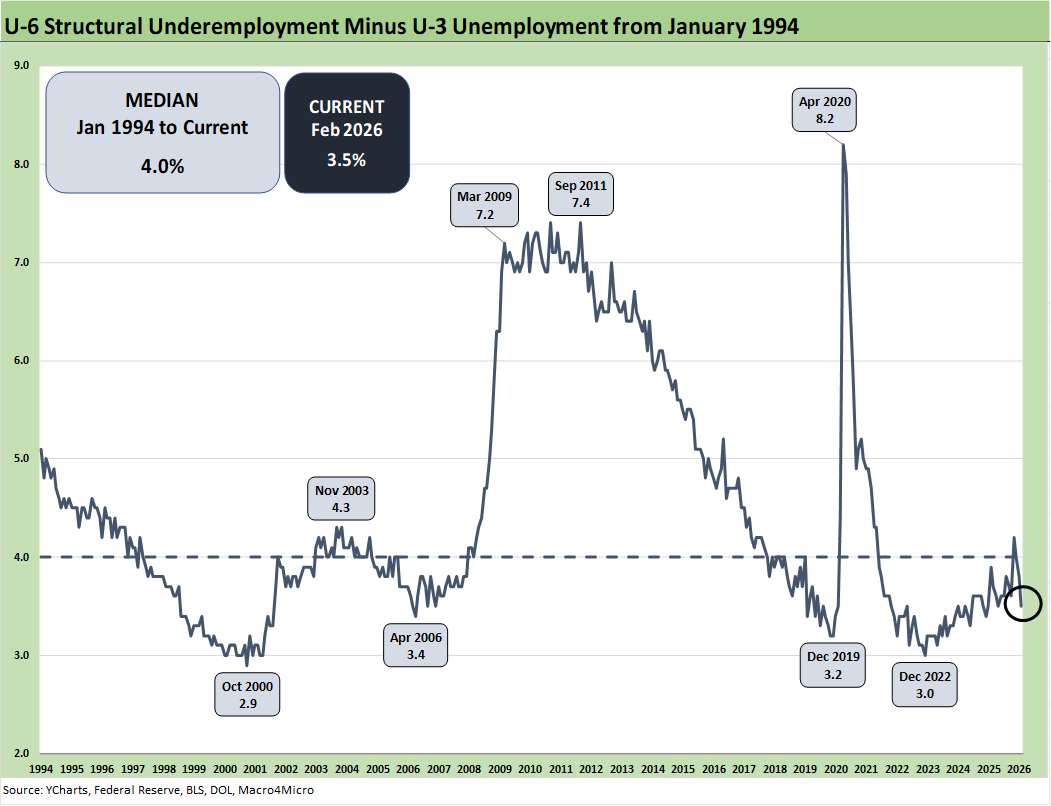
The time series above updates the U-6 minus U-3 differential as a measure of relative employment quality and to flag risks of major dislocations in large swaths of the economy (think oil patch collapse in the late 1980s, tech bubble imploding into a weak 2001-2003, financial services and automotive meltdown in 2009).
The current 3.5% differential is below the long-term median of 4.0%. The job ranks are still vulnerable now with the Iran war effects just kicking into gear. That comes after a mixed, weak period where tariffs are still getting worked out in terms of hiring and firing decisions.
Many questions will be getting answers with respect to how tariffs will flow into working capital cycles and new capacity planning. The IEEPA SCOTUS decision raises some new inputs to absorb as Team Trump rolls in new tariffs. We also have the energy spike dislocation that will bring more inflation pressures. What that means for interest rates along the curve from the short duration FOMC action is an open item. Short duration UST flows into working capital and consumer durables funding while the longer end drives mortgage rates.
Reshoring has been very slow as the construction and manufacturing payroll trends imply. We are seeing major plans to relocate automotive OEM capacity back to the US, and that should attract more supplier chain capex. The auto supplier to OEM chain will be a focal point in the upcoming USMCA review process with Canada and Mexico. Autos is only one small piece of the manufacturing picture despite all the headlines.
In contrast to autos, the idea of a major new aluminum smelter in the US will not happen based on economics and the timeline to build one. Low-cost power is essential for such smelting activities, and data centers would be happy to pay a multiple of what an aluminum smelter would see as cost effective. There are a lot of stories along the manufacturing chains with some good and plenty bad. For now, manufacturing payrolls are “net bad.”
Some of the risk issues get swept up in immigration and deportation numbers, but the analysis always comes back to the number of workers with paychecks. Employers will be making decisions to mitigate the tariff damage with tariff cost mitigation strategies (e.g., layoffs) if they are not passing along the cost in prices or want to limit the scale of price increases to customers.
The AI wildcard in manpower needs sees a lot of speculation in the manufacturing sectors but even more so in Services payroll speculation. That has been evident in some recent stock volatility across SaaS-based business services leaders.
There is no hiding from the need for economic reactions along the supplier-to-customer ecosystem. Someone always pays – including those “paying” with layoffs in tariff cost mitigation decisions.
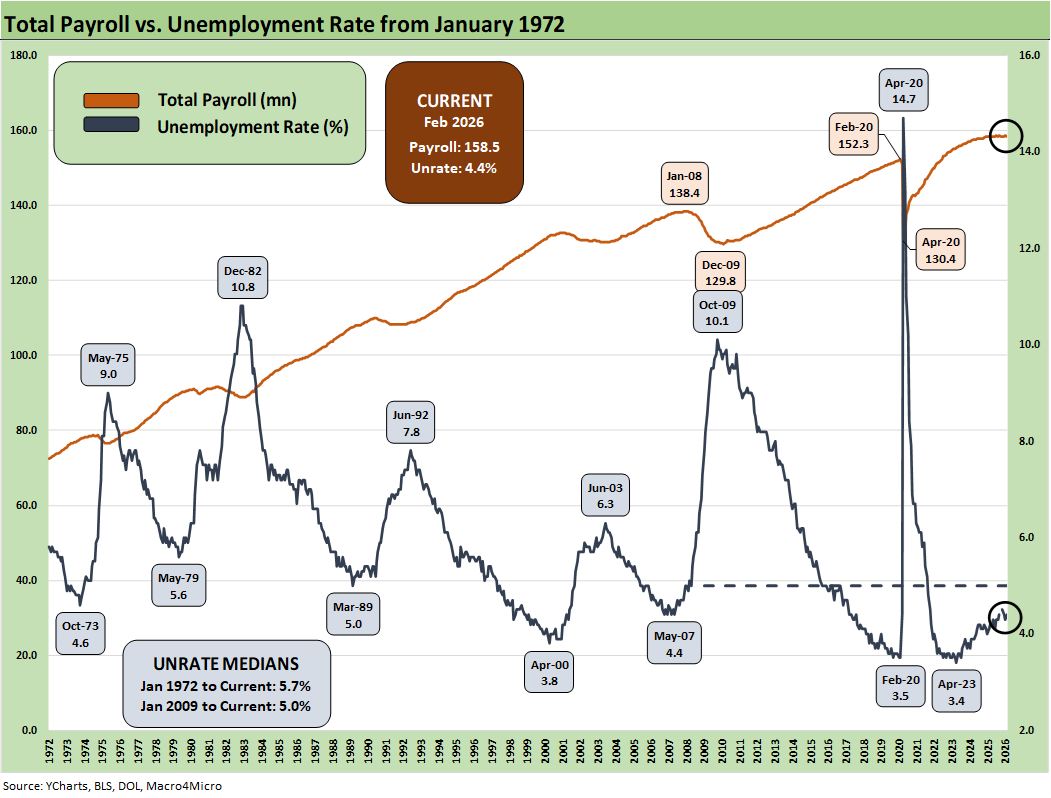
The above chart updates total payroll vs. the unemployment rate. More bodies with more paychecks are always a good thing. The trick from here is how the consumer deploys that paycheck and whether the zero-sum realities of household budgets undercut spending. The need for defensive spending habits in light of impaired household discretionary cash flow could become a bigger headwind in the aftermath of the Iran fallout.
We see the ranks of employed in Feb 2026 decline by -185K MoM in the Household Survey. That decline YoY was -426K. That trend now is telling a deteriorating employment story. The ranks of the unemployed rose by +203K MoM in the Household Survey and rose by +467K YoY. The -92K payroll numbers in Nonfarm Payroll in the Establishment Data is also clearly negative.
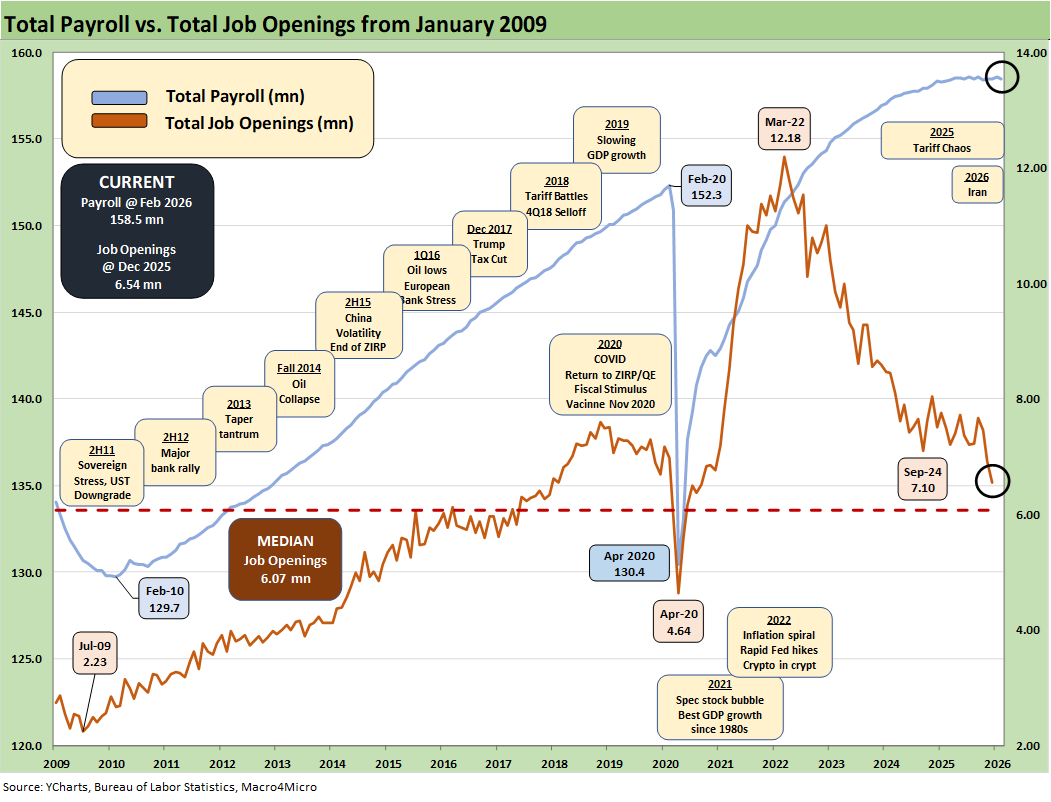
The above chart updates the total payroll number vs. job openings. JOLTS data analysis is still recovering from the shutdown, and the Jan 2026 JOLTS data gets released this coming week. The Dec 2025 Job Openings data was down by almost 1 million (966K) from Dec 2024 to 6.54 million. On a constructive note, Manufacturing job openings were essentially flat as was Durables.
Management teams have a lot of moving parts to factor into planning whether quantitative or qualitative. The final IEEPA decision from SCOTUS came in against Trump, but he was prepared to start slapping on tariffs under Section 122, 232, and 301. Those are topics for other days and have been looked at in the many past commentaries (see Meanwhile…Back in Economics and Tariffs 3-2-26, US Trade with the World: Import-Export Mix 2-25-26).
The fallout in consumer spending from health care premium increases and retrenchments in SNAP spending and eligibility criteria could signal trouble ahead in the lower part of the “K” household mix. Now we add in the Iran setbacks and energy cost pain and cyclical pressures that will come with those effects. We get the Personal Income and Outlays data this week. The Iran effects come later.
Inflation reports had generally brought good news relative to expectations given the scale of the forward threat from tariffs and lagging effects to be seen across working capital cycles. That said, the inflation creep and affordability strain is clearly in evidence and taking a toll on inflation across select product groups. PCE inflation has been rising (see PCE Income & Outlays Dec 2025: Inflation Reversal? 2-20-26). We get CPI this coming week. We get fresh PCE data also.
Tariffs will stay in the thick of the pricing pressure battle, and industries such as autos are likely to see more upward price pressure after a year of relative caution by OEMs to protect their customer base and dealer network. The OEMs also wanted to move cautiously with Trump (which by itself is a sad comment on how far free markets have suffered under this administration). Now we will be adding much higher energy inflation from gasoline to go with the very high electricity CPI metrics and utility piped gas inflation.
The overall economic impact is far less than feared given the reality that most trade partners backed down in 2025. That could change in 2026 with many more battles on the table such as a threatened embargo of Spain that would pull in the EU (Anti-Coercion bazooka?) and the USMCA review.
The USMCA review will inevitably create a lot of tension with Canada despite the US goods trade surplus ex-crude oil. Trump needs a cheat sheet on who are the best export markets with around 3 dozen states seeing Canada as the #1 export market. With Qatar facing stress in the fertilizer sector right now, the Canadian position in potash might be worth keeping in mind.
 |
|