
Payrolls Feb 2026: Into the Weeds
We look at the underlying occupation details of a headline payroll contraction as “event risk” flares up and inflation reignites.


February payrolls declined by -92K, and the fear is this could mark an inflection point as headwinds pick up and the risk checklist grows globally and in the US. The Feb 2026 print effectively erases gains from a solid January and continues mediocre labor market growth across 2025. While Feb payroll was distorted by 31K of idled healthcare workers due to a strike, it still leaves a -61K decline that in tandem with the -69K downward revisions to December and January reflect a cooling trend.
With the caveat of the strike distortion, the private payroll contraction of -86K is the worst since December 2020. Overall, we see this as a possible transition to further labor reduction, especially given some high-profile layoff headlines. This aligns with where we have seen fragility in past reports with the disruptive forces across AI implementation still in early stages.
As we look across the mix, leisure & hospitality (-27K) and healthcare and social assistance (-19 K) were the major disappointments. Combined with declines in both construction (-11K) and manufacturing (-12K), this release points to where there are both cyclical and noncyclical engines that are off to a slow start in 2026. The weakness has regularly been a problem for manufacturing, but it is now hitting services also.
The FOMC calculus gets complicated with another spike in geopolitical risk and potential inflation pressures across a range of line items with gasoline at the top of the list. That impact is highlighted almost daily in retail gasoline price trends. Retail prices at the pump are up almost 16% higher ($2.98 to $3.45) in only a week through March 8 per AAA.
Inflation will necessarily rise into the later spring due to the immediate oil price action while the specter of a weakening labor market will give both sides of the FOMC “ease vs. no action” debate getting fresh talking points. We get CPI and PCE inflation this coming week, and that will not include the effects of these latest changes. We also will be curious to see if the measurement practices of the BLS evolve and give a hint of the health insurance premium increases that did not show up in the last set of numbers (see CPI Jan 2026: Reassuring Numbers, Missing Pieces 2-13-26). That is a topic for another day.
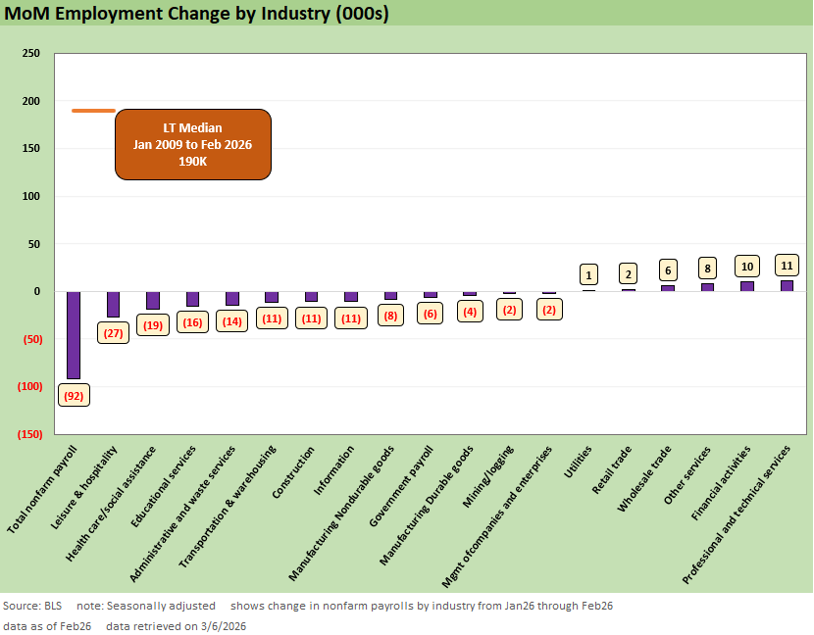
The above covers the MoM changes for February and the -92K contraction above is broken out among the major groups seen in Table B-1 of the payroll reports (Establishment data). Though previous reports have often seen headline numbers give cover to how payrolls has shown weak breadth, we have maintained that the composition of gains in 2025 was overly reliant on healthcare job adds. The labor market was much more fragile than it appeared. With this month seeing contraction in healthcare (even if with strike distortions), we can see the limited underlying breadth in a weak February.
Even incorporating the distortion from the noted -31K worker strike affecting the healthcare sector, adding that back still amounts to a significant loss of momentum in the healthcare sector overall. That will put downward pressure on overall labor market growth as the three-month moving average moves down to just +6K.
As we look forward, the labor market overall faces fresh potential pressures as the Iran story and effective closure of the Strait of Hormuz will heighten risk in the consumer and small business sector and potentially undermine some budgeting decisions for larger companies.
While these events do not influence the February data, the headwinds arrive as the domestic labor market appears to be reaching an inflection point. The prospect of sustained high oil prices (above $90 as we go to print) alongside a new round of tariff-driven uncertainty points to further challenges to properly handicapping the direction of consumers, capex, and monetary policy risks.
Into the Weeds…
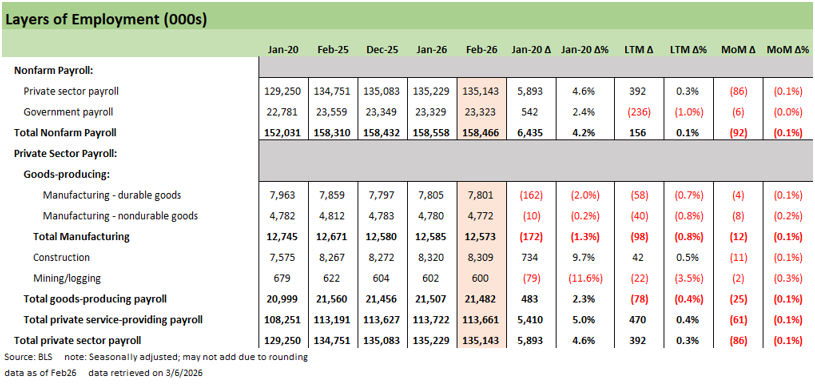
The above chart provides the high-level breakdown across private vs. public and services vs. goods-producing. This month’s contraction sees no growth in any of the line items listed above. The consistent growth of the private sector was challenged in February.
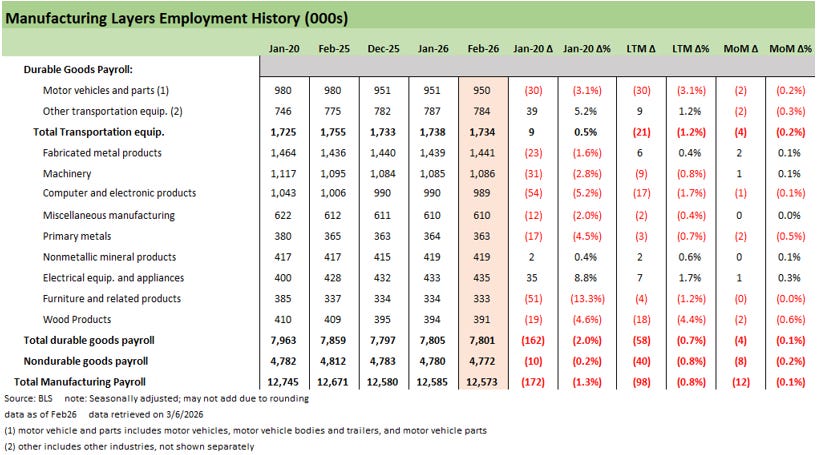
The manufacturing payroll mix is shown above. The durables payrolls are fairly mixed across a -4K contraction and better than nondurables, which was down -8K. We focus on the durables details above with the contraction on the month generally weighted more heavily toward transportation even if mixed across some other areas.
Manufacturing is a key barometer of the effectiveness of tariff policy across the last year. Given the desire to catalyze a manufacturing renaissance or at least a reshoring wave of critical industries, declines in payroll growth for the majority of these industries across the LTM period into 2026 bodes poorly for successful policy execution.
We have written in the past about how steel and aluminum tariffs alongside broader unilateral tariffs are not likely to drive the volume of growth intended. So far, the results above do not come as much of a surprise.
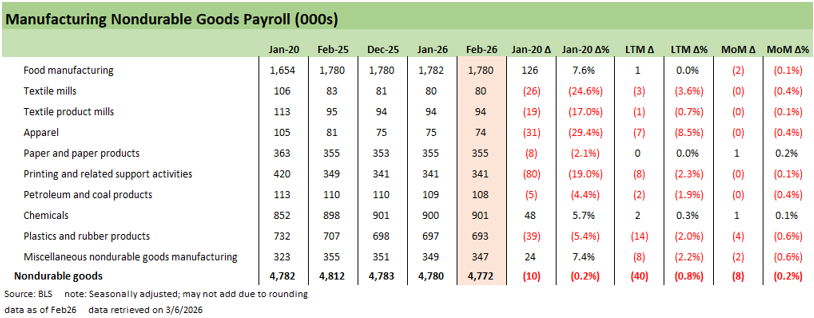
Nondurable goods manufacturing payrolls continue a contractionary slide in February as the long-term secular decline across these industries continues to show. There are some key areas to watch for the upcoming month across petrol, coal, and chemicals where we expect outsized economic impacts due to oil price spikes. Chemicals is a major industry and employer, but petroleum and coal products are more about political clout than job numbers.
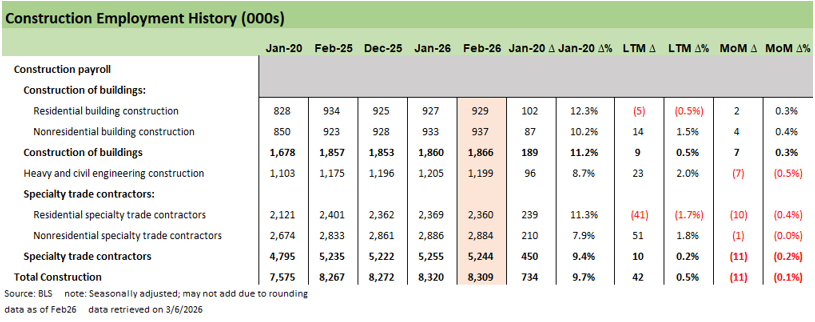
As opposed to manufacturing, construction has been a brighter spot. Recent periods show more differentiation across residential and nonresidential sectors, and this month sees that continue. The potential for sustained high interest rates with inflation could bring some setbacks in the very bullish tech-centric capex expectations and data center activity. Revision to bullish valuation models will be something to watch with all the Iran fallout.
A major theme driving construction as a bright spot has been AI-related capex, though the many billions in spending plans or commitments has little to show in terms of the employment data. We see that a large part of AI capex and spending are tied to imported tech products that drive this perceived gap. The bridge between AI capex narratives and construction labor growth is a trend we will continue to track. Data centers can only be built so fast and plans face material lags.
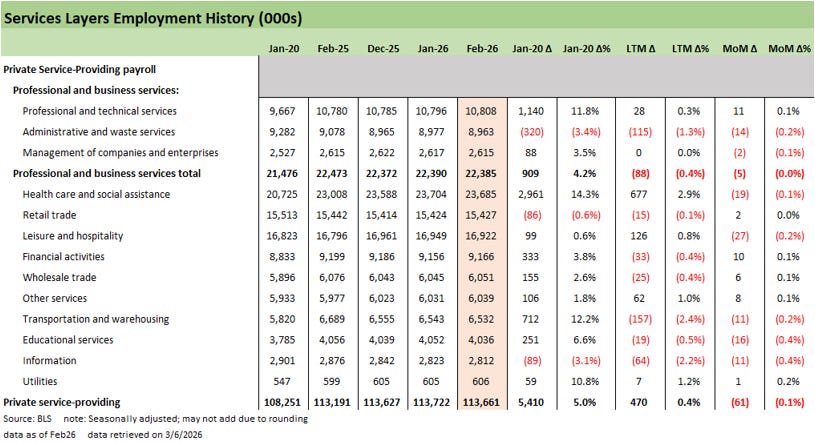
Services payrolls above have been the core driver of growth. In February, we see several major industries with weakening payrolls including leisure & hospitality (-27K), educational services (-16K), healthcare (-19K), transportation & warehousing (-11K) and information (-11K) on the month.
Declines in these areas point to lower discretionary economic activity. Another hit to the household wallet could come in the form of an oil price shock that could further exacerbate some of those spending declines. That goes beyond filling up the tank of the personal car and gets into surcharges on all goods at delivery.
As a reminder, personal consumption expenditures (PCE) is 68% of GDP. We get the second estimate of 4Q25 GDP this week. We could see the above services numbers in time providing possible early signs of AI displacement (or more generic tech) bringing layoff activity and signaling growing vulnerability to AI disruption. It is still early in that game.
Stripping out distortions to the healthcare line this month still leaves questions around labor market health. Adding back the 31K strike distortion in February health care still only comes to 12K growth, which is well below the 56K average across the LTM period. This was a sector that was the lion’s share of private sector growth last year. Even if there is a minor distortion, when stripping out that distortion the health care line still shows signs of a slowdown and that bodes poorly for 2026 labor market growth.
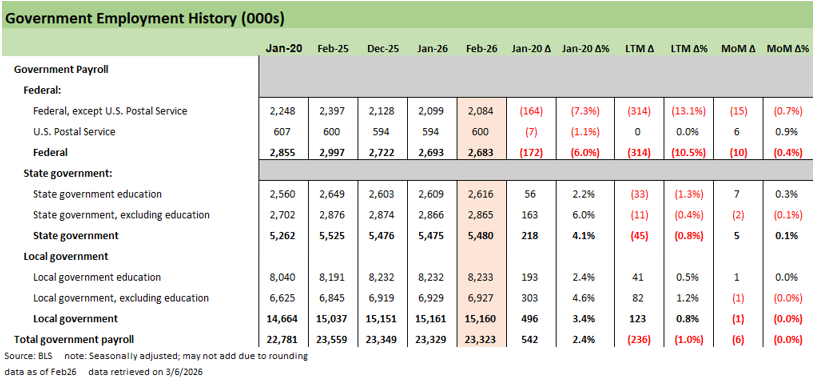
Finally, the government lines above show a continued bleed in Federal payrolls. Across the last year of layoffs and shutdown activity, the actions have led to payroll volatility. We’ve often netted out government changes to get a clearer picture on the larger economy. That said, retrenchment and payroll weakness could continue to flow into the GDP lines and spending across the economy. It is as simple as “bodies without paychecks.”
The February data points to a labor market starting to exhibit some of the structural fragility that we’ve noted across the past year. The headline was weighed down by strike distortions, but it is challenging to be optimistic with weak private hiring while rolling into an oil shock with the potential for further geopolitical noise in the near-term. Next month will be particularly telling to test the resilience of the services growth engine. We will see in the spring if Feb 2026 becomes an inflection point or there is room to bounce back.
 |
|