
US-Taiwan Trade: Risks Behind the Curtain
The major swing in Taiwan imports in 2025 can prove that sometimes higher trade deficits can be a good thing.

Semiconductor industrial policy…Too many traps?
We look at the sustained climb in the US-Taiwan goods trade deficit through LTM Nov 2025 as records were set during Trump 1.0, under Biden, and now are soaring. The LTM import spike was led by a near tripling of Computer Equipment and more than a 50% rise in Semiconductors.
Taiwan trade as a has topic many layers as the #4 national trade partner of the US. The layers run from industry specific to geopolitical given the “one China” elements and who will directly control Taiwan’s trade flows down the line. The record-shattering trade deficit raises the issue of when “trade deficits can be a good thing.” Taiwan’s supplier chains feeds US tech valuation nirvana of recent years and its expected value down the line. The recent deficits are not a “subsidy” of Taiwan or a case of the US being “ripped off.” Taiwan makes goods the US needs and wants. While the manufacturing gap is being worked on by policy and Taiwan trade terms (a topic for another day), the increased deficits signal very positive US demand and favorable tech sector trends.
Much has been written about the need to reduce the US exposure to geopolitical risk and bring more semiconductors and related technology-intensive manufacturing back into the US. Taiwan is at the epicenter of these trade issues (see Fact Sheet: Restoring American Semiconductor Manufacturing Leadership Through an Agreement on Trade & Investment with Taiwan 1-15-26).
As Trump talks about his “Donroe Doctrine” and speaks of annexation or asset seizures from Greenland to Venezuela to the Panama Canal, the “green light risk” for China to move more quickly on consolidating Taiwan presents some glaring trade risk subject to events.
The Taiwan-US trade relationship is a national security issue (as opposed to the usual make-believe ones). The US-Taiwan trade future is complicated by the long-term historic evolution of the “Red Star Over China” across the Civil War that gave rise to the Peoples Republic (PRC). That history was very controversial for the US in the postwar decades. There are no shortages of books on the topic and history classes dedicated to it, but the PRC was recognized by the UN and the US in the 1970s (spanning from Nixon to Carter). Recent events only arm China with more clout in their game plans.
The domestic and global politics of US-China spans decades across the China Lobby years (Luce and Time Magazine, McCarthyism, etc.), across the Korean War, across Ping Pong Diplomacy and the opening of relations championed by notorious red baiter and McCarthy crony Nixon. As the son of a Marine who enlisted out of high school to fight in Korea, the China-Taiwan policy changes of the 1970s were sources of strong opinions, especially when set against the fall of Saigon in 1975.
Recent events matter. If the Trump focus is on military might and hemispheric muscularity while avoiding World War 3 (a topic Trump often brings up against others in the Ukraine context), then it should be noted that Taiwan is in a separate hemisphere and already under the “One China” umbrella. Hopefully somebody will hand Trump some large font history flash cards.
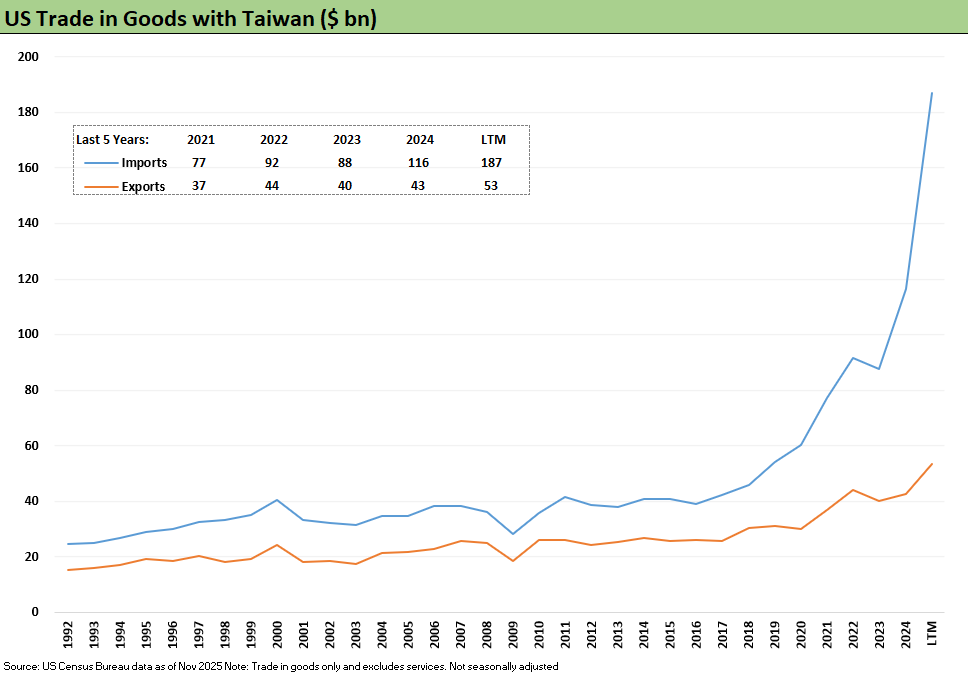
The above chart updates the long-term trend line for Taiwan for both exports and imports. There is little mystery to recent trends in the import line with dramatic growth in semis and computer equipment.
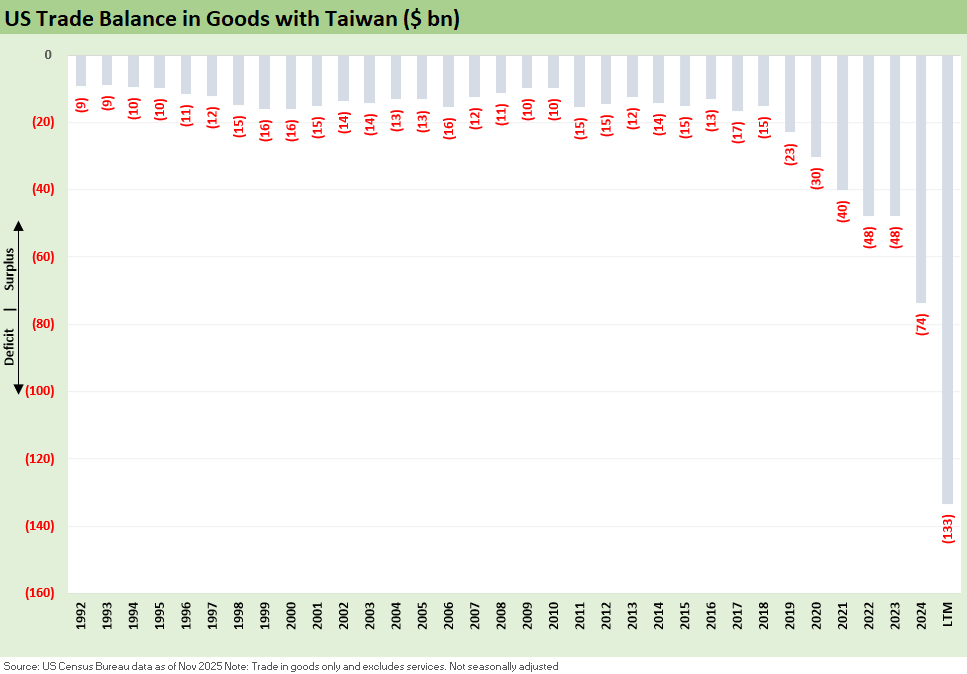
The above chart updates the goods trade deficit in US-Taiwan trade. As covered in the import product line chart below, the increase is concentrated in Computer Equipment and Semiconductors & Electronics.
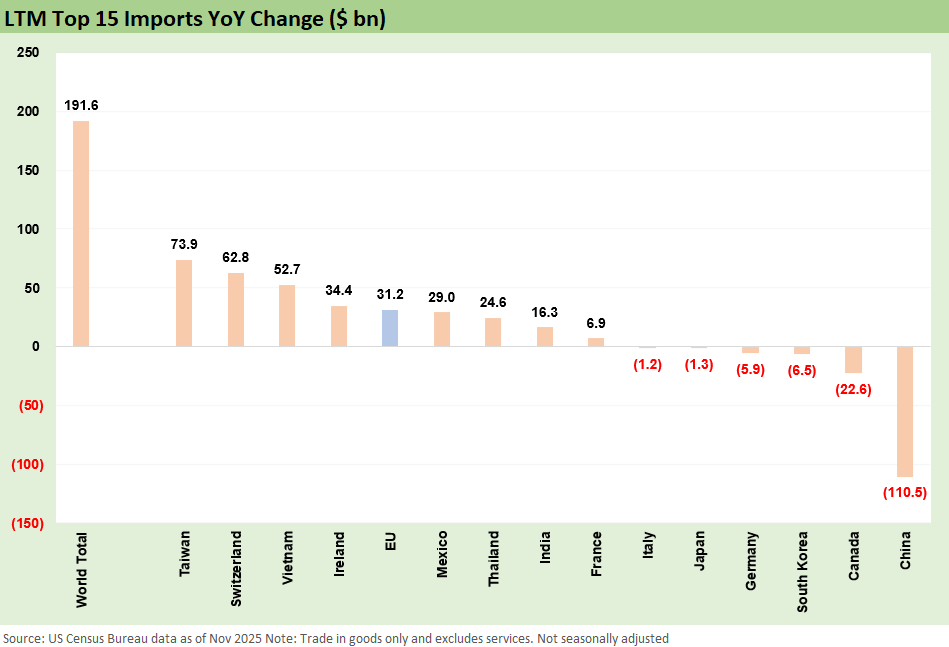
The above chart replicates the list of leading trade partner import deltas we broke out in the broader top-down trade review (see Trade Deficits: Math Challenge 1-30-26). Taiwan posted the highest running YoY import increase ahead of Switzerland and Vietnam. The biggest decline was China. The rise in Taiwan imports can be taken as a good sign for the US economy. After all, when demand is high, good things are happening here. How the tariffs flow into profit margins, costs, prices etc. is an industry-by-industry, case-by-case analysis.
That divergence between China and Taiwan imports could offer some hints on how well China is positioned to keep geopolitical pressure on the US via trade in the future. Trump being assertive around the virtues of expansion by military might and disrespecting sovereignty might not work so well for US interests by giving the PRC a green light to be more aggressive on Taiwan.
A nod and wink at Putin (Ukraine, Baltics) and trashing NATO while Trump has been talking tough on Greenland and Panama Canal sends some questionable signals to China and Russia. Annex the Panama Canal with its pivotal trade role, and Taiwan would be vulnerable. The scenario spinners and foreign policy wonks tend to panic when the status quo gets roiled by threats and reckless rhetoric.
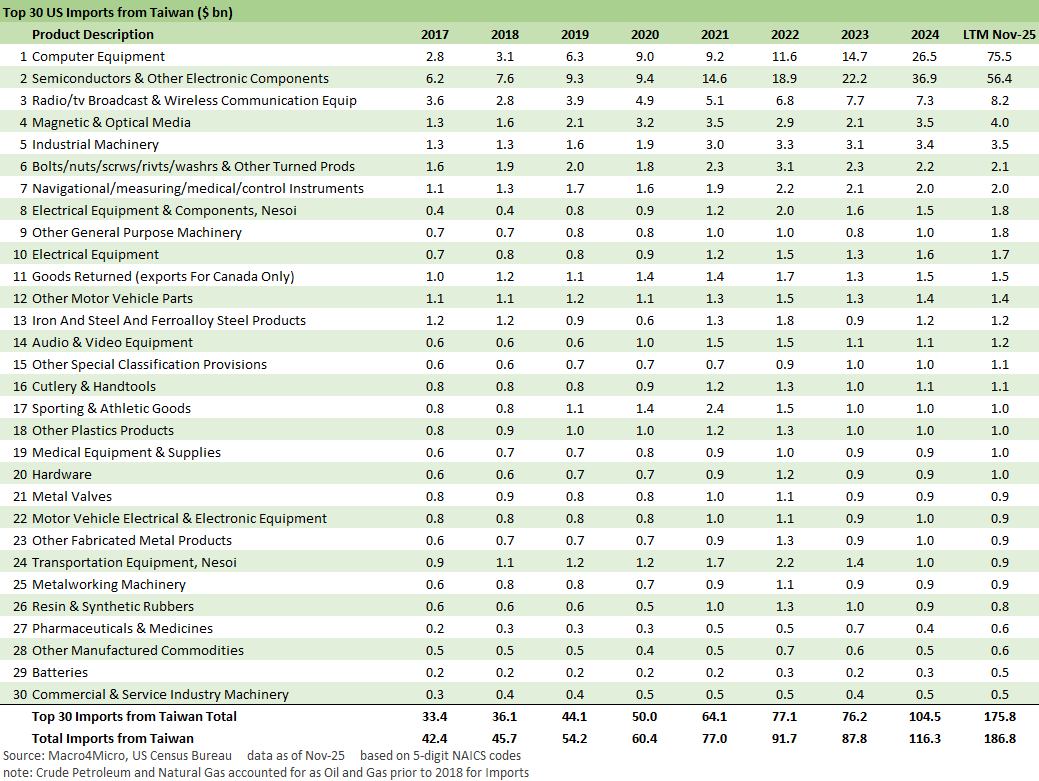
The above chart breaks out the self-explanatory import mix trends. Computer Equipment has increased 27-fold since 2017, and Semis & Electronics is higher by 9-fold. That is a dazzling pace of growth and in line with the tech equity boom and capex plans to keep pace with the infrastructure needs and supporting equipment and services. If one does believe in the reshoring wave, that is a lot of materials, equipment, and tech spending also. The ability to deliver those goods will not be online in the US yet. Winner: Taiwan.
That makes Taiwan (and their deficits) a friend and not an enemy. They are not “ripping us off” with the deficit (the favored term by Trump, as concept-free as it may be). The buildouts and economic growth does not happen without Taiwan.
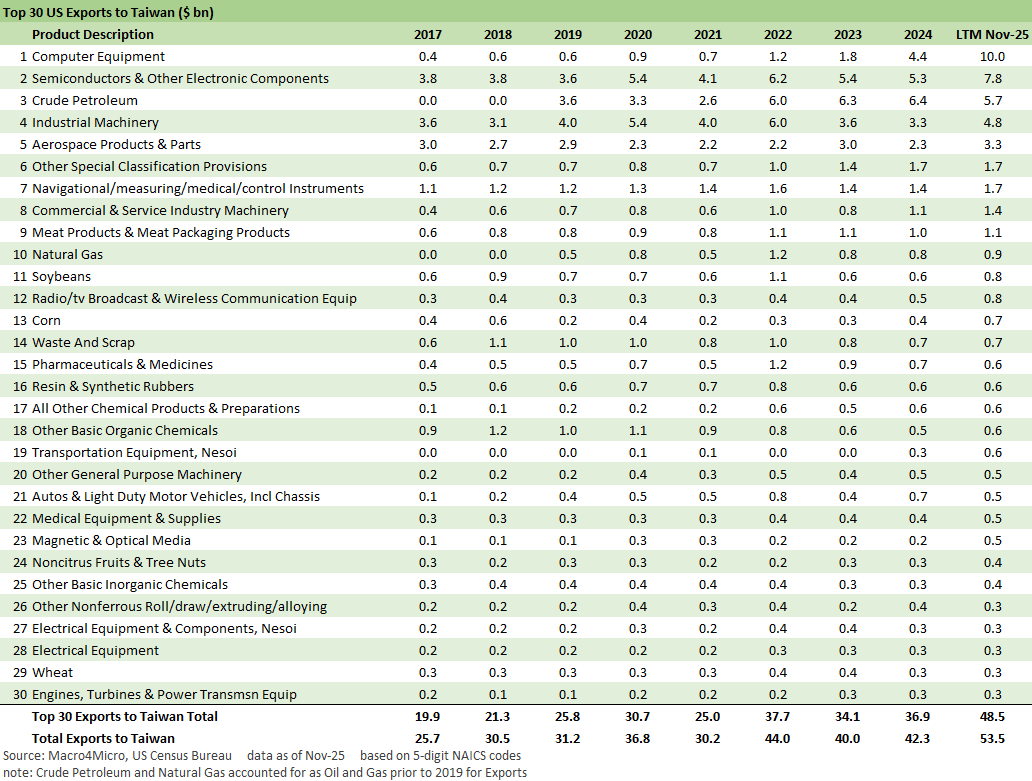
The above chart updates a rather unexciting export mix that is higher but badly lags import expansion. The good news is the exports are rising, just a lot slower than imports.
Tariff commentary:
Trade Deficits: Math Challenge 1-30-26
China Trade: Shrinkage Report 1-28-26
Mexico Trade: Gearing up for More Trade Trouble? 1-27-26
Canada-US Trade: Trump Attack N+1 1-25-26
US-Canada Trade: 35% Tariff Warning 7-11-25
India Tariffs: Changing the Music? 7-11-25
Taiwan: Tariffs and “What is an ally?” 7-10-25
Tariff Man Meets Lord Jim 7-8-25
South Korea Tariffs: Just Don’t Hit Back? 7-8-25
Japan: Ally Attack? Risk Free? 7-7-25
US-Vietnam Trade: History has its Moments 7-5-25
US Trade in Goods April 2025: Imports Be Damned 6-5-25
Tariffs: Testing Trade Partner Mettle 6-3-25
US-UK Trade: Small Progress, Big Extrapolation 5-8-25
Tariffs: A Painful Bessent Moment on “Buyer Pays” 5-7-25
Trade: Uphill Battle for Facts and Concepts 5-6-25
Tariffs: Amazon and Canada Add to the Drama 4-29-25
Ships, Fees, Freight & Logistics Pain: More Inflation? 4-18-25
Tariffs, Pauses, and Piling On: Helter Skelter 4-11-25
Tariffs: Some Asian Bystanders Hit in the Crossfire 4-8-25
Tariffs: Diminished Capacity…for Trade Volume that is…4-3-25
Reciprocal Tariff Math: Hocus Pocus 4-3-25
Reciprocal Tariffs: Weird Science Blows up the Lab 4-2-25
Tariffs: Enemies List 3-6-25
US-Mexico Trade: Import/Export Mix for 2024 2-10-25
Aluminum and Steel Tariffs: The Target is Canada 2-10-25
Trade Exposure: US-Canada Import/Export Mix 2024 2-7-25
US Trade with the World: Import and Export Mix 2-6-25
The Trade Picture: Facts to Respect, Topics to Ponder 2-6-25
Tariffs: Questions to Ponder, Part 1 2-2-25
US-Canada: Tariffs Now More than a Negotiating Tactic 1-9-25
Mexico: Tariffs as the Economic Alamo 11-26-24
Tariff: Target Updates – Canada 11-26-24
Trump, Trade, and Tariffs: Northern Exposure, Canada Risk 10-25-24
Trump at Economic Club of Chicago: Thoughts on Autos 10-17-24
Facts Matter: China Syndrome on Trade 9-10-24
Tariffs: Questions that Won’t Get Asked by Debate Moderators 9-10-24
The Debate: The China Deficits and Who Pays the Tariff? 6-29-24
Trade Flows: Deficits, Tariffs, and China Risk 10-11-23