
Footnotes & Flashbacks: State of Yields 7-6-25
After a relatively quiet week and modestly adverse curve shift this past week, we have a lot of tariff noise on the way.


These tariffs are mine. So it shall be written! So it shall be done!
The UST curve had a mild move higher on the week with the 2Y UST moving more on the strong jobs number putting a dagger in any hope of a July ease. As we go to print, the September ease odds from the CME stand at 66% for 1 cut with over 95% odds for no change in July.
We have a hard time seeing confidence in easing bolstered with the expected wave of tariffs this coming week and a threat to revert to the April Liberation Day levels for any deals not settled by Aug 1. As we saw with the Vietnam tariff news, there seems to be some confusion in the White House on who writes the check to customs with Trump still stating that the selling country pays the tariff (see US-Vietnam Trade: History has its Moments 7-5-25).
Payrolls and unemployment rate are the other side of the dual mandate, so the release was well ahead of expectations. Such hard data points push back on Trump and his minions (see Payrolls June 2025: Into the Weeds 7-3-25, Employment June 2025: A State and Local World 7-3-25). Team Trump sycophants are reportedly angling to terminate Powell for cause.
The Big Beautiful Bill will give the UST markets more to ponder on the topic of UST supply with a weak dollar and a level of systemic debt that will send US sovereign leverage into a zone more like BBB tier Italy even as promises of growth by the bill advocates clash with the overwhelming base of US GDP forecasts looking at sub-2% GDP growth for the next 2-3 years. Examples are the Fed median in the June SEP, the OECD, the World Bank, and JP Morgan (see 1Q25 GDP: Final Estimate, Consumer Fade 6-26-25).
We update the UST slope history for the 3M to 2Y segment of the UST curve as the -54 bps inversion is still a long way from the +57 bps median.
The following updates our rolling weekly State of Yields commentary.

The above chart plots some key cyclical transition periods from the Carter inversion of 1978 across the Volcker years, the1980s credit cycle peak in 1989 (note the 9.2% 3M UST), the TMT cycle faltering in 2000 (on the way to a massive Greenspan easing in 2001), and the housing bubble in 2006. During the 2004 to 2007 period, leveraged derivative exposure and structured credit was out of control and counterparty risk was soaring.
The chart then jumps from 2006 to 2023, which takes the market beyond the crisis period and the ZIRP years and COVID. Both the post-credit crisis period and COVID provoked the Fed into a wave of market liquidity support and confidence building programs that helped save the capital markets and support the banks. That period brought plenty of QE and normalization distortions to the yield curve shape.
The market saw a massive move lower and bull flattener to end 2023 after the 10Y UST peaked in Oct 2023 as we review below. Steeper and higher was not the forecast to start 2024 as the market expected flatter and lower. During 2024, the curve moved in an adverse direction with a bear steepener until a major rally alongside the Sept 2024 easing. That soon brought us a fresh steepening with some rallies and sell-offs along the way.
The current market is facing a balancing act with tariffs finally rolling into working capital cycles and thus raising inflation risk. On top of those tariffs already in place, we will see waves of newly set tariffs with the “reciprocal tariff pause” coming to an end. That will light up a fresh round of headlines in tariff-driven inflation vs. recession risk tied to weaker consumer demand and pressure on corporate expense lines.
The dilemma between inflation and stagnation raises the ultimate specter – stagflation. We have not seen a bout of stagflation since the 1980-1982 double dip, so it will be a new variable for many in the markets in a much more globalized economy.

The above replays our weekly chart detailing the migration of the UST curve from 12-31-21 with memory boxes detailing the tightening dates and magnitude and more recently the easing. The UST curve intermittently mix bear steepening patterns and flattening rallies since the Sept 2024 lows, but market fear was creeping into the shapeshifting after Liberation Day before calming down with the pause.
This week we will be moving out of the pause and back into the reciprocal tariff challenge. We have little to go on at this point other than the Vietnam deal of this past week (see US-Vietnam Trade: History has its Moments 7-5-25). The US has a goods trade surplus with the UK, so that “deal” is limited in value as a framework apart from a higher base level blanket tariff.
After the Sept 2024 lows detailed above, we shifted back into a bear steepening along the way while mixing in some mini rallies. The UST curve will not be helped by record supply and shrinking demand, fears around the worst erosion of the dollar in decades, and diminished confidence in US governance (and in many cases competence). Trade hostility will not help and could even be a motive to avoid UST.
The recent FOMC meeting saw another round of no action by the Fed with an increase in the number of votes for no change in 2025 to 7 from 4 in the “Gang of 19” dot plot (see FOMC Day: PCE Outlook Negative, GDP Expectations Grim 6-18-25). The consumer metrics of late (notably income and PCE) turned soft, so June data (delivered in July) and July data (delivered in Aug) will be critical input for the market as well as the FOMC in September.
Powell gets attacked by Trump since Powell never learned how to kowtow like a GOP Senator or a spineless House Rep. The reality is those FOMC decisions are made by a committee. Similarly, the very weak GDP forecasts and rising PCE inflation forecast medians are generated by 19 economists in the June SEP report and the same for the dot plot.
The very poor GDP forecasts are mirrored by the OECD, the World Bank and numerous major top banks. The bank forecasts are delivered by people who get paid by their employers and rewarded by their clients and they can’t be primaried by Trump (see FOMC Day: PCE Outlook Negative, GDP Expectations Grim 6-18-25).

The above chart details the material move from the peak UST curve of 10-19-23 down into the UST bull rally of Nov-Dec 2023 and then eventually into the lows of Sept 2024. The Sept 2024 low tick only came after a bear steepener hit the curve through the summer of 2024. We then moved back into the bear steepener mode until the tariffs roiled the UST markets and initially sent 2Y to 30Y lower on cyclical fears.
The shift higher from the Sept 2024 lows and the steepening from the low point at the end of 2023 is reflected in the chart. We see the 10Y and 30Y notably higher than Sept 2024 with a more normal shape from 2Y out to 30Y.
The challenge is still that front end inversion from 3M. We look at the history of the 3M to 2Y later in this commentary. The inversion anomaly on the front end during a protracted expansion has been hard to shake with the FOMC holding the line over tariff-related inflation questions. The stubborn 10Y UST has been a headwind for the housing markets (see New Home Sales May 2025: Slip and Slide 6-25-25, Existing Homes Sales May 2025: Sequential Stronger, YoY Weaker 6-23-25, Home Starts May 2025: The Fade Continues 6-18-25, Lennar 2Q25: Bellwether Blues 6-20-25).
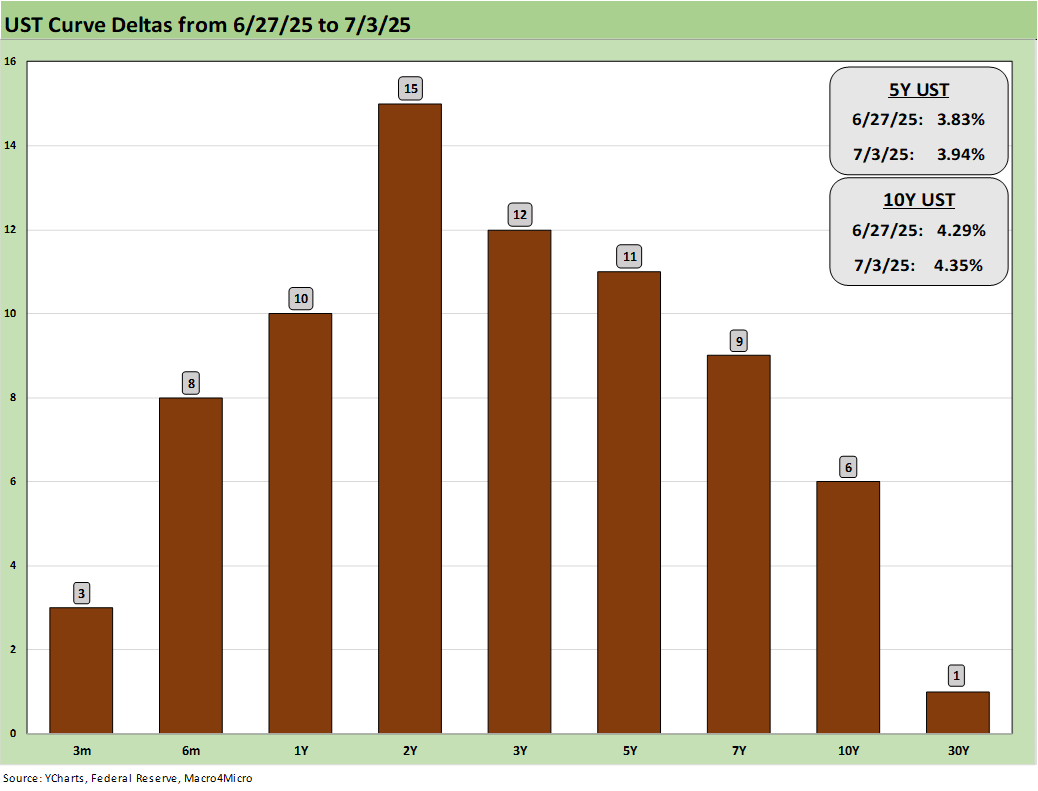
The above chart updates the weekly UST deltas and we see a mild bear flattener on the week with the 2Y UST moving sharply and the 10Y and 30Y making smaller moves. The payroll numbers were not supportive of easing, but the signs of economic weakness developing in the consumer sector will remain a source of concern (see PCE May 2025: Personal Income and Outlays 6-27-25, 1Q25 GDP: Final Estimate, Consumer Fade 6-26-25).

The above chart updates the YTD UST deltas. This is why all the bond ETFs have generated positive returns YTD and some spread compression has helped in the riskier credit asset classes of the bond ETF mix (see Mini Market Lookback: Bracing for Tariff Impact 7-5-25, Footnotes & Flashbacks: Asset Returns 7-6-25).

The above chart updates the UST deltas since the 9-16-24 lows that came alongside the easing. That has not worked as many market watchers predicted on the shape of the UST curve and number and pace of easing that was supposed to follow. Trump continues to rail at the Fed and Powell, lately demanding 200 bps of easing, up from 100 bps in cuts.
Trump offers little in terms of concepts or facts in his usual rants and insults with a few new lapdogs joining in (including the new head of the FHFA who calls upon his broadcast journalism degree for his economic input). The latest is an attempt to terminate Powell for cause on specious grounds. That will be a headline for a different day.
The FOMC would likely be easing if it was not for Trump’s over-the-top and unprecedented tariff game plan. Powell said as much in his Washington testimony. Easing would appear to need a jobs setback that has not appeared in recent releases.
The summer period should answer some questions on the initial price vs. cost impacts of tariffs. The latest wildcard in macro risk was the military clash with Iran, but that faded quickly. Oil prices are usually tagged as transitory across the years, so tariffs will remain the main event for the summer.

The above chart updates the UST deltas from the end of 2023 after a massive rally in rates and risk in Nov-Dec 2023. The follow-on in 2024 expected by the consensus mildly disappointed the UST bulls in the number of FOMC cuts. The market got 4 x 25 (a double in Sept) but not the number of 5 to 6 FOMC 25 bps cuts anticipated). The expectation of a pronounced bull flattening during 2024 also did not play out as anticipated when a bear steepener prevailed by the end of the year. As detailed in the earlier chart, the 2025 period has fared better for bonds on a modest bull steepener.

The above chart updates the running UST deltas from the 10-19-23 peak date of the UST 10Y when it barely missed the 5.0% line. For those looking for a frame of reference on what a bad move in inflation metrics might mean, these deltas at least offer a recent set of data points during an inflation fighting year such as late 2023 and into 2024 (until Sept 2024 began the easing process). That is why we keep revisiting that timeline. It reminds us what reversion could mean.
These rally deltas could revert in part or in whole with the wrong inflation outcomes. We don’t need to see 2022 again, but the old saying “It happened before, it can happen again” resonates for many.
Losing a rally of -63 bps in the 10Y UST above would hurt the mortgage market and would lead to a material valuation headache in equities, M&A economics, and capital project planning. Mortgages have been a drag on housing (new and existing home sales). The risk of inflation heading the wrong way would do more damage. Stubborn rates or higher rates in the short end to 5Y would damage consumer durables financing and related volumes.

The above chart is one of those replay slides we update each week. This one posts the UST curve for this past Friday and the Freddie Mac 30Y Mortgage benchmark rate (noon Thursday release). We include two useful historical periods including the peak homebuilder year end of 2005 and mid-2006 when RMBS quality concerns were catching headlines as the housing bubble was peaking.
We post UST curves for each period in the chart. The past week saw rates move lower to 6.67% from 6.77% the prior week and 6.81% the week before. We have seen minor moves recently, but that was after a 200 bps range since fall 2023.
We include a column above detailing the differential between the Freddie Mac 30Y and the 10Y UST. That differential moved lower this week to +232 bps from +248 bps. The year 2005 posted a differential of only +100 bps and makes a statement on what the mortgage market was like in 2005. The mortgage market was very hot back then in the housing bubble as mortgage volumes soared during that peak homebuilding year and a very busy period of refinancing was running alongside as a source of funds for homeowners.

We update the 3M to 2Y UST curve slope above since 1984 with the current inversion of -54 bps dramatically different than the long-term median of +57 bps. We also include the slopes and long-term medians of the other curve segments we watch.
The front-end inversion remains an anomaly, and that heightens pressure on the FOMC to ease given that history. That said, the market is also coming off the first inflation spike since the early 1980s. That has in turn promoted caution given the stagflation threat that is considered an economic kiss of death after the experience of 1980-1982 and the double dip recession.
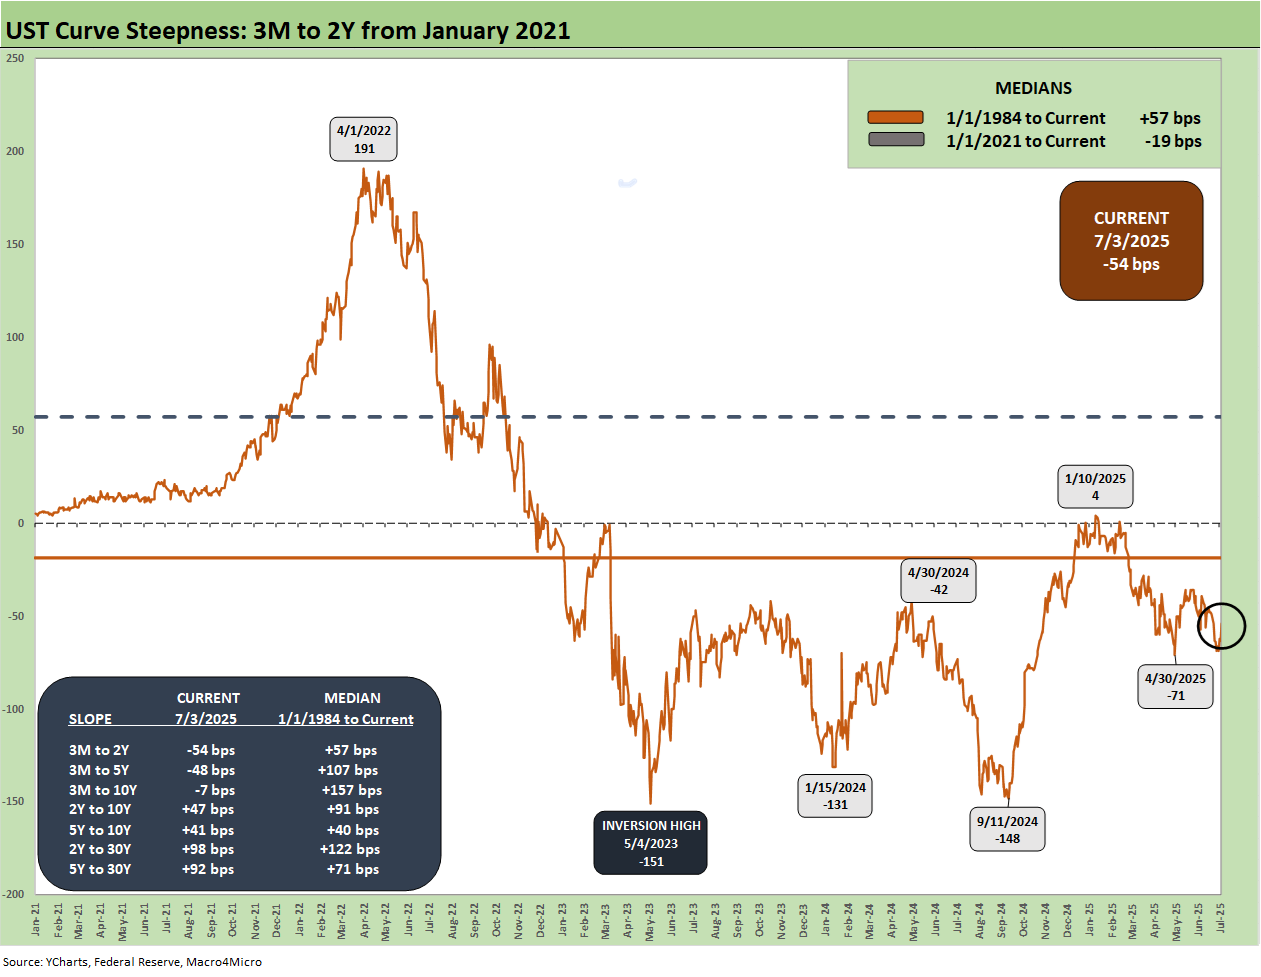
The above chart shortens up the timeline on the 3M to 2Y UST slope and starts the time series during the ZIRP period in early 2021. We see the peak inversion of -151 bps in May 2023 and a fresh move to -148 bps in Sept 2024. The tightening cycle morphing into an easing cycle has been set against a volatile 2Y UST as the market tries to handicap FOMC policy.

We wrap this week’s State of Yields with an update of the running UST deltas since March 1, 2022 just ahead of the end of ZIRP (effective 3-17-22). We include the 12-31-20 UST curve and 10-19-23 peak UST curve as frames of reference.
See also:
Footnotes & Flashbacks: Asset Returns 7-6-25
Mini Market Lookback: Bracing for Tariff Impact 7-5-25
US-Vietnam Trade: History has its Moments 7-5-25
Payrolls June 2025: Into the Weeds 7-3-25
Employment June 2025: A State and Local World 7-3-25
Asset Return Quilts for 2H24/1H25 7-1-25
JOLTS May 2025: Job Openings vs. Filling Openings 7-1-25
Midyear Excess Returns: Too little or just not losing? 7-1-25
Footnotes & Flashbacks: Credit Markets 6-30-25
Mini Market Lookback: Eye of the Beholder 6-28-25
PCE May 2025: Personal Income and Outlays 6-27-25
Durable Goods May25: Aircraft Surge, Core Orders Modest Positive 6-26-25
1Q25 GDP: Final Estimate, Consumer Fade 6-26-25
New Home Sales May 2025: Slip and Slide 6-25-25
KB Home 2Q25: Negative Industry Trends Keep Coming 6-25-25
Existing Homes Sales May 2025: Sequential Stronger, YoY Weaker 6-23-25
Mini Market Lookback: FOMC Spoke Clearly, Iran and Trump up next 6-21-25
Lennar 2Q25: Bellwether Blues 6-20-25
FOMC Day: PCE Outlook Negative, GDP Expectations Grim 6-18-25
Home Starts May 2025: The Fade Continues 6-18-25
May 2025 Industrial Production: Motor Vehicle Cushion? 6-17-25
Retail Sales May 25: Demand Sugar Crash 6-17-25
Mini Market Lookback: Deus Vult or Deus Nobis Auxilium 6-14-25
Credit Snapshot: Hertz Global Holdings 6-12-23
CPI May 2025: The Slow Tariff Policy Grind 6-11-25