
Footnotes & Flashbacks: State of Yields 1-12-25
The problem with inheriting a very good economy is the UST curve will keep reminding you of that fact as UST supply and costs soar.


Plan B? The budget and issuance supply planning is getting spooky.
Revisiting the UST curve jitters will be around for a while with the economy solid, payrolls strong, economic growth in 2Q24 and 3Q24 running above the 3% line with the advance 4Q24 numbers due out at the end of January.
The one major variable that could hurt the economy is massive tariffs and trade retaliation, and that is also the main threat to a fresh round of pressure on prices and household purchasing power – whether you call it “inflation” or some other economic euphemism.
The market will start to look for more reasons to worry about even slower FOMC easing action in 2025 after the Dec FOMC meeting revisions spooked the market.
CPI and Retail Sales are out this week as 4Q24 earnings season heads into the next gear.
We update the slope of the 5Y to 30Y UST segment of the curve as the 30Y gets closer to 5%.
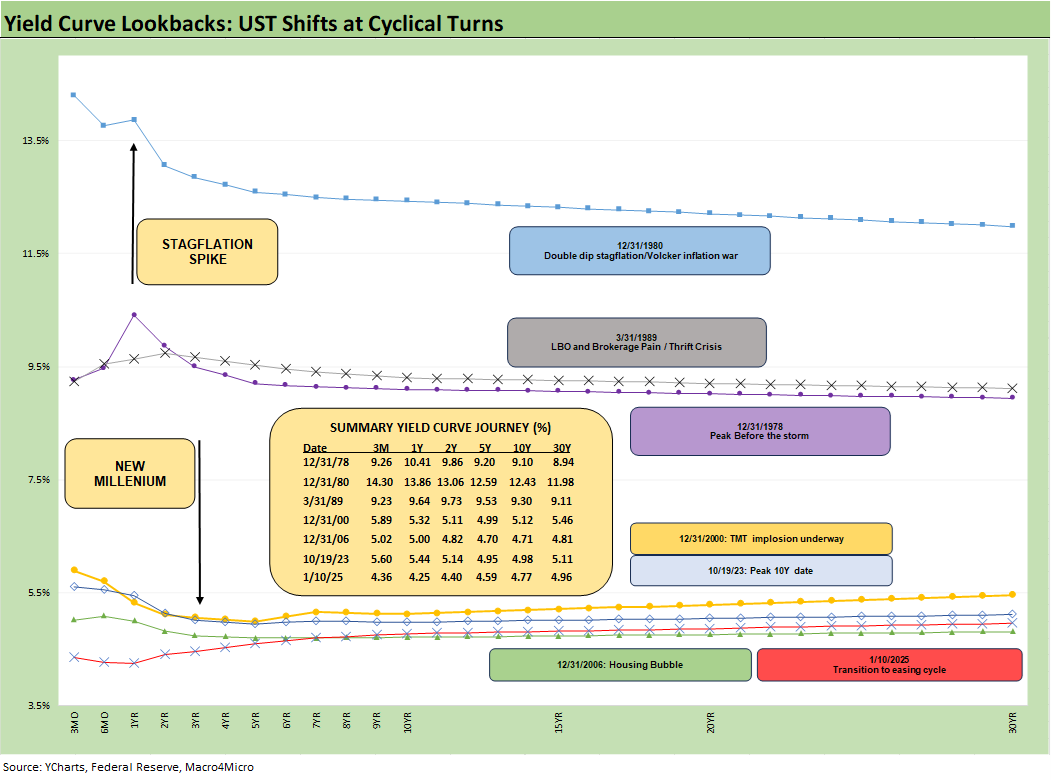
The above chart plots the cyclical migration of the UST curve at interesting turning points in the cycles. These dates offer useful frames of reference such as the 1978 Carter inversion before the inflation chaos and Iran oil crisis of 1979 and ahead of the 1980-1982 double dip recession when stagflation set a very high bar for pain.
While the recurring refrain of “four decades ago” was a constant mantra in 2022 that quickly became politicized, the reality is that the 2022 inflation never got close to the fallout seen in the Volcker years. As bad as the inflation peak was at 9.1% CPI in June 2022 (see CPI Nov 2024: Steady, Not Helpful 12-11-24), this cycle saw no recession and inflation quickly subsided with a healthy consumer sector, solid payrolls, and a sustained high rate of fixed investment (see Fixed Investment in 3Q24: Into the Weeds 11-7-24).
The above chart focuses on the pre-crisis, pre-ZIRP cycles for comparison. The FOMC policies after the systemic crisis of 2008-2009 and later COVID generated material distortions in the curve that make for less useful comps. We cover those UST curves throughout our research but the best comps for now are the pre-ZIRP, pre-QE, less distorted years. That is especially the case with inflation now materially below the long-term median and the FOMC in the process of an easing cycle that started in Sept 2024. Whether that continues and at what pace is part of the 2025 macro debate.
We plot the UST curves across time up through the end of 2006, and the 10Y UST has now moved above the 10Y seen at the end of 2006. Meanwhile the 3M and 2Y UST yield is comfortably below that posted at year end 2006.
The UST curve is now lower than 12-31-2000 in 3M, 2Y, 10Y, and 30Y but mixed across the segments relative to 12-31-06. The idea of hitting 5% on the 10Y UST is easily rationalized in the context of pre-ZIRP history. The 10Y UST was just shy of 5% on 10-19-23 as we plot above and revisit below.
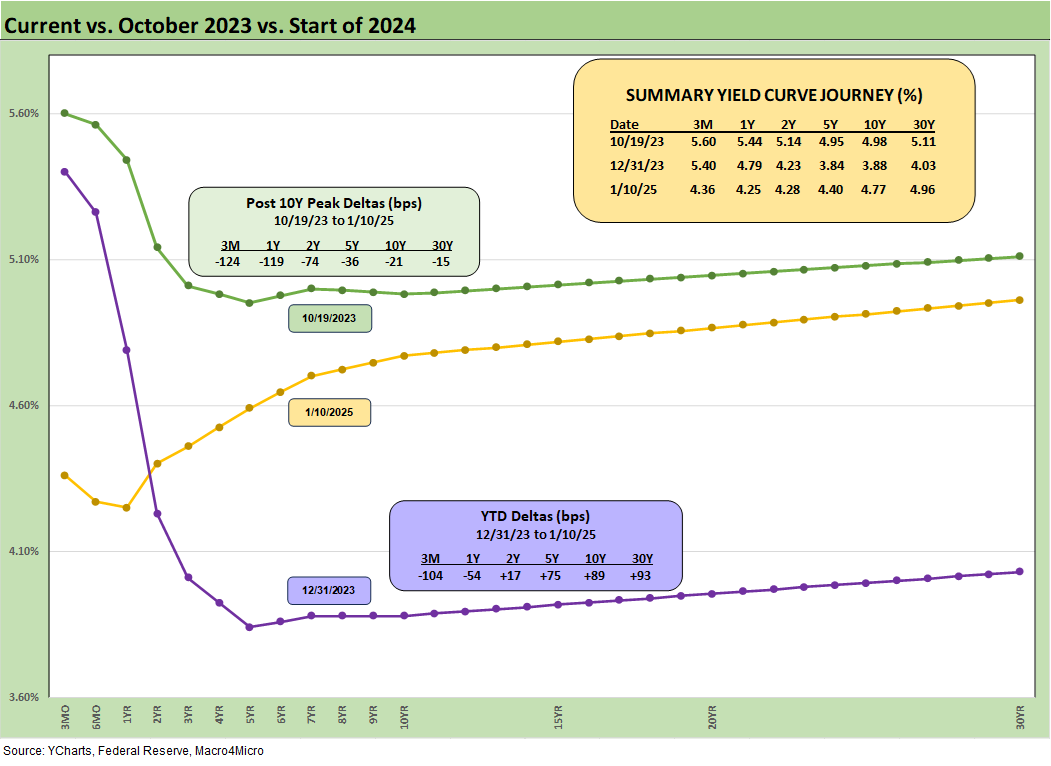
The above chart updates the UST deltas from the 10-19-23 peak on the 10Y UST and from the end of 2023 after the massive UST rally of Nov-Dec 2023. We plot the UST visuals and the delta numbers in the boxes. We see the material bear steepener by the end of 2024 into 2025 that hit the markets from a few angles and punished duration.
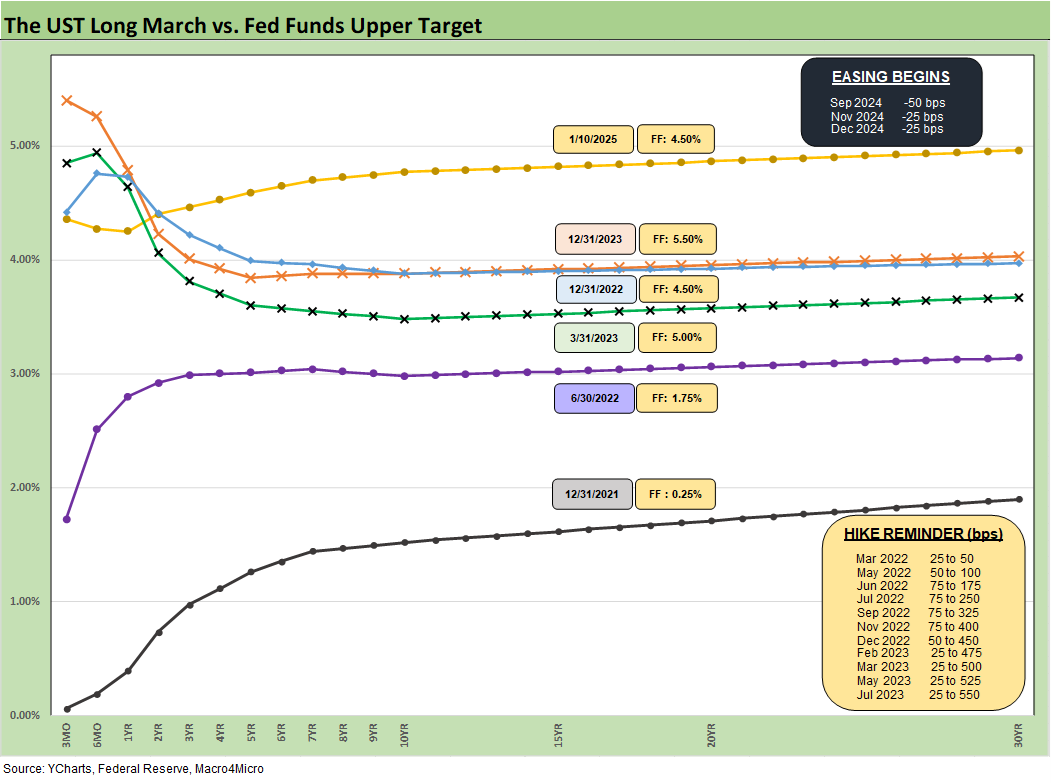
The above chart updates the migration of the UST and related visuals from the end of 2021 through current times. We use the year end UST curves but also include the June 2022 UST curve when inflation peaked. We include a “memory box” on tightening and easing dates.
We show the UST curve rally at the end of March 2023 when the regional bank mini-crisis sent a mild shock into the market and brought a “confidence bailout” by the Fed to ease the risk of a more troubling deposit run. We will see how much Q&A comes up this quarter around unrealized UST losses again for those looking to trash talk some regionals (or BofA).
The interesting side story we have been running across the past year was how the 12-31-22 and 12-31-23 UST curves converged in the 10Y UST despite fed funds posting a 100 bps differential between those two dates. We saw/heard our share of market commentaries from market watchers (usually equity focused) that touted the idea that the 10Y UST and mortgages would necessarily follow fed funds. That theory was blown out of the water as fed funds rose by 100 bps and the 10Y UST stayed close for 12-31-23 vs. 12-31-22.
We were hearing some of the same ideas in 2024 on the long end that the 10Y UST and mortgages would follow the short end lower. That clearly also has been erased with the same 100 bps differential in fed funds we saw in 2022 vs. 2023 being evident on 12-31-24 vs. 12-31-23. The market controls the long end, and the UST has moved materially higher and since the Sept lows.
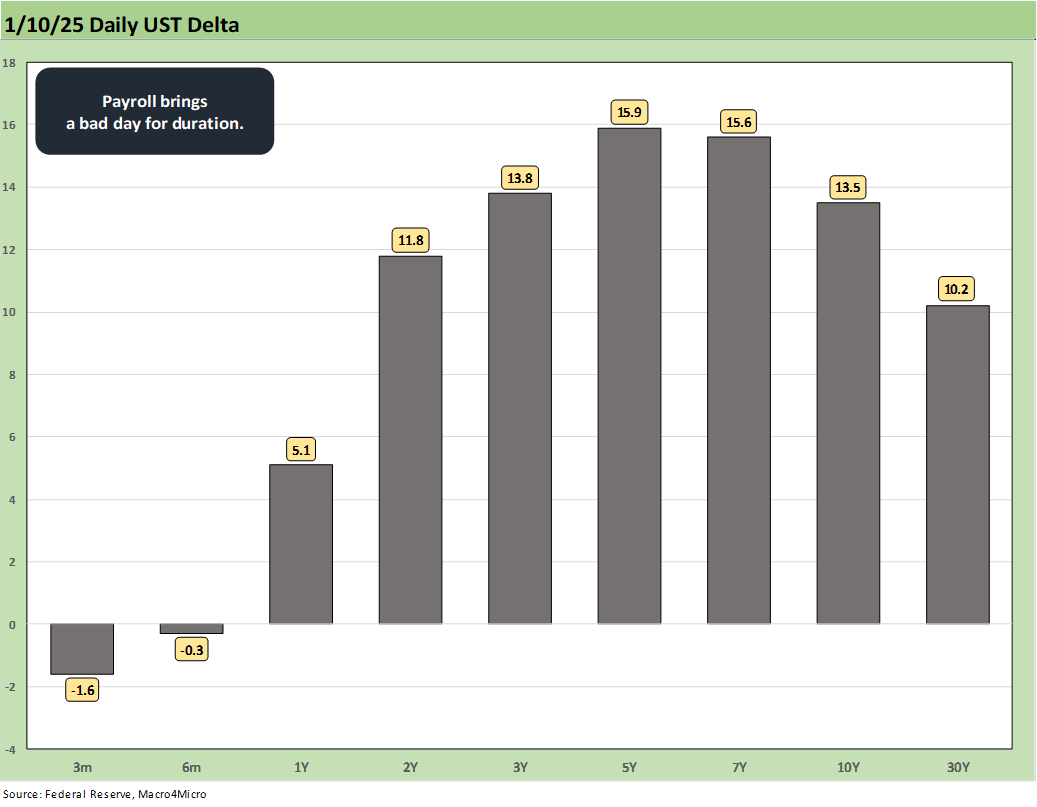
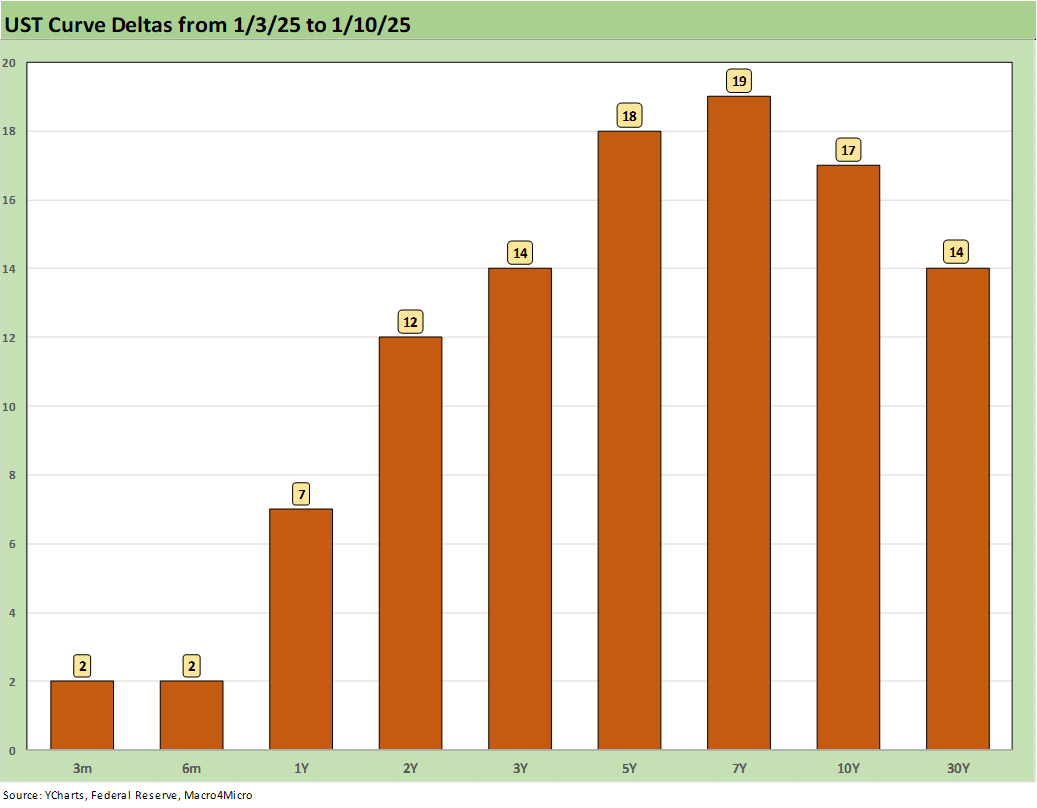
The above chart breaks out the 1-day UST delta move seen on Friday as a surprisingly strong payroll rattled the markets (see Payroll Dec 2024: Back to Good is Bad? 1-10-25). Friday’s market reaction hearkens back to the beating after the Dec FOMC meeting, projections, and dot plot details as the target fed funds median was moved higher for 2025 (see Fed Day: Now That’s a Knife 12-18-24). That may now be happening again but there will be a slew of data between now and the next dot plot. That includes details and market reactions on whatever Trump wants to blitz on Day 1.
The above UST delta chart shows the 1-week move. We cover the asset return fallout in our weekly asset return publication (see Footnotes & Flashbacks: Asset Returns 1-12-25).
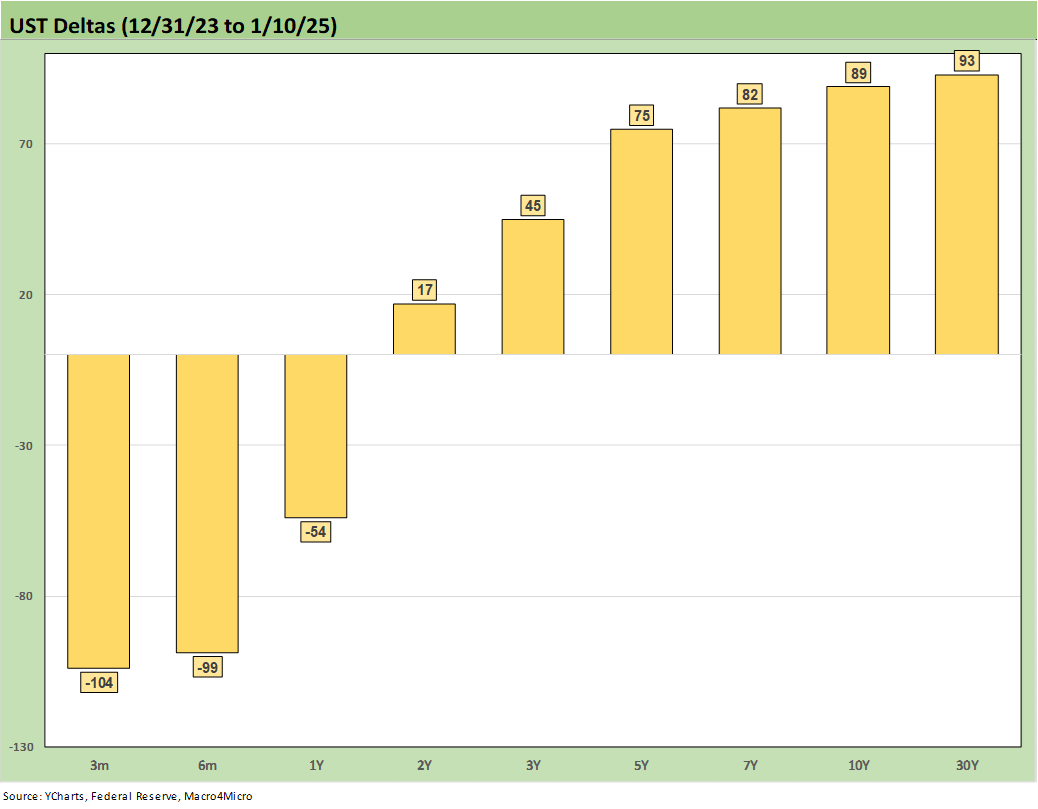
The above chart updates the UST delta visuals from the end of 2023 through this past Friday. We see rates lower from 3M to 1Y and materially higher beyond 2Y UST. That adds up to a bear steepener and duration paid the price as detailed across the time horizon asset returns. Cheaper short-term funding for banks helps margins and one worry now is that might stall for the banks. The good news for the banks is the much lighter regulatory burden expected. The market is still making up its mind in bank equities on regulation vs. rates with asset quality the tie breaker.
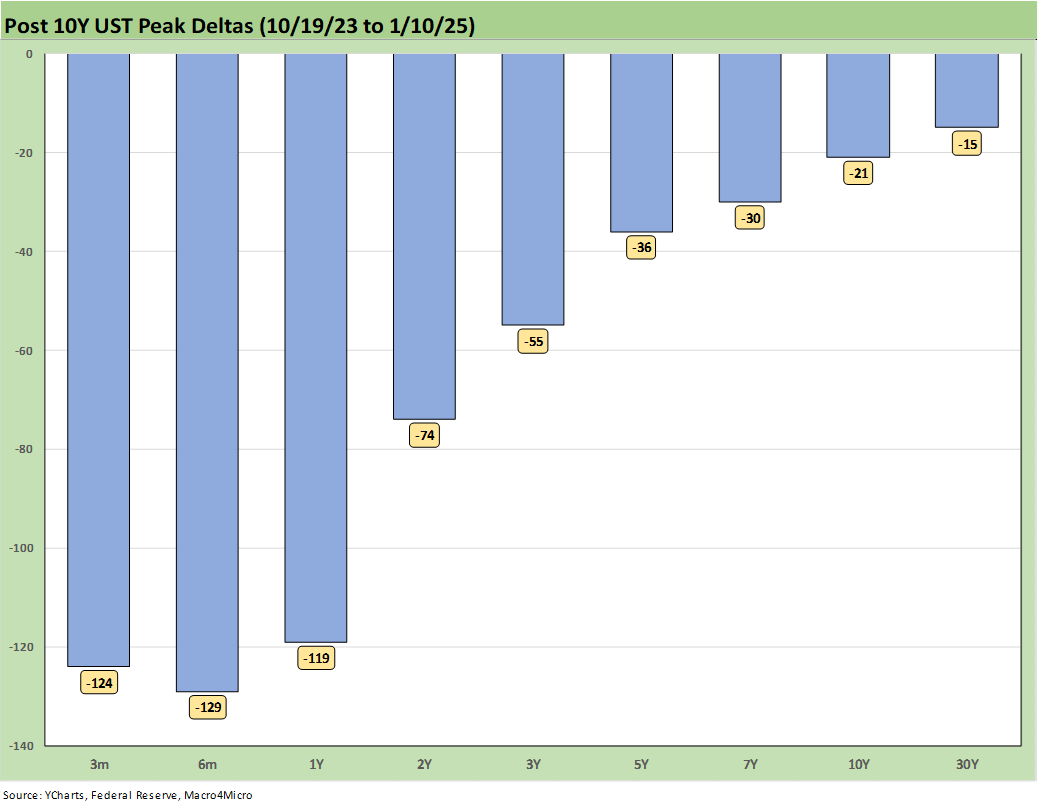
The run rates on the UST delays from the UST peak that we track each week are now showing the longer maturity deltas getting seriously dialed back as the UST curve retraces on the long end. That comes after the 10Y UST hit 3.6% in later Sept after the easing and now is back out closer to 4.8%.
Record deficits will only soar from here. Meanwhile, record interest expense continues to run higher and then even more massive increases in the borrowing needs ahead make for a challenging math equation. This would probably be a good time to be nice to the holders of UST bonds outside the US borders that add up to trillions. Starting trade wars is not going to help offshore demand from the two largest offshore holders, Japan and China.
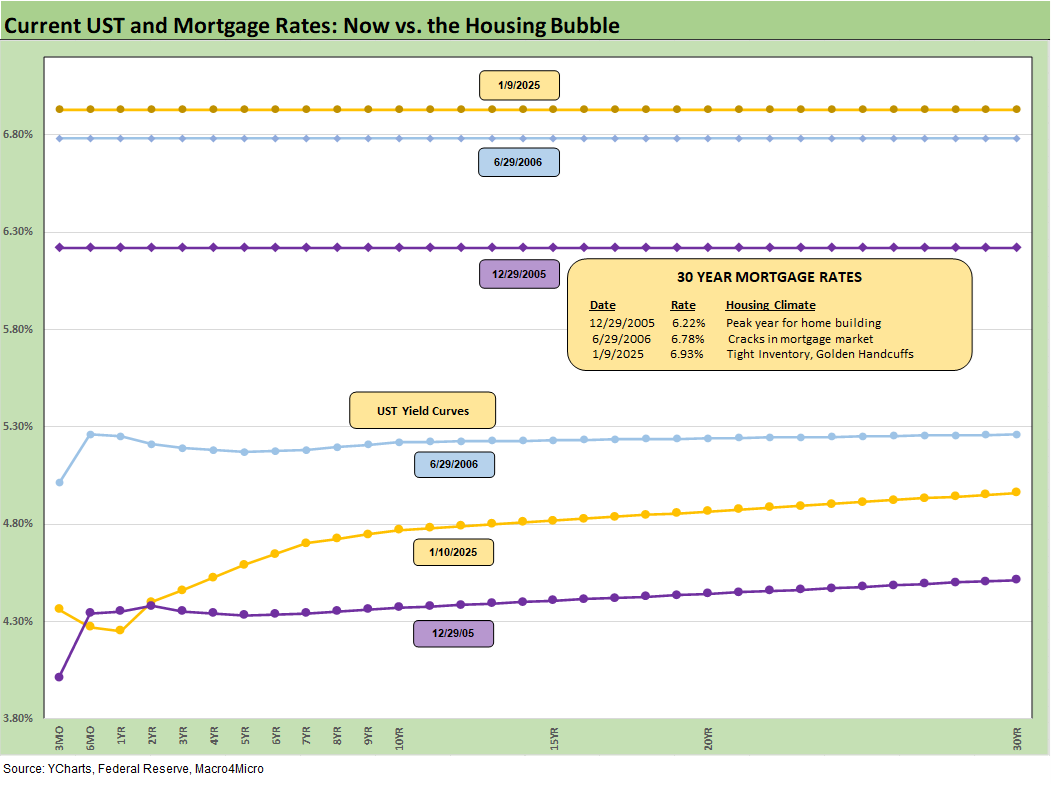
The weekly mortgage posts above show the Freddie Mac 30Y benchmark as of this past Thursday (it is set each Thursday at noon). The horizontal lines also show two important historical dates at year end 2005 for the peak homebuilding year and for mid-2006 as RMBS quality was coming under a dark cloud. We also post the UST curves for each date.
The 6.93% Freddie rate set on Thursday does not reflect the Friday yield climb after the payroll report. That could easily crack 7% this coming week subject to the CPI data and a range of other releases this week. The Mortgage News Daily survey (with its different profile of 30Y mortgages) moved north of 7.2% for Friday close.
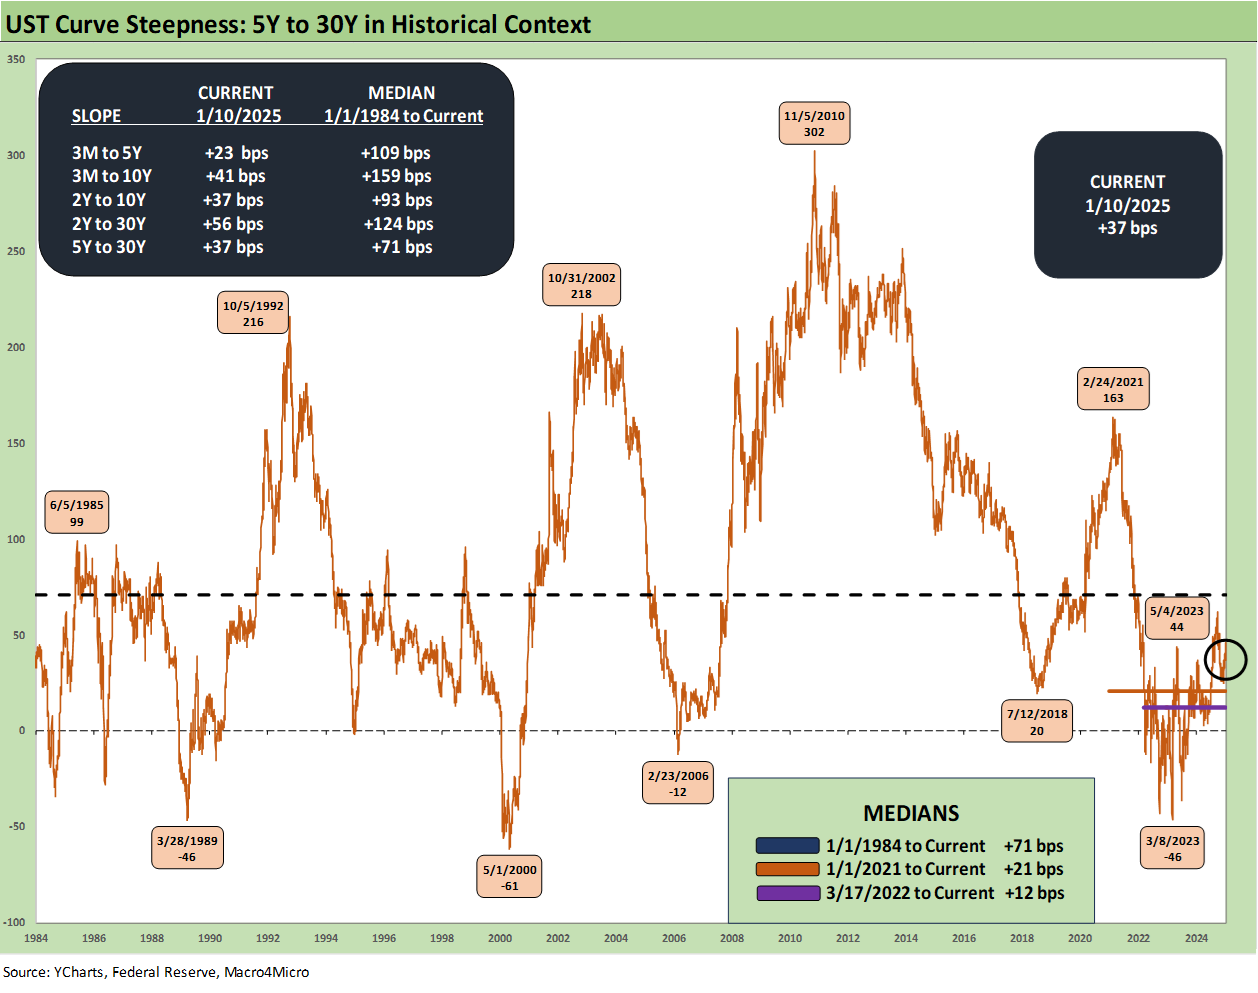
We update the 5Y to 30Y slope in the above chart from 1984. The current slope of +37 bps is still well inside the +71 bps long-term median but also a long way from the +163 bps back in the ZIRP days of late Feb 2021. The peak inversion was in March 2023 at -46 bps. Positive term premiums are worth something but just not in the area of what “normal” times would offer.
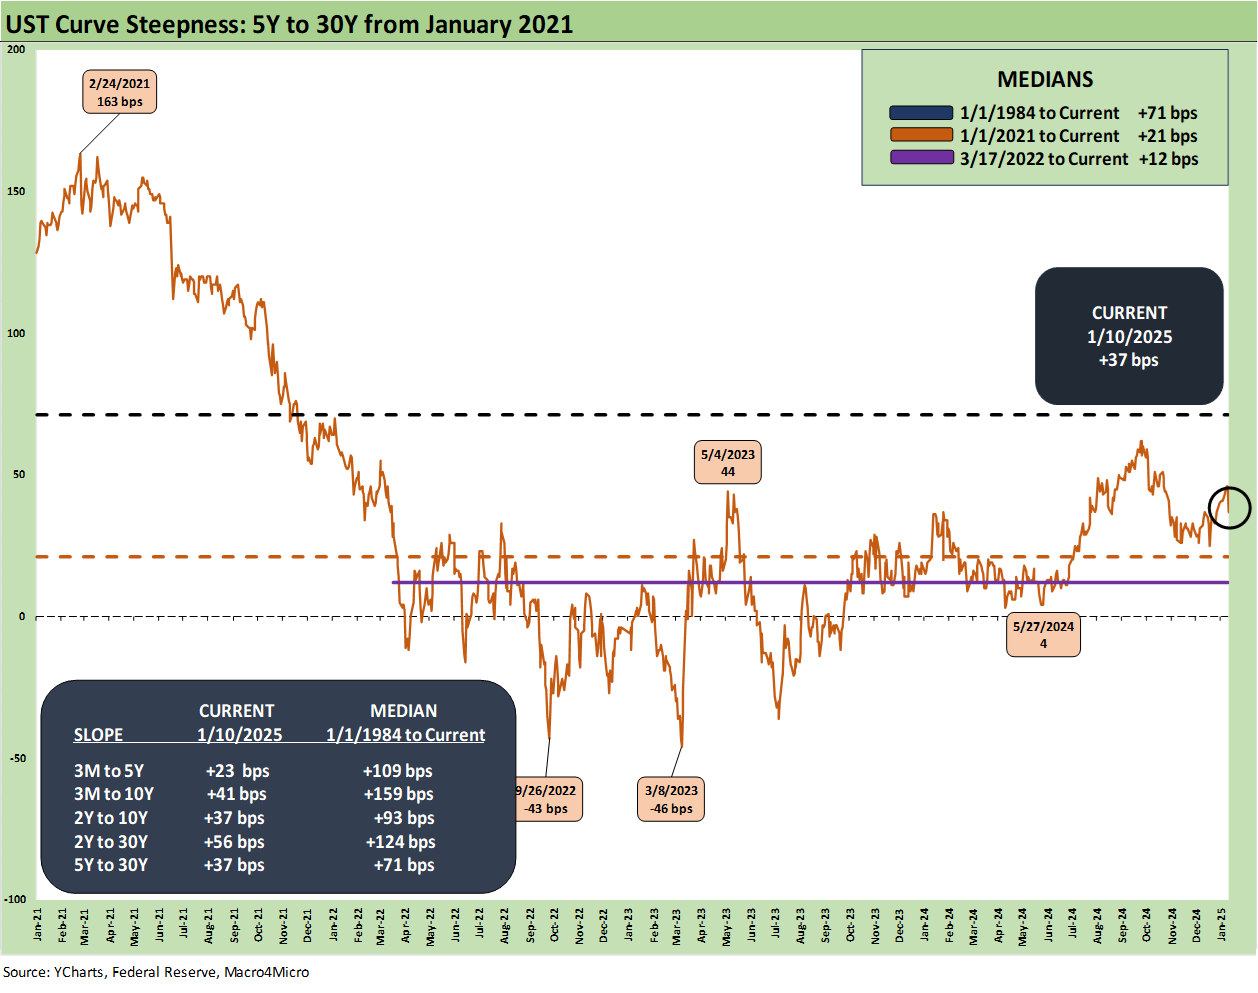
The above chart shortens up the timeline from early 2021 for a more granular view of the ride across the tightening cycle. We include other segment slopes we track in the box above with the post-1984 medians.
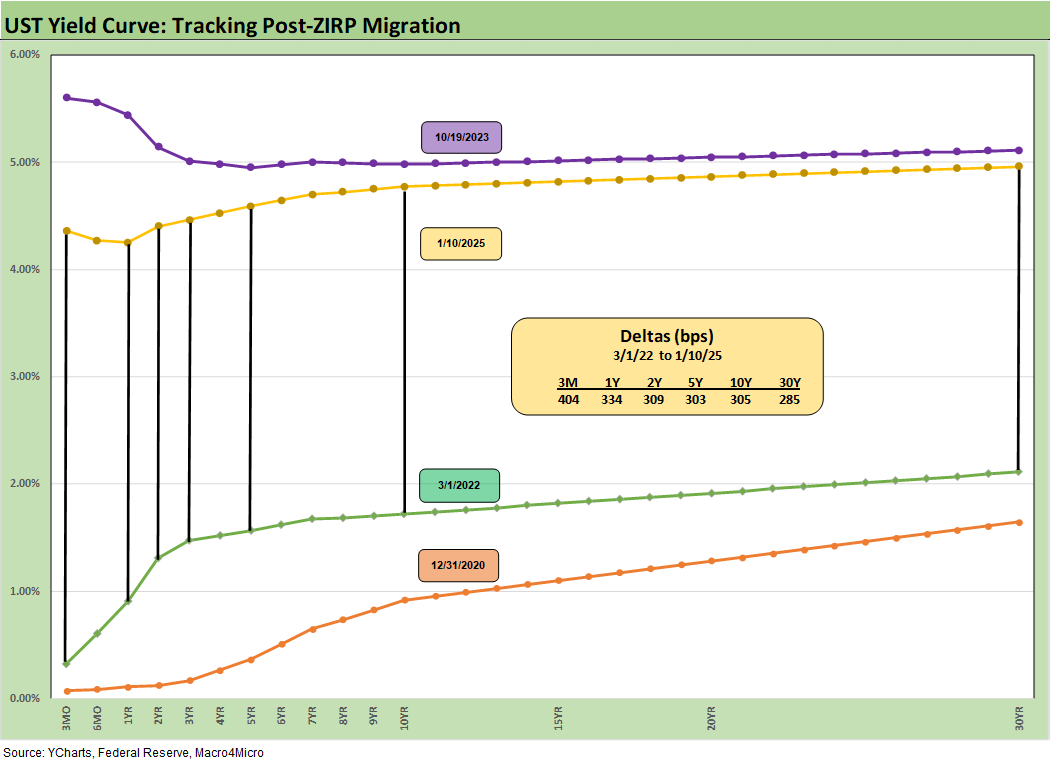
We wrap with the running UST deltas from March 1, 2022, which was the month ZIRP ended (effective 3-17-22). We include as frames of reference the 12-31-20 UST curve and the 10-19-23 UST curve for the post-crisis peak UST 10Y date. The longer maturities of the UST curve are now much closer to the peak than the March 2022 date.
See also:
Footnotes & Flashbacks: Asset Returns 1-12-25
Mini Market Lookback: Sloppy Start 1-11-25
Payroll Dec 2024: Back to Good is Bad? 1-10-25
US-Canada: Tariffs Now More than a Negotiating Tactic 1-9-25
Payroll % Additions: Carter vs. Trump vs. Biden…just for fun 1-8-25
JOLTS: A Strong Handoff 1-7-25
Annual GDP Growth: Jimmy Carter v. Trump v. Biden…just for fun 1-6-25
Footnotes & Flashbacks: State of Yields 1-5-25
Mini Market Lookback: Mixed Start, Deep Breaths 1-5-25
Footnotes & Flashbacks: Credit Markets 2024 1-3-25
Footnotes & Flashbacks: Asset Returns for 2024 1-2-25
HY and IG Returns since 1997 Final Score for 2024 1-2-25
Spread Walk 2024 Final Score 1-2-25
Footnotes & Flashbacks: Asset Returns for 2024 1-2-25
Credit Returns: 2024 Monthly Return Quilt Final Score 1-2-25
Annual and Monthly Asset Return Quilt 2024 Final Score 1-2-25
HY and IG Returns since 1997: Four Bubbles and Too Many Funerals 12-31-24
Footnotes & Flashbacks: State of Yields 12-29-24
Mini Market Lookback: Last American Hero? Who wins? 12-29-24
Spread Walk: Pace vs. Direction 12-28-24
Annual and Monthly Asset Return Quilt 12-27-24
Credit Returns: 2024 Monthly Return Quilt 12-26-24
New Home Sales: Thanksgiving Delivered, What About Christmas? 12-23-24
Mini Market Lookback: Wild Finish to the Trading Year 12-21-24
Trump Tariffs 2025: Hey EU, Guess What? 12-20-24
PCE, Income & Outlays Nov 2024: No Surprise, Little Relief 12-20-24
Existing Home Sales Nov 2024: Mortgage Vice Tightens Again 12-19-24
GDP 3Q24: Final Number at +3.1% 12-19-24
Fed Day: Now That’s a Knife 12-18-24
Credit Crib Note: Iron Mountain 12-18-24
Housing Starts Nov 2024: YoY Fade in Single Family, Solid Sequentially 12-18-24
Industrial Production: Nov 2024 Capacity Utilization 12-17-24
Retail Sales Nov24: Gift of No Surprises 12-17-24
Inflation: The Grocery Price Thing vs. Energy 12-16-24
Toll Brothers: Rich Get Richer 12-12-24
CPI Nov 2024: Steady, Not Helpful 12-11-24
Credit Crib Note: Herc Rentals (HRI) 12-6-24