
Footnotes & Flashbacks: Asset Returns 1-12-25
It is early in the game as the market gears up for Day 1, less talk, more walk, more specifics and maybe more facts.


They said we would get details soon on the actual plan…
The slow start in 2025 might be a case of “volatility in the midst of plenty” with the UST curve rebelling against the payroll numbers and more bear steepening spilling into equities (see Mini Market Lookback: Sloppy Start 1-11-25).
We have a big week ahead with CPI/PPI due this week along some key indicators such as Retail Sales, Industrial Production, and the start of big bank earnings.
The market can look back at the 2023-2024 asset return scoresheet as one for the ages coming after the 2022 tightening cycle pain, but handicapping 2025 with more confidence needs some big details to be filled in on tariff and trade policies, deportation scale and costs, and the first round of legislation whether in one part or two (see Footnotes & Flashbacks: Asset Returns for 2024 1-2-25).
The annexation rhetoric of the past week was in partly an oft-used distraction technique but also did not make the potential trade relations and tariff predictions easier in terms of trade partner retaliation (see US-Canada: Tariffs Now More than a Negotiating Tactic 1-9-25). The nomination derby also kicks off this week to inject some more political and policy toxicity into the market’s carotid.

The table above frames the time horizon returns for the high-level equity and debt benchmarks we like to track. We line them up in descending order of 1-year total returns. Those 1-year returns for the equity lines will take a while to wear off with 20% and 30% handles on various large cap and small cap lines.
Clearly the YTD and 1-month periods have been weak with equities negative across the board for those benchmarks. In bonds, only HY barely made it into positive territory YTD on shorter duration, higher coupons, and resilient spreads. Small caps are off to a very rough few weeks at -1.8% YTD and at -8.0% for 1-month.
The rolling 3-month period sees only HY slightly in positive range for debt. For the 3-month period in the mix above, equities only show decent numbers in Russell 3000 Growth and NASDAQ, but the S&P 500 return is minimal and the Russell 3000 Value and Dow back in the red.
The rolling return visual
In the next section, we get into the details of the 32 ETFs and benchmarks for a mix of the trailing periods. Below we offer a condensed 4-chart view for an easy visual on how the mix of positive vs. negative returns shape up. This is a useful exercise we do each week looking for signals across industry groups and asset classes. We also have a YTD version that we include in the broader commentary on the time horizons further below.

We see some decidedly negative balances in the mix above. For 1-week, we see 6 positive and 26 negative for a 6-26 score. The 1-month time horizon stands at 2-29-1 (2 positive, 29 negative, and one zero). We see a modestly negative balance for 3 months at 14-18. The 1-year timeline is still riding the 2024 wave at 31-1 with only the long duration UST 20+Y ETF (TLT) in the red at -7.5%.
We don’t include the YTD mix in the above chart but we break out a YTD return chart further below. The YTD weighs in at 5-27. The more recent late-2024 fade in Dec 2024 and Jan 2025 speaks to worries about valuation excess in equities, the UST curve action in debt and the underlying drivers from inflation to tariff risk.
The Magnificent 7 heavy ETFs…
Some of the benchmarks and industry ETFs we include have issuer concentration elements that leave them wagged by a few names. When looking across some of the bellwether industry and subsector ETFs in the rankings, it is good to keep in mind which narrow ETFs (vs. broad market benchmarks) get wagged more by the “Magnificent 7” including Consumer Discretionary (XLY) with Amazon and Tesla, Tech (XLK) with Microsoft, Apple, and NVIDIA, and Communications Services (XLC) with Alphabet and Meta.

We already looked at the tech bellwether trends in the Mini Lookback this week. The setbacks were wrapped around the spillover of UST fears with valuation in equities and the lofty multiples that could get challenged.
We see 9 lines in negative range for the 1-month horizon but only 2 lines negative for 3 months. For the trailing 1-month period, we see 5 of the Mag 7 in negative range with Alphabet positive and NVIDIA barely positive. For the 3 months in Mag 7, we see a wide range and divergence across the companies with 3 in double digits and TSLA off the charts.

We looked at the 1-week breakdown in the Mini Market Lookback: Sloppy Start (1-11-25). We see the curve impact on the right side of the chart in the bottom quartile. The Real Estate ETF (XLRE) sits on the bottom and the Regional Banks (KRE) and Small Caps (RUT) are in the bottom 3 with EM Equities (VWO) and the Tech ETF (XLK) in the bottom 5. Income stocks struggle when the curve shifts higher, so ETFs such as XLRE and Consumer Staples (XLP) are vulnerable.
EM Equities ETF (VWO) was in the red as UST rates can take a toll on EM exposure and notably when asset-liability mismatches can be a worry. Confusion around Trump 2.0 currency ambitions have been a feature of late in the “stronger vs. weaker” goals with the moving parts on what tariffs do to the dollar vs. what might be desired for exports. The inconsistencies are hard to reconcile. The potential for trade tension is also omnipresent as we head into 2025, and that does not help EM risk.
The past week saw some of the big winners after the election such as Financials (XLF), Regional Banks (KRE), and the Tech ETF (XLK) in the bottom quartile for a range of reasons but the UST curve is at the top of the list. We face a two-week wave of bank and consumer finance earnings starting this week.

The YTD numbers tell their own story at a 5-27 score on positive vs. negative. Energy took the top 3 slots on a rally in oil and colder weather driving natural gas. Midstream Energy (AMLP) has a high dividend rate and continues to show less volatility than E&P (XOP) and Energy (XLE).
All bond ETFs took a hit and interest rate sensitive lines are among the worst performers with the Real Estate ETF (XLRE) on the bottom. Homebuilders (XHB) remained in the doldrums at the upper end of the bottom quartile.
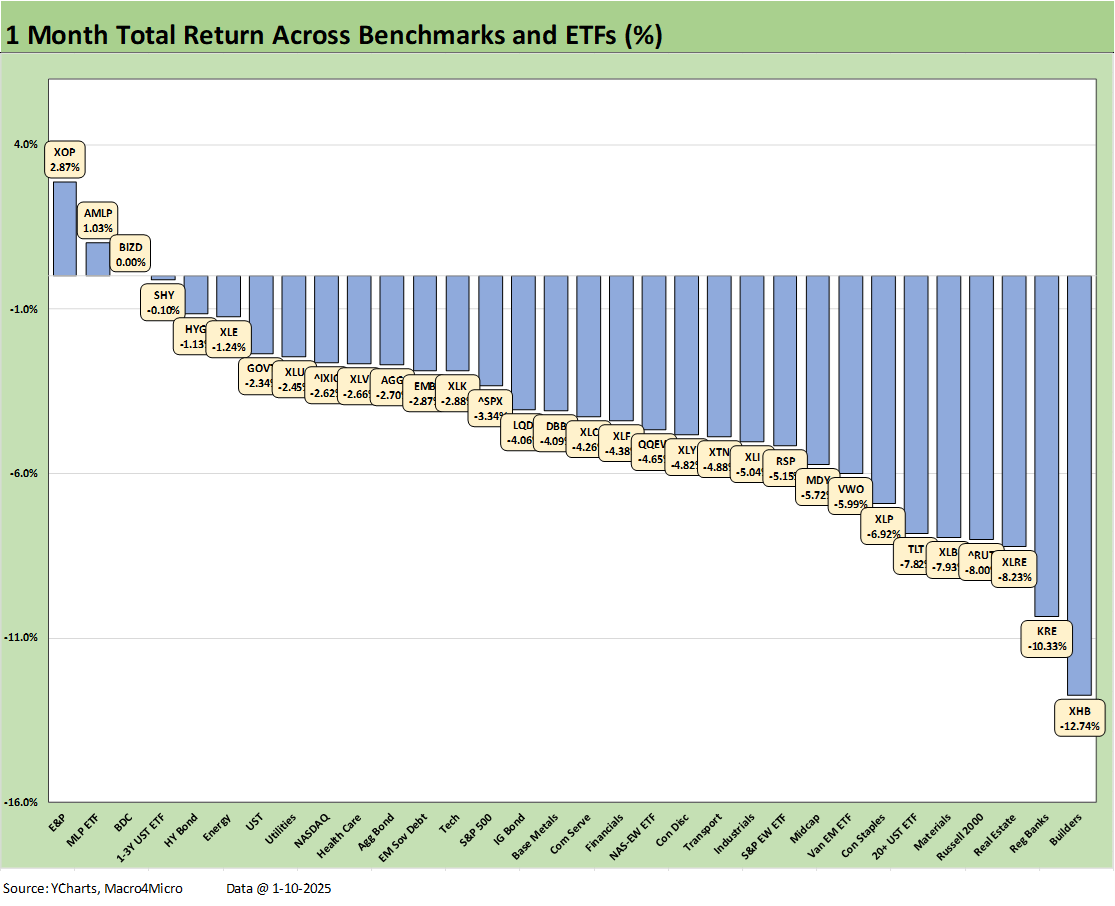
We addressed the 1-month horizon in the table at the top, but the breakdown across industry groups shows all industry ETFs negative except E&P (XOP) and Midstream Energy (AMLP). Oil and gas prices are the overriding variable for energy as those sectors are out of the crosshairs under the GOP. Volume is the key driver for AMLP even if there is some direct commodity risk in their earnings. The wildcard in energy is what Trump actually ends up doing with Canadian oil imports and any related supply and price fallout.
We see the BDC ETF (BIZD) flat on the month at 0%, and that asset bucket will be very interesting from here if the market sees a lower risk of adverse repricing on floating rate assets. The BDC risk profile could also see the credit cycle extended by respectable earnings growth trends and superior GDP growth such as the back-to-back 3% handle GDP quarter in 2Q24 and 3Q24 with the advance release on 4Q24 due later this month (see GDP 3Q24: Final Number at +3.1% 12-19-24).

For all the optimism around the Trump trade and bullish moves that came with a change in administration and a GOP sweep, the above chart tempers that view. The realities of record budget deficits, UST supply, the FOMC focus on managing inflation, and a range of speculative issues such as tariff actions and deportation effects don’t suddenly disappear on less regulation.
The 14-18 score over the trailing 3 months does not scream optimism since valuations in the equity and credit markets are extremely bullish already by just about any multicycle vantage point. That makes for challenging math for another year of banner returns. The valuations are often framed against periods that did not end well (TMT bubble of late 1990s, credit spreads similar to June 2007, etc.).
The chart shows all 7 bond ETFs in the red with the long duration UST ETF (TLT) in the bottom quartile at -8.2% for 3 months. We see the IG Corp ETF (LQD) at the bottom of the third quartile at -3.9%. The 3M UST at a bit over 4.3% also still offers a place to be patient and sort out the mess ahead on some of the policy uncertainty. The story around putting a lot more cash to work still applies, but it is not as urgent under some of the FOMC scenarios such as the high 2% to 3% handle cash rate themes that had been making the rounds.
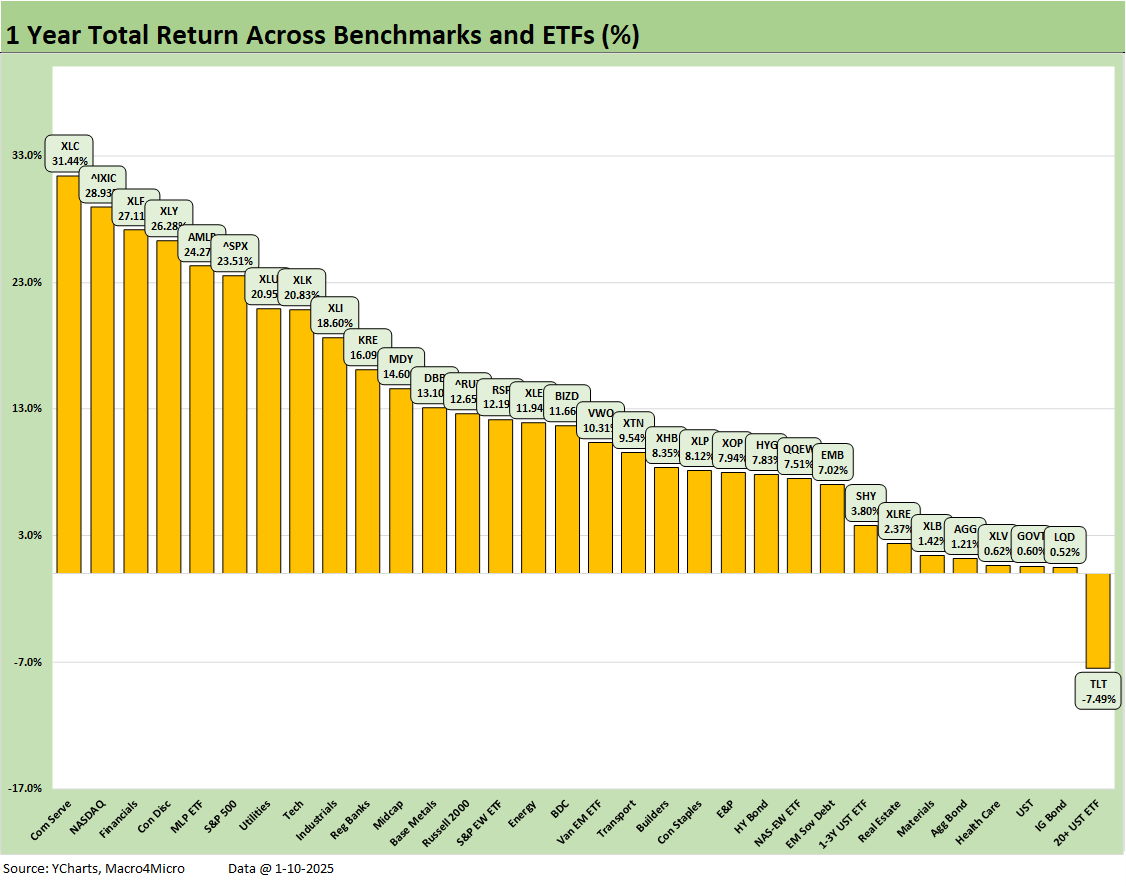
The 1-year time horizon will take time to whittle down as the weeks roll off with the 31-1 score still showing only the long duration UST 20+Y ETF (TLT) in the red. The bottom quartile saw 5 of 8 lines in the form of bond ETFs with HY (HYG) and EM Sovereigns (EMB) in the lower end of the third quartile.
The top tier had a heavy Mag 7 influence for 5 of 8 in the top quartile with Communications Services (XLC) at #1, NASDAQ at #2, Consumer Discretionary at #4 (TSLA influence), the S&P 500 at #6 (heavy Mag 7), and the Tech ETF (XLK) at #8. We highlight that the S&P 500 beat the Equal Weight S&P 500 (RSP) by over 11 points. The idea that blind buying of tech was a winner is belied by the Equal Weight NASDAQ 100 ETF (QQEW) near the bottom of the third quartile.
With Financials (XLF) a strong #3 on the trailing 1-year list, the coming bank earnings disclosure and earnings calls will be interesting for financial equities but more importantly for color on what the lenders are seeing in the trenches across consumers and corporate America from large cap to small cap. Any flavor on private credit disintermediation and how banks see their role in that market also would be interesting.
See also:
Mini Market Lookback: Sloppy Start 1-11-25
Payroll Dec 2024: Back to Good is Bad? 1-10-25
US-Canada: Tariffs Now More than a Negotiating Tactic 1-9-25
Payroll % Additions: Carter vs. Trump vs. Biden…just for fun 1-8-25
JOLTS: A Strong Handoff 1-7-25
Annual GDP Growth: Jimmy Carter v. Trump v. Biden…just for fun 1-6-25
Footnotes & Flashbacks: State of Yields 1-5-25
Mini Market Lookback: Mixed Start, Deep Breaths 1-5-25
Footnotes & Flashbacks: Credit Markets 2024 1-3-25
Footnotes & Flashbacks: Asset Returns for 2024 1-2-25
HY and IG Returns since 1997 Final Score for 2024 1-2-25
Spread Walk 2024 Final Score 1-2-25
Footnotes & Flashbacks: Asset Returns for 2024 1-2-25
Credit Returns: 2024 Monthly Return Quilt Final Score 1-2-25
Annual and Monthly Asset Return Quilt 2024 Final Score 1-2-25
HY and IG Returns since 1997: Four Bubbles and Too Many Funerals 12-31-24
Footnotes & Flashbacks: State of Yields 12-29-24
Mini Market Lookback: Last American Hero? Who wins? 12-29-24
Spread Walk: Pace vs. Direction 12-28-24
Annual and Monthly Asset Return Quilt 12-27-24
Credit Returns: 2024 Monthly Return Quilt 12-26-24
New Home Sales: Thanksgiving Delivered, What About Christmas? 12-23-24
Mini Market Lookback: Wild Finish to the Trading Year 12-21-24
Trump Tariffs 2025: Hey EU, Guess What? 12-20-24
PCE, Income & Outlays Nov 2024: No Surprise, Little Relief 12-20-24
Existing Home Sales Nov 2024: Mortgage Vice Tightens Again 12-19-24
GDP 3Q24: Final Number at +3.1% 12-19-24
Fed Day: Now That’s a Knife 12-18-24
Credit Crib Note: Iron Mountain 12-18-24
Housing Starts Nov 2024: YoY Fade in Single Family, Solid Sequentially 12-18-24
Industrial Production: Nov 2024 Capacity Utilization 12-17-24
Retail Sales Nov24: Gift of No Surprises 12-17-24
Inflation: The Grocery Price Thing vs. Energy 12-16-24
Toll Brothers: Rich Get Richer 12-12-24
CPI Nov 2024: Steady, Not Helpful 12-11-24
Mini Market Lookback: Decoupling at Bat, Entropy on Deck? 12-7-24
Credit Crib Note: Herc Rentals (HRI) 12-6-24