
Footnotes & Flashbacks: State of Yields 12-8-24
A rally week for UST was weighted more on the front end with a balanced payroll report ahead of CPI this week.


Supply-demand imbalances and inflation for a billion, Alex…
The question marks over policy impacts will go quiet into holiday season before a fresh start of the tariff and deportation countdown with the market supported (for now) by the tailwinds of lower rates and a still-helpful base of demand from the consumer sector.
This past week’s JOLTS number offered a boost for employment prospects but was somewhat tempered by the quality of the payroll adds mix (see Payroll Nov 2024: So Much for the Depression 12-6-24, JOLTS Oct 2024: Strong Starting Point for New Team in Job Openings 12-3-24).
This coming week we get the critical CPI and PPI updates with a busier following week of releases that includes the FOMC action and dot plot, the final read on 3Q24 GDP, and an accelerated release of PCE before Christmas among other high utility data points (retail sales, industrial production, various housing data).
A UST steepening from the front end is a safe bet, but the 10Y UST still generates a vigorous debate that gets swept up in some very diverging views on what tariffs and mass deportation will bring.

The above historical timeline of the UST curves drives home the theme that current UST rates are exceptionally low in the context of yields outside the distortions of the ZIRP and QE years. With the election over, maybe more credible Washington economists can say rates are low rather than what we heard from partisans insisting that US rates under Biden were like a bad year in Argentina. The above chart shows where the current UST curve sits across time.
Visually, the gradual UST move toward flatter could be a source of support for extending more cash out the UST curve as 2025 unfolds. The question will be around market confidence that a term premium might be in evidence that does not come with bearish scenarios around where long rates head with record deficits and very legitimate questions on radical departures in economic policy.
The desire to take duration risk and extend from a modestly inverted front end (we look at the 3M to 5Y UST slope in this week’s edition) implies you expect to get paid higher yields than cash equivalents in the UST market and have some upside in duration with a downward shift on the long end. Buying UST can be part of being defensive on credit risk at current valuations, but we also need to give consideration to what a highly unusual period this is across history.
On the topic of “Why cash?” and “Why not extend?” we have heard a few talking heads on financial media cable responding with their own questions such as the following:
“Why would I take duration risk for no term premium if I am bullish on the economy? Why would I do that if I am even a little worried about inflation and tariff and deportation effects and a soaring deficit that needs to be funded?”
It is certainly not a new debate over the past year, but the policy uncertainty is getting cleared away sooner rather than later in 2025. We are now in easing mode and Trump is in the seat.
The asset allocation schemes can run the gamut from just the standard and logical desire to diversify across cash, bonds, and equity, but the distinctive nature of this inflation and easing cycle raised flags. You also have newer product offerings to take credit risk and floating rate exposure in areas such as private credit.
For now, on the UST menu there is no term premium and taking duration risk requires a lot of confidence in your rate view and fundamental view. Being in cash at higher yields still gives you the opportunity to shift the entire allocation very quickly. We live in a push-button world.
If you are bullish on risk, you could have been overweight equities and HY and opted for high quality intermediate IG corporates. With HY and IG at very tight spreads, the plan could be to invest in intermediate (3Y – 5Y) IG corporates with decent mid-to-high 4% handle yields/coupons that are now converging with cash (3M UST, etc.). Another FOMC cut or two and you are getting some term premium plus some spread on intermediate IG. The world should get cleaner in terms of the moving parts soon.
If you want more coupon income, you can stay in HY or go with “HY lite” pick up yields while keeping duration risk lower. The duration risk part is still a very tough one with these new Sword-of-Damocles policy pronouncements. We will revisit these topics in other commentaries.
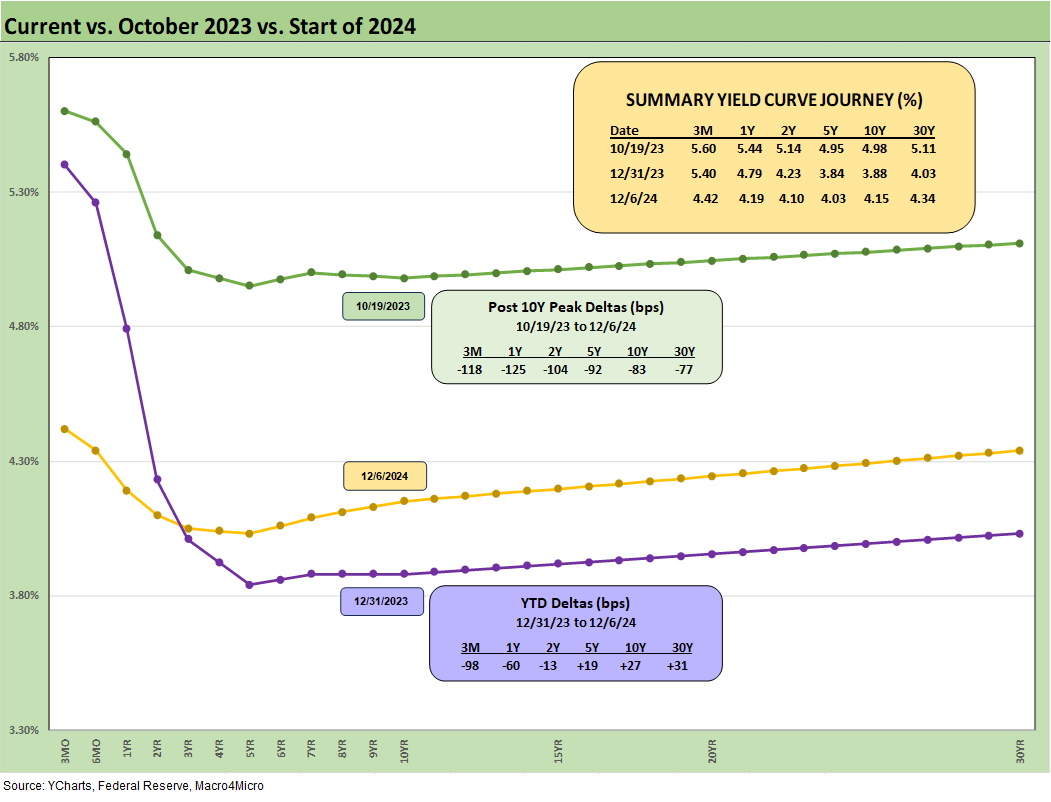
The above chart updates the running UST deltas YTD and since the peak date on the UST 10Y UST (10-19-23). We see the monster UST rally and duration winnings of the Nov-Dec 2023 months (see Footnotes & Flashbacks: State of Yields 1-1-24), Footnotes & Flashbacks: Asset Returns 1-1-24). We also see the adverse UST shifts beyond the 2Y UST in the YTD period with the front end 3M to 2Y UST running lower while under the influence of the Fed.

The above chart tracks some of the key UST shifts from the end of 2021 through this past Friday’s UST curve. We continue to watch the relationship of the fed fund moves higher in the tightening cycle and how that played out along the UST curve and notably to the 10Y UST that drives mortgage rates.
The fact that the 10Y UST area converged between 12-31-22 and 12-31-23 as the market tightened is sobering for those who see 10Y UST (and mortgages) moving lower with fed funds. The 2022 and 2023 year-end curves were 100 bps apart on fed funds, but the10Y UST gap between the two dates was tighter and essentially converged. The same 100 bps differential will soon be here in fed funds at year end 2024 vs. 2023 but as part of an easing cycle.
The idea that the 10Y at 12-31-24 will chase the 3.88% 10Y UST seen at 12-31-23 is very bullish if you are optimistic on the economy and worried about tariff fallout. The deficit and supply needs are also much different now and will only grow. If you believe in recession scenarios for 2025, that is a different set of variables.

The above bar chart frames the UST deltas for the week. The market’s view on what is coming from the Fed this month is fairly clear. The across-the-board decline this week supported UST returns and bond ETFs as we already covered (see Footnotes & Flashbacks: Asset Returns 12-8-24).

The above chart frames the YTD UST deltas with the 2Y UST now in decline mode but the 3Y to 30Y UST is still showing that part of the curve with a YTD bear steepener that has sent the long duration 20+Y UST ETF (TLT) into the red zone for the YTD period as detailed in our asset return Footnotes publication.

The above chart gives the full ride of the running UST curve rally since the 10-19-23 peak date. It is an impressive rally but has been running into headwinds in 2024 out the curve as the FOMC guides the front end lower. The UST curve now is at materially lower levels when looking back past the “ZIRP markets” and post credit crisis and post-COVID support periods. It is hard to make a case for a 3% handle 10Y with a term premium built in unless you see a recession ahead.

The above chart updates the Freddie Mac 30Y Benchmark Mortgage rate while framing the past week’s Freddie rate in the context of the 2005 peak homebuilding year and during the start of the RMBS quality anxiety later in 2006. We also include the UST curve for each of the dates. The Freddie Mac benchmark dipped below the June 2006 rate this past week although it is worth highlighting the 2006 UST curve was materially higher than the current UST curve.

For this week, we update the slopes of the 3M UST vs. the 5Y UST since 1984. The current inversion of -39 bps is well inside the long-term median of +109 bps, but the market has wrung a lot of the inversion out since the peak inversion of -197 bps in May 2023.
The ability to get a ride on the UST curve when extending into riskier credit assets such as IG and HY that offers less duration risk than long bonds has been hampered by the UST inversion and tight spreads. The compression of HY spreads has helped mitigate total return performance risk in HY during the tightening cycle.

The above chart shortens up the timeline from Jan 2021 for a look at the UST shifts across the period from ZIRP to peak tightening and now back into the easing cycle. The market is pricing in -25 bps for this month, but it is a wide-open debate for what comes next in 2025. The market will hunker down to see what tariffs and mass deportation will mean for the market as the days of reckoning draw closer and we will see what Trump will actually do.
At this point, there is little reason not to take him at his word on 25% tariffs on the two largest trading partner nations and that he will keep piling on tariffs on China. The EU will come up at some point. The potential for blanket tariffs across-the-board has died down somewhat. Pulling the plug on NAFTA/USMCA entirely is also on the choice list even ahead of the scheduled 2026 review that was built into the USMCA.
The fear of tariff-driven inflation and deportation fallout for wage rates will turn into a game of semantics (“tariffs aren’t inflation…they are just one-time price increases”) starts to get silly and a tad intellectually whorish on the part of economists to come up with a rationalization. Higher prices reduce purchasing power and hurt household budgets. Call it what you will. The currency issues will also come into play on purchasing power, but then there is the retaliation volume effect, etc. Domestic supply surpluses in ag commodities will not be inflationary but would be economically painful for farmers.
Tariffs will be every bit as complex as inflation with even more economists weighing in to obfuscate the obvious. I sat in classrooms during the stagflationary 1970s with Professors voicing very different views across the ranks on the topic. They are likely still arguing from the grave.
There is less of a factual dispute (outside the community of the deluded) on what a tariff is, which is a border tax paid by the buyer – not the seller. The economic effects of that border tax (or duty or fee or whatever you might call it) on the seller and buyer and how it filters downstream across the importer/buyers to the customer and then affects a limited household or corporate budget is the economic discussion. The fact of who pays the tariff is a fact. The rest is a debate and economic analysis. Try to get Trump or Navarro to state “buyer pays” in the media. Good luck.

We wrap with the UST deltas from March 1, 2022 to this past Friday’s rates. We frame the curve visuals with the UST curve from 12-31-20 on the bottom as the period when the COVID vaccines were just rolling into the markets and add the 10-19-23 UST curve when the 10Y UST peaked just under 5.0%. As a reminder, ZIRP ended in March 2022 (effective March 17) and we just had the first cut in Sept 2024.
See also:
Footnotes & Flashbacks: Asset Returns 12-8-24
Mini Market Lookback: Decoupling at Bat, Entropy on Deck? 12-7-24
Credit Crib Note: Herc Rentals (HRI) 12-6-24
Payroll Nov 2024: So Much for the Depression 12-6-24
Trade: Oct 2024 Flows, Tariff Countdown 12-5-24
JOLTS Oct 2024: Strong Starting Point for New Team in Job Openings 12-3-24
Footnotes & Flashbacks: Credit Markets 12-2-24
Footnotes & Flashbacks: State of Yields 12-1-24
Footnotes & Flashbacks: Asset Returns 12-1-24
Mini Market Lookback: Tariff Wishbones, Policy Turduckens 11-30-24
PCE Inflation Oct 2024: Personal Income & Outlays 11-27-24
3Q24 GDP Second Estimate: PCE Trim, GPDI Bump 11-27-24
New Home Sales Oct 2024: Weather Fates, Whither Rates 11-26-24
Mexico: Tariffs as the Economic Alamo 11-26-24
Tariff: Target Updates – Canada 11-26-24
Mini Market Lookback: Market Delinks from Appointment Chaos… For Now 11-23-24
Credit Crib Note: Ashtead Group 11-21-24
Existing Home Sales Oct 2024: Limited Broker Relief 11-21-24
Housing Starts Oct 2024: Economics Rule 11-19-24
Mini Market Lookback: Reality Checks 11-16-24
Industrial Production: Capacity Utilization Circling Lower 11-15-24
Retail Sales Oct 2024: Durable Consumers 11-15-24
Credit Crib Note: United Rentals (URI) 11-14-24
CPI Oct 2024: Calm Before the Confusion 11-13-24
Mini Market Lookback: Extrapolation Time? 11-9-24
The Inflation Explanation: The Easiest Answer 11-8-24
Fixed Investment in 3Q24: Into the Weeds 11-7-24
Morning After Lightning Round 11-6-24