
Footnotes & Flashback: Credit Markets 1-13-25
Despite all the pyrotechnics in equities and the UST last week, credit spreads provided a snoozer.


Someday this policy blitz is gonna end…
After a week of minimal credit spread movement, the market is hunkering down and waiting to “solve for X” on tariffs, trade, deportation scale, debt ceiling tradeoffs, the potential for a double dose of toxic on California aid (e.g. CA relief contingent on approval or removal of debt ceiling) among an extensive laundry list with pressing immediacy.
This week brings CPI/PPI, the start of the bigger earnings wave including big banks, and some high value econ releases (e.g. Retail Sales, Industrial Production, Housing Starts) as the UST market faces another testing point after a tough bear steepener week.
For valuation exercises, HY and IG remain priced in economic and risk appetite nirvana mode with little discount in the pricing framework for high levels of aggression in trade and geopolitics. HY is operating under the rule of “call me a week after we get there” while equities is more trigger happy at this point.
So far in 2025, the UST curve is driving the returns in fixed income and equities (see Footnotes & Flashbacks: State of Yields 1-12-25, Footnotes & Flashbacks: Asset Returns 1-12-25, Mini Market Lookback: Sloppy Start 1-11-25).
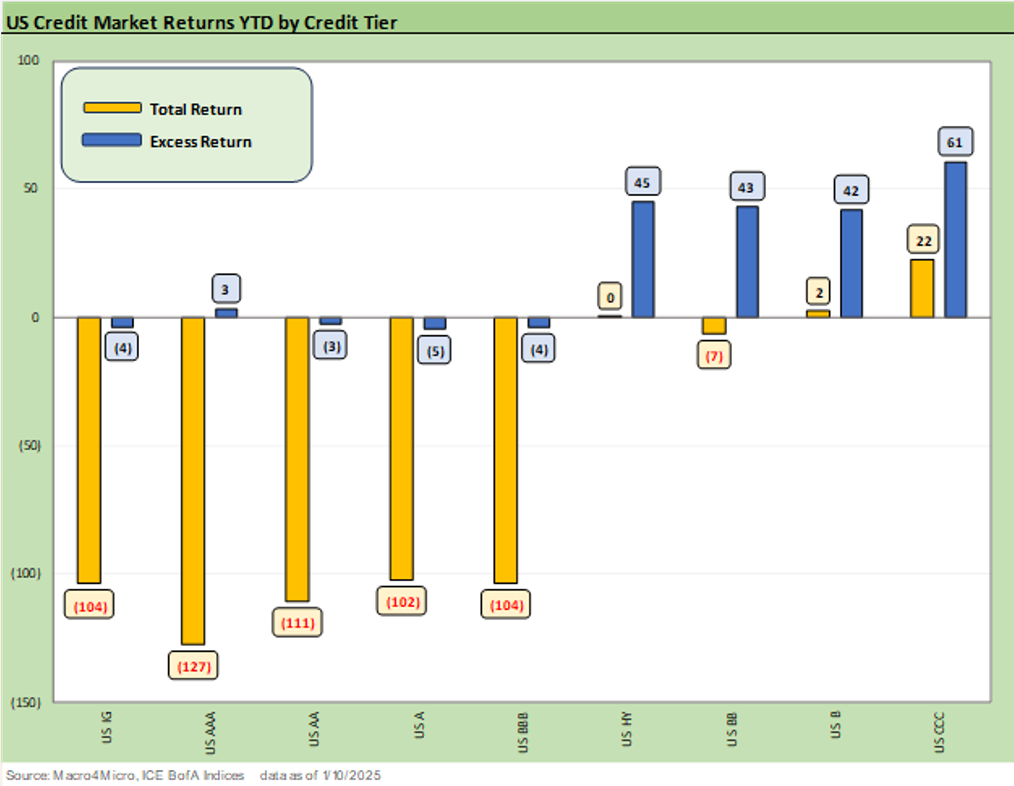
In this week’s return chart mix in credit, we restart the game clock and will leave some of the usual running excess return charts out of the publication until we get a little further into the year and see some reactions.
The above chart frames the total return and excess returns YTD for IG and HY and along the credit tiers. The UST pain to start the year is clearly flowing into the duration sensitive credit tiers. That means IG is off to a bad start in total returns after a year when returns were divided along the lines of duration and UST return components vs. credit returns (see Credit Returns: 2024 Monthly Return Quilt Final Score 1-2-25, HY and IG Returns since 1997 Final Score for 2024 1-2-25 ).
We have plenty of 2024 performance recaps and discussion of the risk variables in the links at the bottom of this commentary. The year 2025 will be a major challenge after two such strong years coming off the tightening year of 2022 and a rebound in equities not seen since the late 1990s boom.
For credit, history shows it is very hard to get a trifecta of 3 straight years of very favorable excess returns as 2023 stepped down into lower credit returns in 2024 and will face a big test given the current valuation starting point in spreads (see Credit Returns: 2024 Monthly Return Quilt 12-26-24).
A look at credit spreads…
In the charts that follow, we update where the market is essentially starting its year in credit risk premiums. It is not overly dramatic to say “life begins on Jan 20” when it comes to pricing credit risk in this market. When a new administration promises sweeping and essentially tectonic changes in economic policy (and personnel) the questions will naturally revolve around how much is grounded in sound economics and how much in ideology or pure politics.
Anyone who has been around for a while (measured in decades not years) has seen some great successes and some massive failures. Those who did not experience it firsthand but studied them along the journey will know that you don’t often see radical economic policy changes when the economy is doing well. Reagan was mired in the double-dip stagflation start to his administration, so that was one example. FDR in the Depression was another.
The problem in the current market is an abundance of “less-than-factual” views of how the economy is performing today. There was little debate on the state of the economy in 1980 or 1932. The radical moves under Nixon/Ford to deal with inflation after the Arab Oil Embargo in late 1973 saw radical measures that flopped. Waves of deregulation ensued as the 1970s wore on, and the necessary structural changes brought some ugly transition periods and industry restructuring that spilled into 1980-1982.
Polarization and lack of diverse perspectives do not help…
In those earlier periods, there was at the very least more diverse opinions in Congress across the Senate and House (even if more about political diversity across the white men from different regions). Washington displayed a lot more courage among individual leaders and without question more abundant ethics than what we see today. Whether it is the center left not standing up to progressives or everyone in the GOP lying prostrate at the feet of Trump, the dynamics of DC are less than ideal for sound policy making.
The constitution used to be the priority as opposed to weak-kneed allegiance to the powerful (example: Goldwater kicking Nixon in the ass on Watergate). We start 2025 with Washington a bit light on some of those traits.
This week’s start of nomination hearings in the Senate is likely to be less-than-inspiring. The nicest thing you can say is that resumes and experience are light for the demands of the jobs. The quality of advice in some areas will be more like echo chambers rather than insight. That includes critical topics such as tariffs and trade (consumer and producer inflation and supply chain costs), fiscal management (UST supply), defense (what programs are needed, the use of the military on US civilians), and annexation “ideas” (sending in Seal Team 6 to take out some rogue caribou and reindeer in Greenland). The mixed bag of risk factors will keep 2025 worrisome as well as morbidly entertaining.
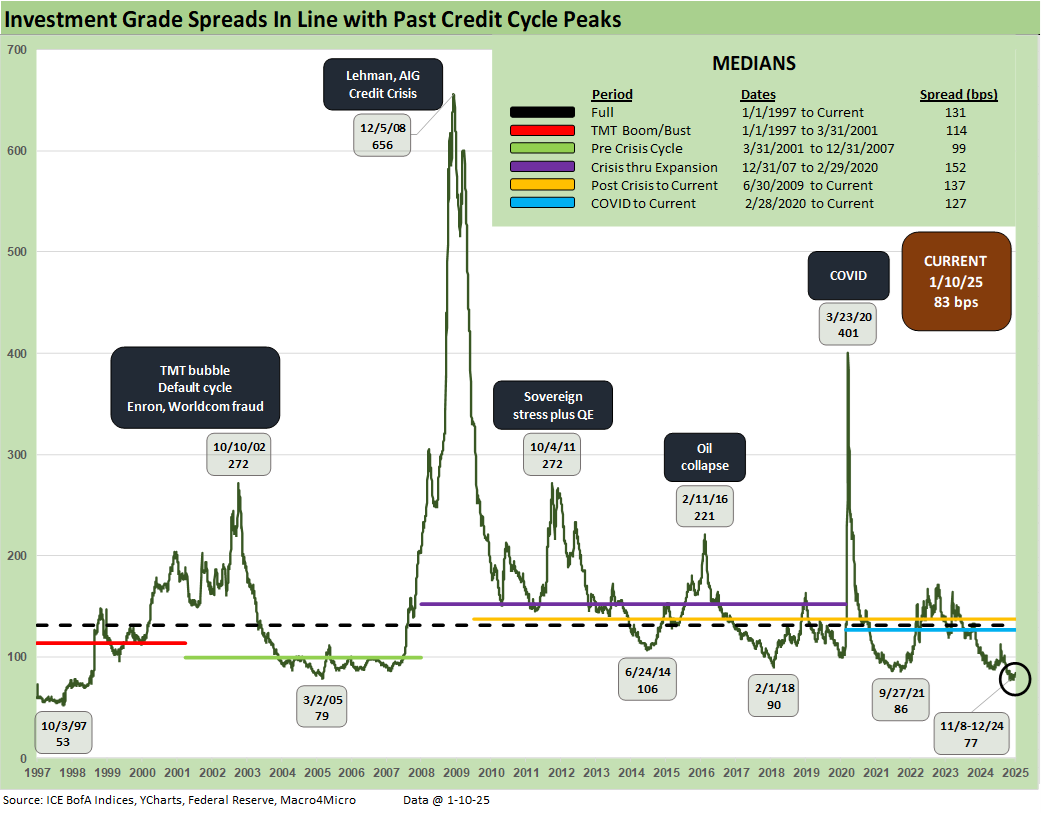
The above chart updates a flat week in IG spreads with double-digit IG spreads still reminiscent of prior credit cycle peaks.
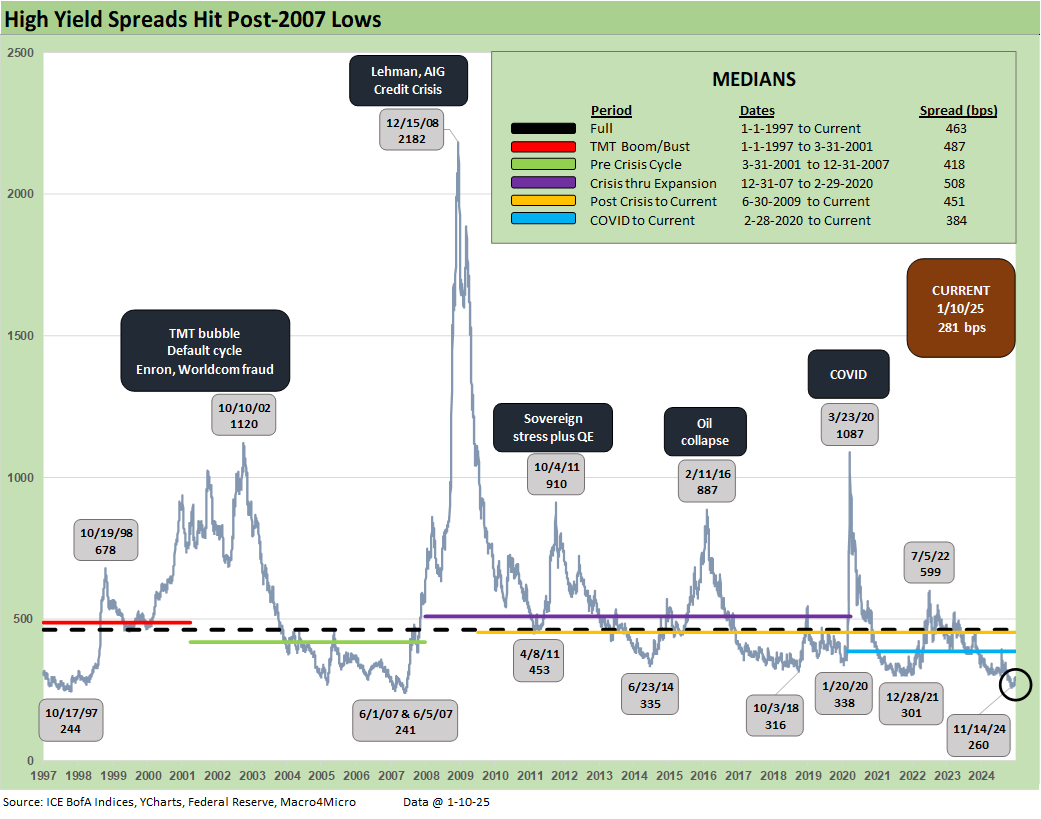
HY OAS was also flat on the week and still in the June 2007 and late 1997 zones of the rarefied air of the sub-300 bps area. That will make for a challenge for competitive HY excess returns in 2025.
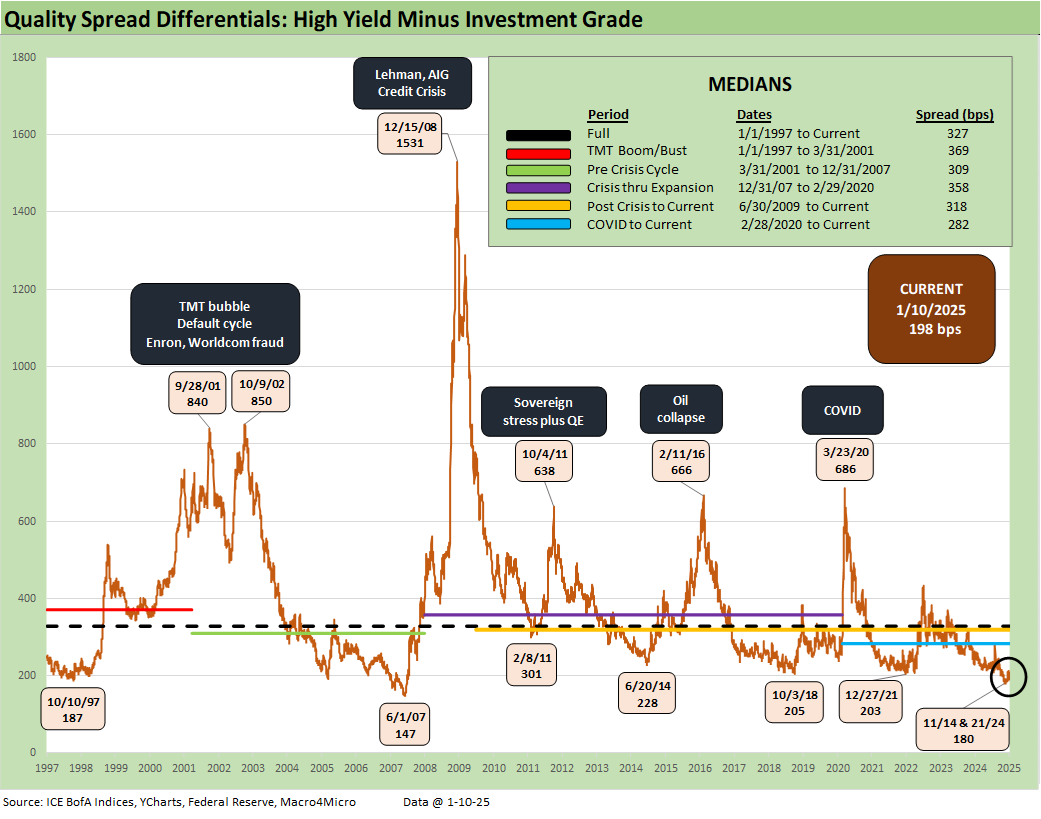
“HY OAS minus IG OAS” quality spread differentials also remain in a rare zone in the sub-200 bps range at +198 bps.
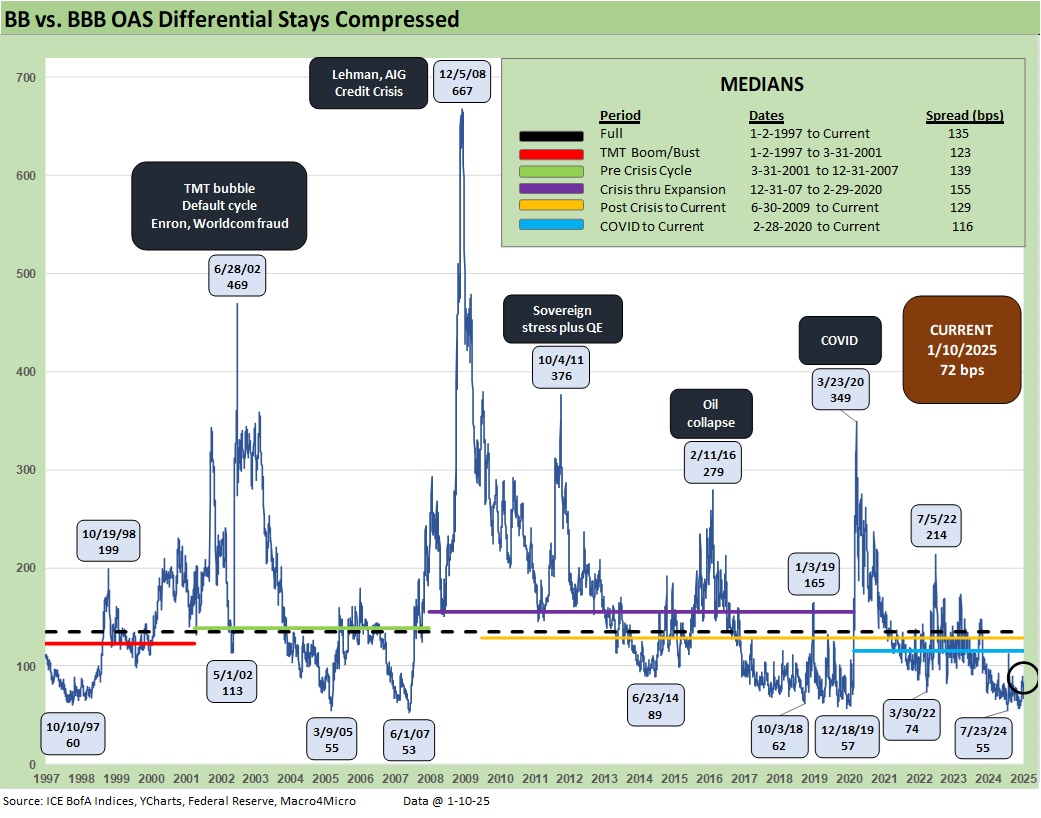
The “BB OAS minus BBB OAS” quality spread differential was slightly tighter this week at +72 bps. That is well inside the long-term median of +135 bps but has some healthier room above the recent +55 bps in July 2024. As we covered on the 2024 recap, the running excess returns on BBB vs. BB converged and differentials compressed on the year (see Footnotes & Flashbacks: Credit Markets 2024 1-3-25).
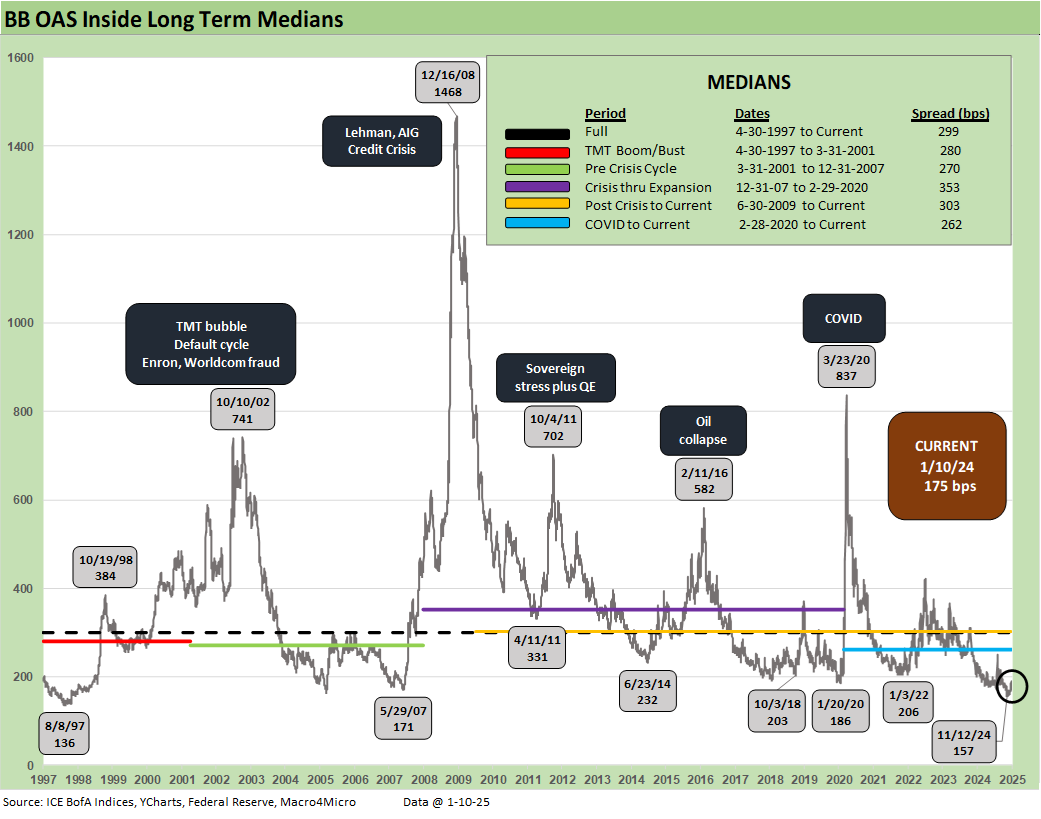
The BB tier OAS at +175 bps is around the 2007 lows but well above the more limited mix of names in 1997 before some headline BB tier stress drove the BB tier OAS to almost 3X the BB OAS lows by Oct 1998. Of course, that spread backdrop in late 1997 got much worse later in the cycle in the 2001-2002 freefall that brought names such as Enron and WorldCom.
A comparison to periods such as June 2014 and Oct 2018 is more logical, but those periods also were still caught up either in ZIRP (2014) or slow normalization (2018). The BB tier OAS moved below the +200 bps line in early 2020 also just ahead of the COVID period. In other words, with a higher UST curve in today’s market, the +175 (off the +157 bps of Nov 2024) is a very impressive compression. We are now in a semi-normal UST curve backdrop relative to pre-ZIRP years as we cover in our State of Yields publication.
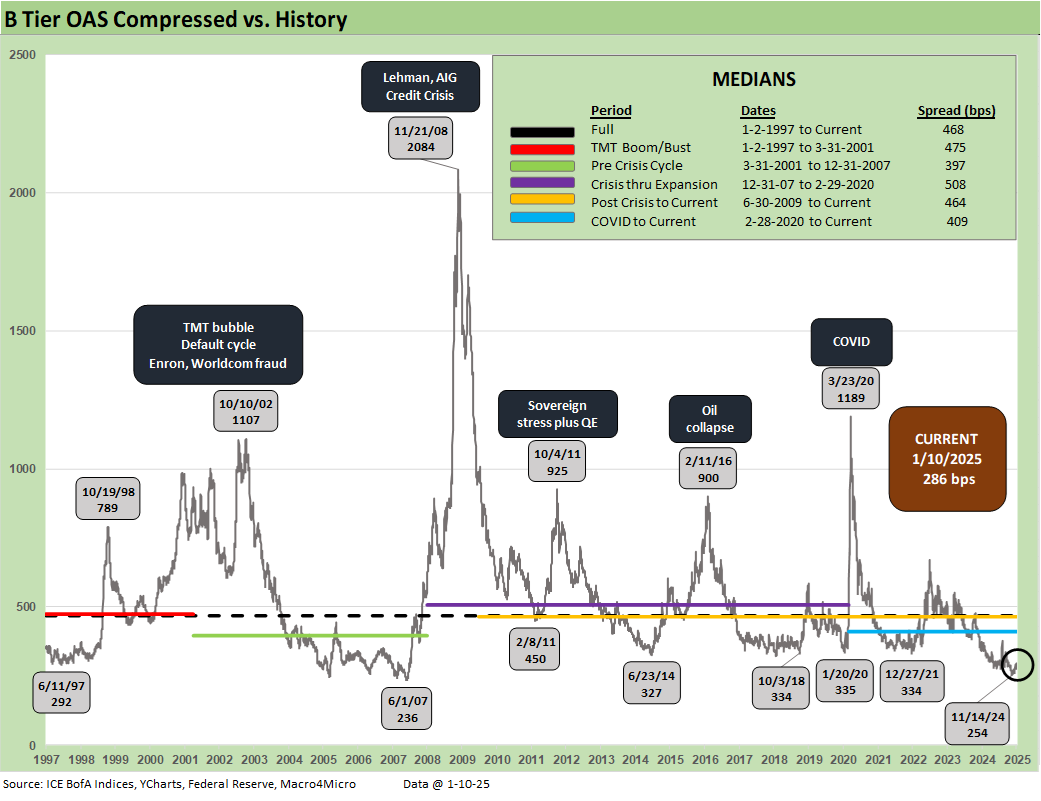
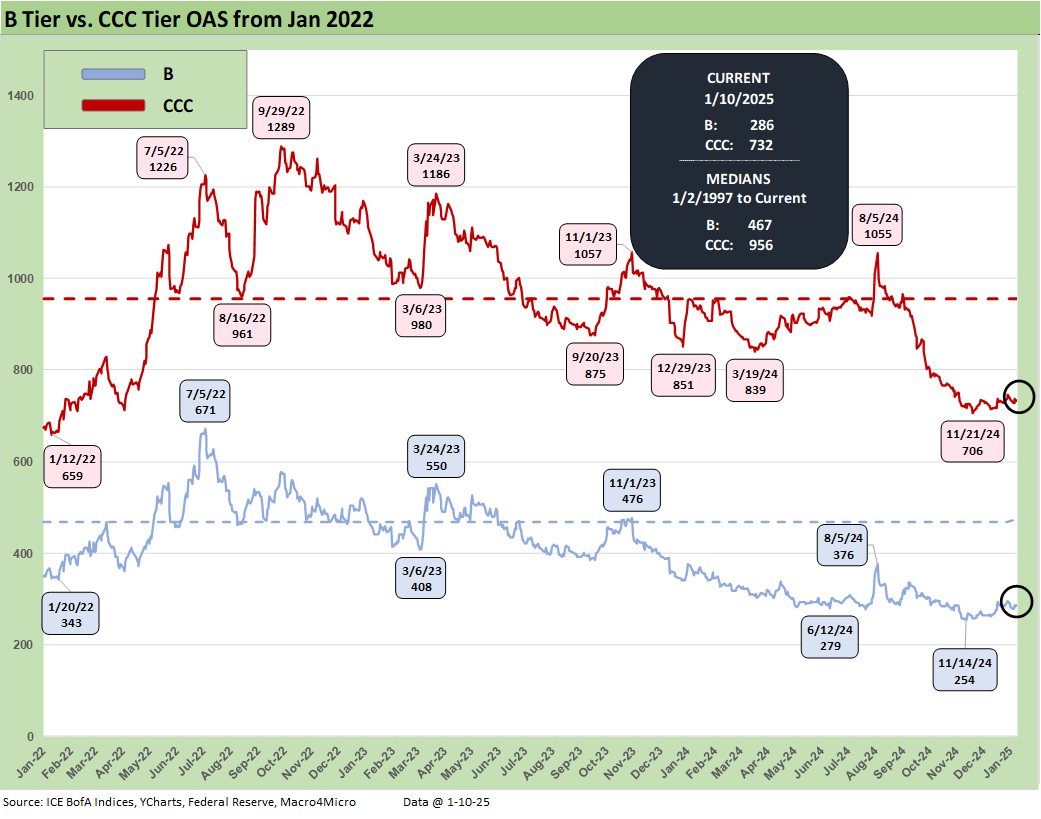
The B tier is still in the sub-300 zone that the HY market had not seen since June 2007 and 1997. The solid compression of 2024 was still well short of the ride tighter in 2023 after the 2022 Fed tightening cycle.
The B tier OAS compression in 2023 saw B tier OAS tighten by -174 bps before the B tier OAS tightened another -45 bps in 2024 to +296 bps. We looked at those histories in more detail in the 2024 recap pieces (see Spread Walk: Pace vs. Direction 12-28-24, Footnotes & Flashbacks: Credit Markets 2024 1-3-25).
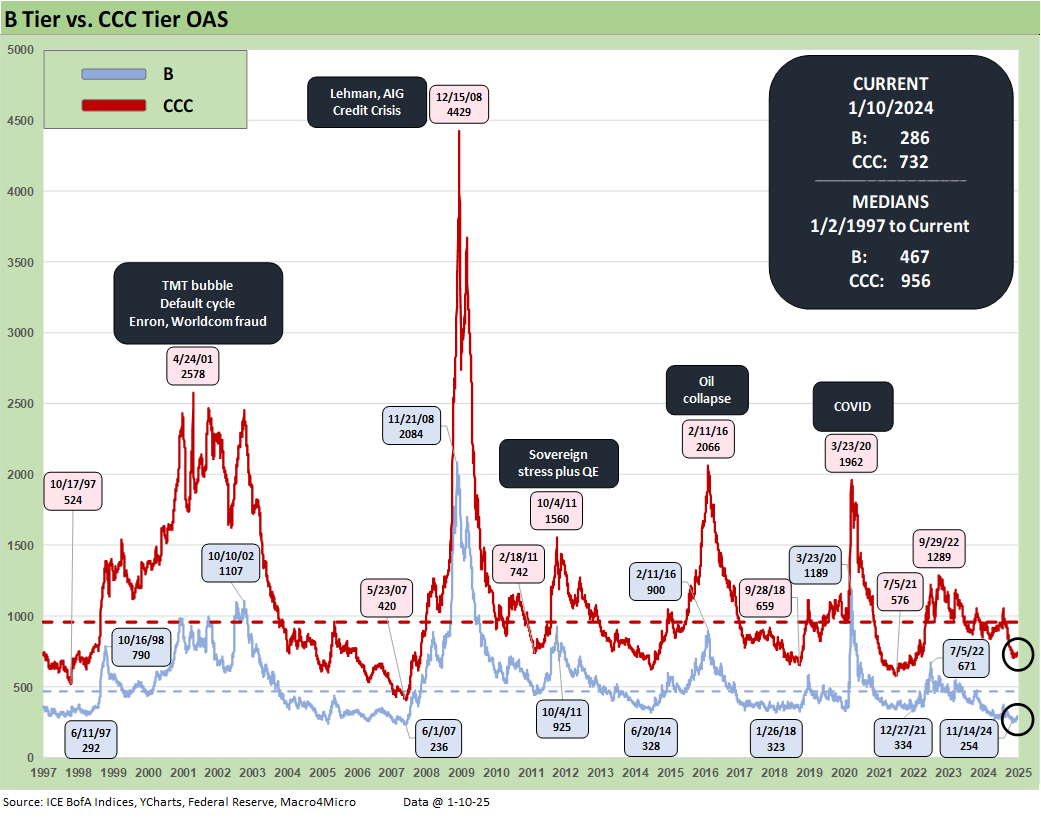
The above chart updates the historical path of B vs. CCC OAS to highlight the points of divergence along the timeline bouts of credit stress or market volatility. As we have discussed regularly along the way and in the recap series, the spread gap risk on the low end has been mitigated by the migration of the most aggressive deals over to private credit. That makes for fewer potential catalysts for waves of “falling knife” syndrome and redemption panics of the sort seen too often in past credit cycles or in markets such as early 2016 on HY bond overexposure to upstream energy.
The above chart shortens up the timelines to get a better visual in the more recent action in the B vs. CCC tier spread moves. Changes in constituent mix, drop-ins (downgrades) and dropouts (default, distressed exchanges) can move around the spread mix in the smallest HY tier.
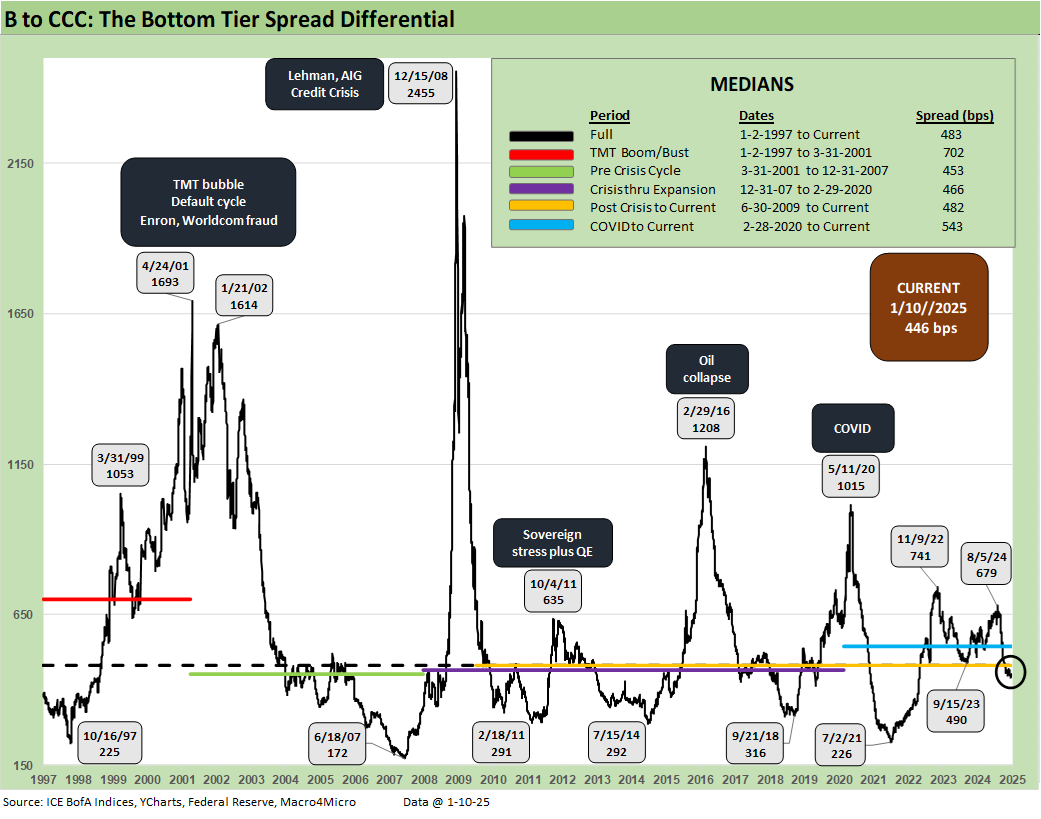
The above chart updates the long term “CCC OAS minus B OAS” quality spread differential. The current +446 bps is modestly inside the long-term median of +483 bps and in the zone of most of the shorter cyclical timeline medians noted in the box. The 1997 to 2001 median reflects the TMT era beatdown.
The 2001 to 2007 median of +453 bps offers a reminder to respect the credit cycle and deal quality across underwriting “behavior” since life did not work out so well after that Dec 2007 period. It would be easy to make the case that 2008 was not at its core HY quality as much as RMBS quality, structured credit excess, and counterparty exposure run wild to the point of a bank interconnectedness time bomb. That is when credit contraction sets in and the high-risk credits are heading for serious trouble. Credit contraction is not on the menu today with private credit booming and banks healthy, but credit risk repricing could be (arguably should be) on the 2025 menu.
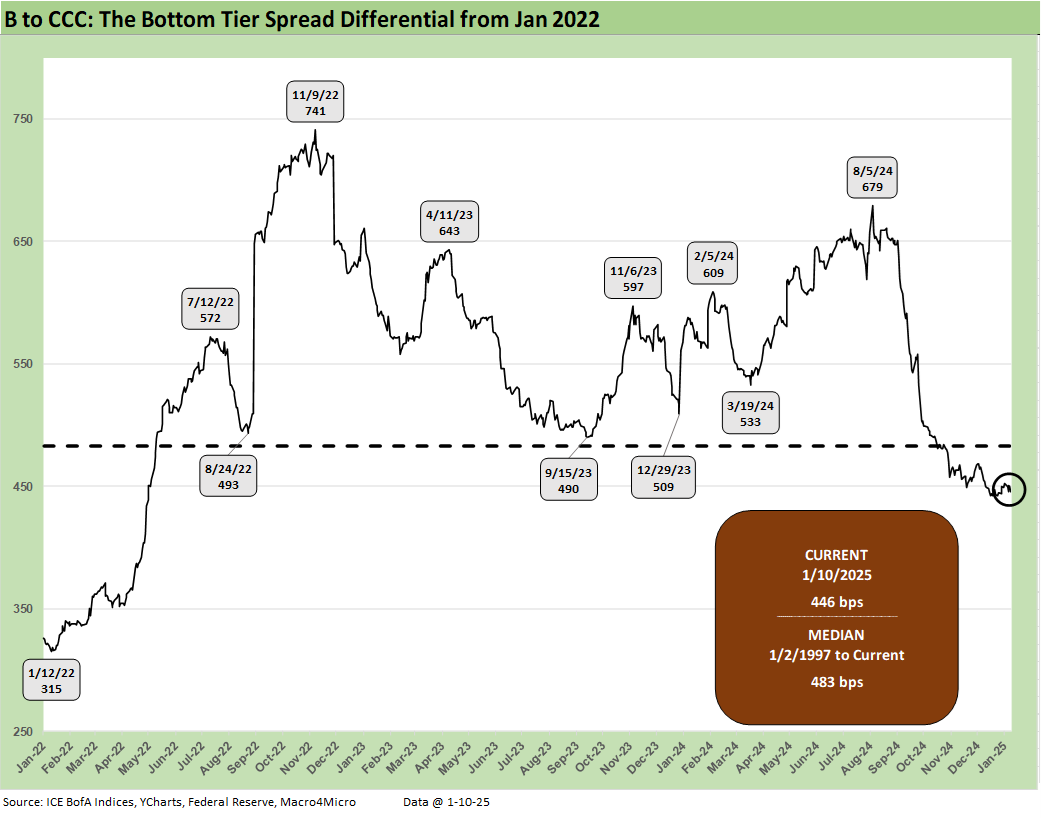
The above chart gives a shorter timeline on the B vs. CCC tier quality spreads across the tightening cycle and into Friday with the world now gauging the easing cycle.
A look at yields…
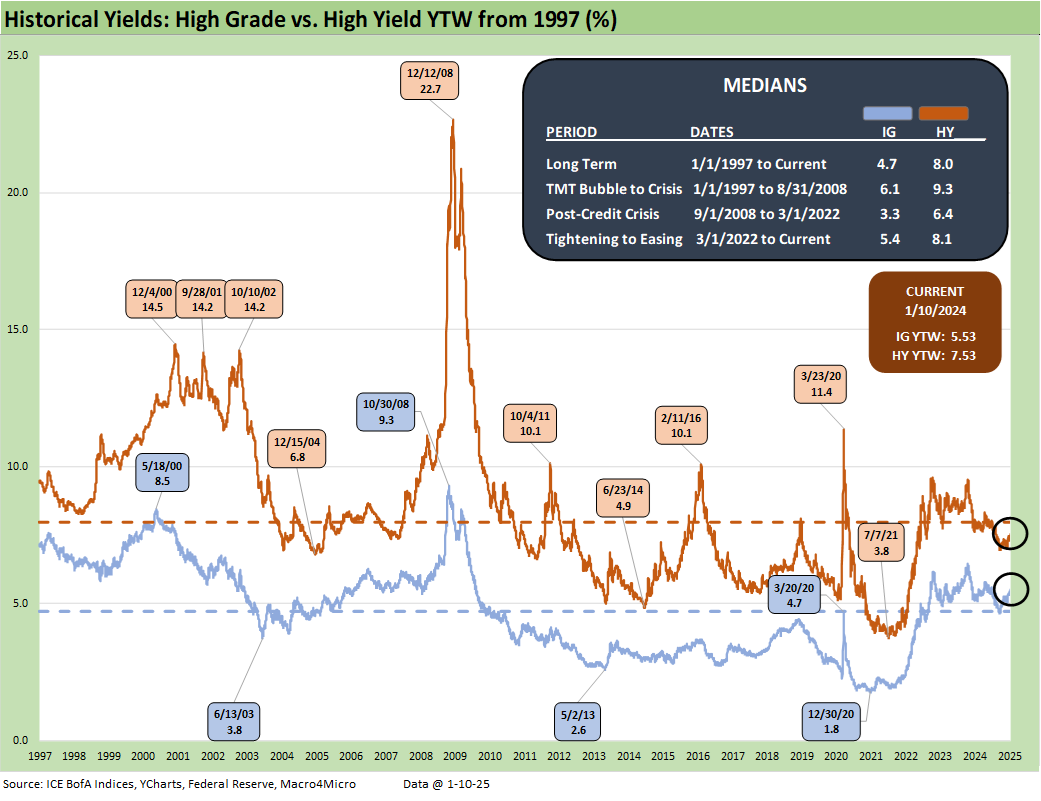
The above chart updates the timeline and medians across the cycles for the HY index yields vs. IG index yields. The medians most relevant to today’s pricing context is the pre-crisis, pre-ZIRP yields of 6.1% for IG and 9.3% for HY index yields.
Our views on these risk pricing comps and credit yield curve histories are unchanged from our earlier commentaries. We have been negative on longer duration and worried about bear steepening. The curve will remain the key driver of IG with HY now facing the challenge of uncertainty to fundamental fallout from high tariffs and trade stress as well as stubbornly high UST rates and contingent inflation threats.
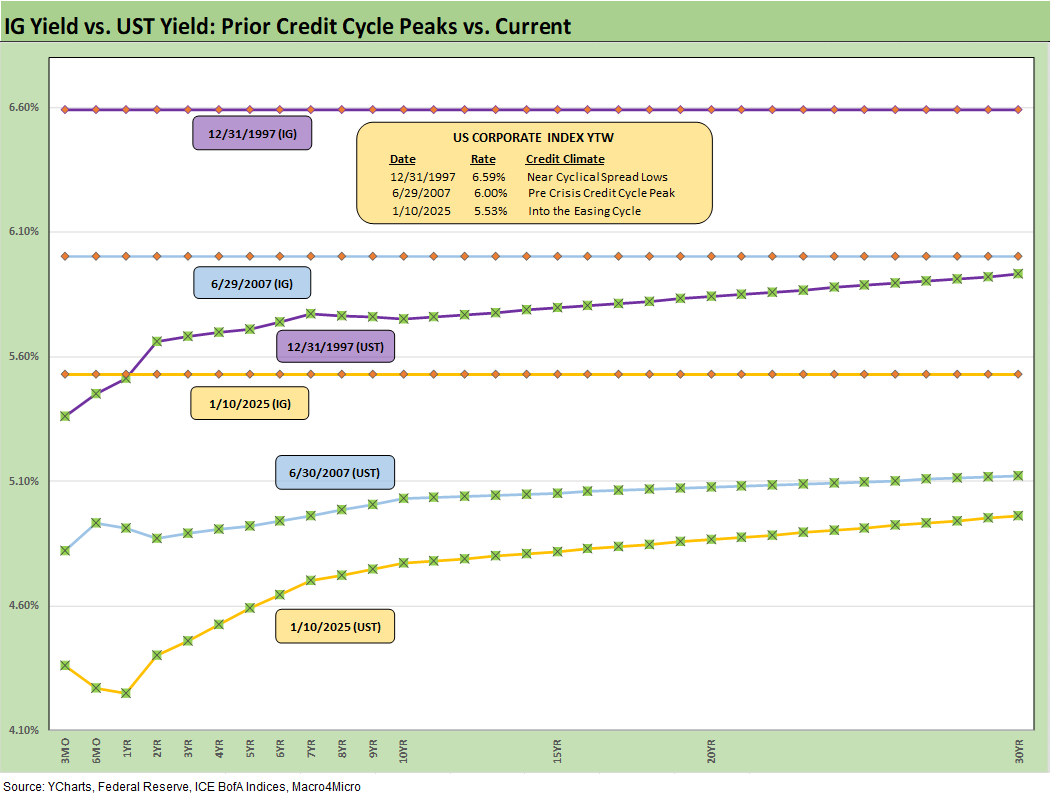
The above chart updates the comparison of IG index yields vs. the prior credit cycle peaks of June 2007 and late 1997. We also include the UST curves for each period with the same story this week as last.
The IG index remains at a discount to par at just over a 91 composite dollar price and a par weighted coupon of 4.3%. That means the slow and steady repricing of coupons in new issue and higher coupon supply will remain an attraction in IG offerings for asset allocation across various types of investors.
The market collectively is getting more concerned about steepening from a solid economy inherited by Trump about to be hit with high tariffs and labor disruptions. Then there is the handicapping of how the effects flow into product and service pricing trends, cost structures, and fundamental risk for many issuers. The theory is the market can get hit on rates and spreads with rates out the curve dictating IG returns.
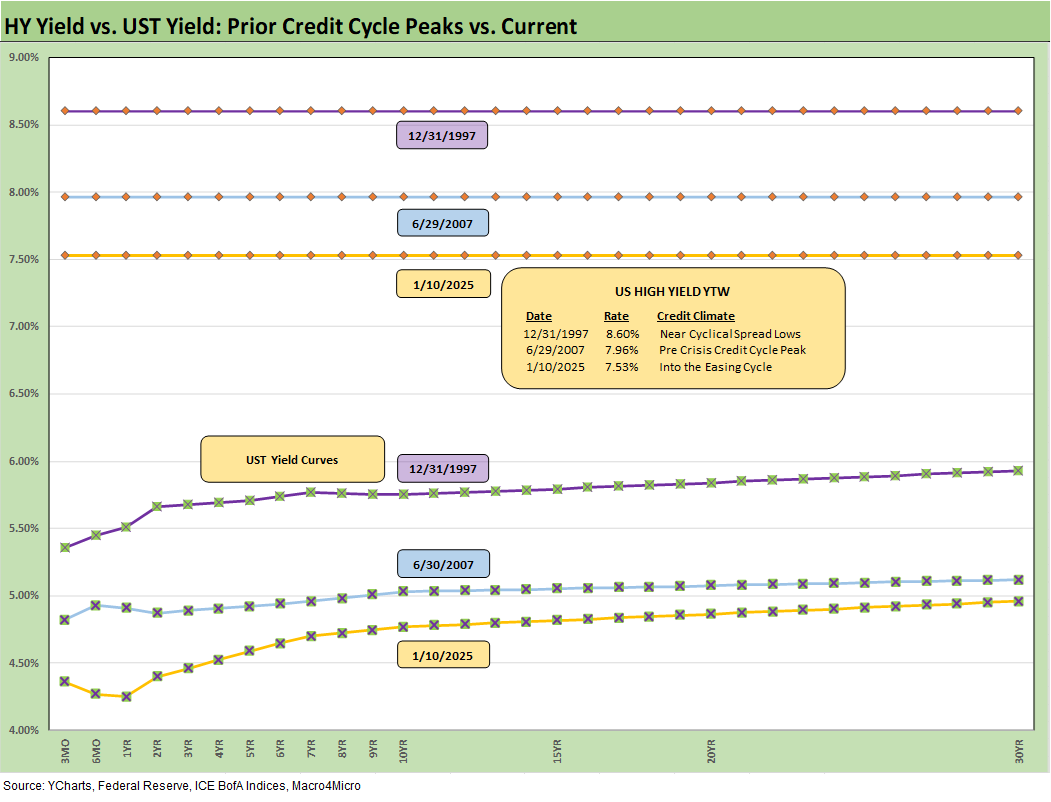
The above chart does the same drill we did for IG in comparing HY to June 2007 and late 1997. The effects on HY are more complex than in IG in some ways. In IG, UST rates are the key driver of total returns, and that is part of the process of managing interest rate risk at the portfolio level.
For HY, the lower duration exposure makes the 2025 performance more tied into repricing of credit risk - even if just a moderate move in OAS back toward the long-term median as detailed earlier in the commentary. After all, HY OAS ended Friday at spreads that were -182 bps inside the long-term median. That is a lot of room in the range.
The tariff fallout can run alongside earnings growth for many industries but many also could be challenged by supplier chain dislocations (notably autos, cap goods, industrials broadly). That mixes the threat of the market shifting expected risk premiums even for steady credits with those seeing fundamental deterioration on economic policies.
The policy advocacy is at the point where you cannot get GOP leaders to say “the buyer pays” on tariffs. That is not a debate. It is a fact. What is a debate is whether tariffs will cause inflation in its classic definition, reduced purchasing power in its literal definition, or drives reshoring in the big picture. The tariff stories will get put into practice soon enough for a road test of economic reality. That will of course bring a lot of distraction tactics to avoid some basic Newtonian Laws of finance (buyer pays and the cost ends up as dilution or higher prices). Double entry accounting is a bitch.
See also:
Footnotes & Flashbacks: State of Yields 1-12-25
Footnotes & Flashbacks: Asset Returns 1-12-25
Mini Market Lookback: Sloppy Start 1-11-25
Payroll Dec 2024: Back to Good is Bad? 1-10-25
US-Canada: Tariffs Now More than a Negotiating Tactic 1-9-25
Payroll % Additions: Carter vs. Trump vs. Biden…just for fun 1-8-25
JOLTS: A Strong Handoff 1-7-25
Annual GDP Growth: Jimmy Carter v. Trump v. Biden…just for fun 1-6-25
Footnotes & Flashbacks: State of Yields 1-5-25
Mini Market Lookback: Mixed Start, Deep Breaths 1-5-25
Footnotes & Flashbacks: Credit Markets 2024 1-3-25
Footnotes & Flashbacks: Asset Returns for 2024 1-2-25
HY and IG Returns since 1997 Final Score for 2024 1-2-25
Spread Walk 2024 Final Score 1-2-25
Footnotes & Flashbacks: Asset Returns for 2024 1-2-25
Credit Returns: 2024 Monthly Return Quilt Final Score 1-2-25
Annual and Monthly Asset Return Quilt 2024 Final Score 1-2-25
HY and IG Returns since 1997: Four Bubbles and Too Many Funerals 12-31-24
Footnotes & Flashbacks: State of Yields 12-29-24
Mini Market Lookback: Last American Hero? Who wins? 12-29-24
Spread Walk: Pace vs. Direction 12-28-24
Annual and Monthly Asset Return Quilt 12-27-24
Credit Returns: 2024 Monthly Return Quilt 12-26-24
New Home Sales: Thanksgiving Delivered, What About Christmas? 12-23-24
Mini Market Lookback: Wild Finish to the Trading Year 12-21-24
Trump Tariffs 2025: Hey EU, Guess What? 12-20-24
PCE, Income & Outlays Nov 2024: No Surprise, Little Relief 12-20-24
Existing Home Sales Nov 2024: Mortgage Vice Tightens Again 12-19-24
GDP 3Q24: Final Number at +3.1% 12-19-24
Fed Day: Now That’s a Knife 12-18-24
Credit Crib Note: Iron Mountain 12-18-24
Housing Starts Nov 2024: YoY Fade in Single Family, Solid Sequentially 12-18-24
Industrial Production: Nov 2024 Capacity Utilization 12-17-24
Retail Sales Nov24: Gift of No Surprises 12-17-24
Inflation: The Grocery Price Thing vs. Energy 12-16-24
Toll Brothers: Rich Get Richer 12-12-24
CPI Nov 2024: Steady, Not Helpful 12-11-24
Credit Crib Note: Herc Rentals (HRI) 12-6-24