
Footnotes & Flashbacks: Asset Returns 8-24-25
Broad market and subsector benchmarks are turning up all positive in both debt and equity.


All is well. Peace and harmony. Then again, gravity lurks.
With economic growth slower, inflation higher, jobs under pressure, and more tariffs rolling into the transaction chain with a queue of Section 232 pile-ons coming, all is good in the world.
While the equity backdrop could be seen as taking on the flavor of 2007 (Oct 2007 highs) or even the changeover from 1999 into early 2000 (March 2000 highs on NASDAQ), the big difference now is healthy banks and solid credit markets.
The past week was another one with stocks rebounding (after a stall) and UST declining. We have some big moments ahead with PCE and Income/Outlays granularity and August payrolls. We also get an updated estimate for 2Q25 GDP this week.
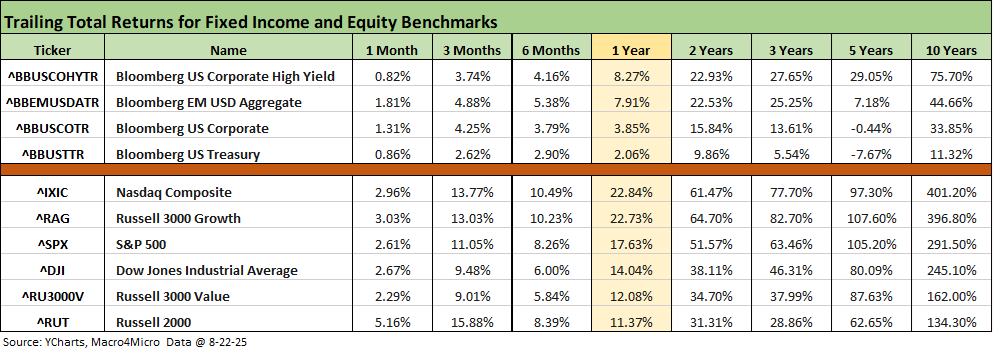
The above table updates the debt and equity benchmarks we watch, and the news is clearly positive for all lines and all trailing time horizons presented. You need to go back to the trailing 5-year time horizon for the UST index in the table to see some red with -7.67% as COVID and ZIRP gave way to inflation, a tightening cycle, and a UST shift higher.
The rolling return visual
In the next section, we get into the details of the 32 ETFs and benchmarks for a mix of trailing periods. Below we offer a condensed 4-chart view for an easy visual on how the mix of positive vs. negative returns shape up. This is a useful exercise we do each week looking for signals across industry groups and asset classes.
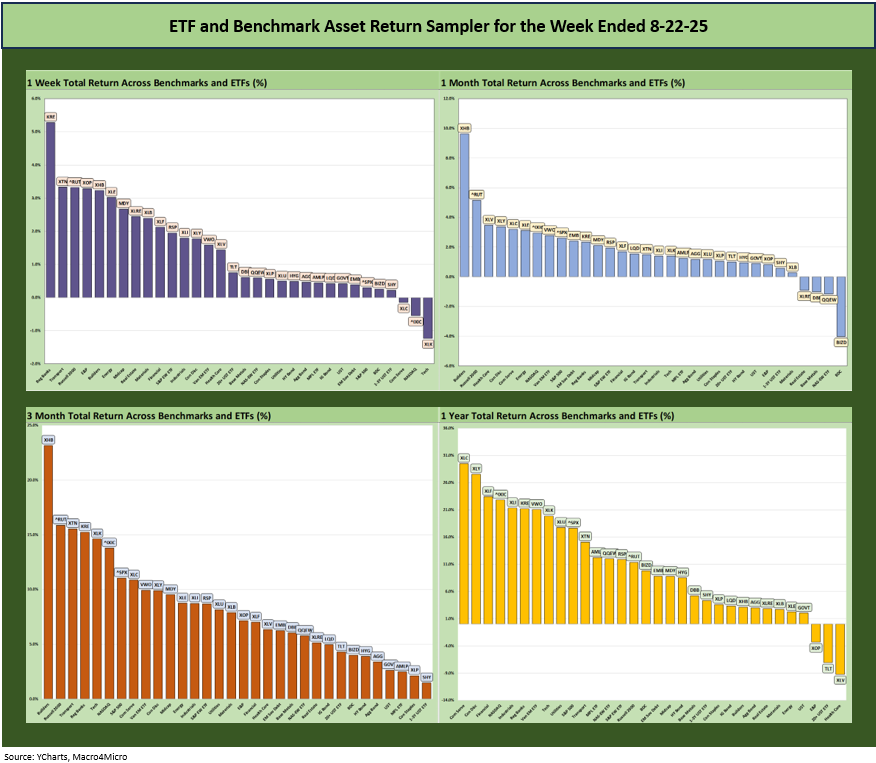
There is very little mystery in the positive return symmetry in the above chart. For 3 months, we even have a 32-0 shutout with all positive. The YTD score (shown separately below) is 31 positive and 1 negative.
The Magnificent 7 heavy ETFs…
Some of the benchmarks and industry ETFs we include have issuer concentration elements that leave them wagged by a few names. When looking across some of the bellwether industry and subsector ETFs in the rankings, it is good to keep in mind which narrow ETFs (vs. broad market benchmarks) get wagged more by the “Magnificent 7” including Consumer Discretionary (XLY) with Amazon and Tesla, Tech (XLK) with Microsoft, Apple, and NVIDIA, and Communications Services (XLC) with Alphabet and Meta.
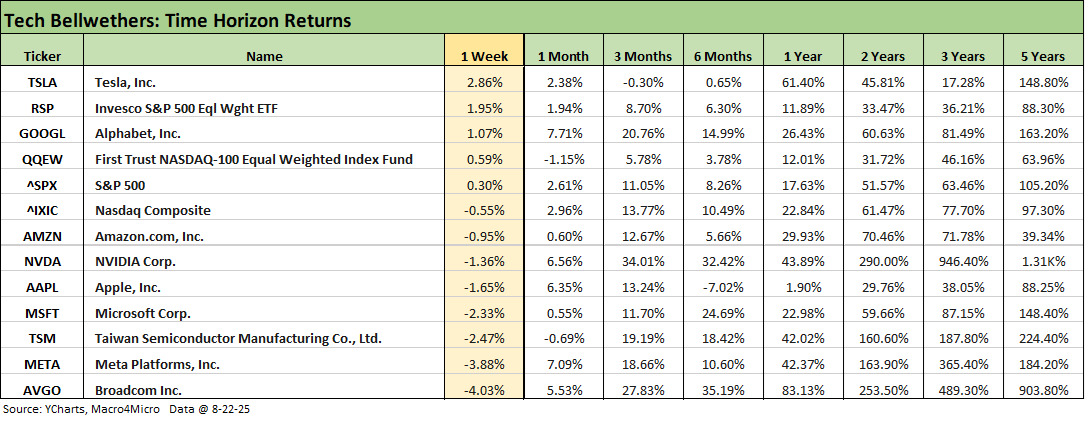
We looked at the 1-week performance of the tech bellwethers already in our Mini Market Lookback: The Popeye Powell Effect (8-23-25). Despite the Powell rally, it was a tough week for tech with the Tech ETF (XLK) in last place and joined in the red zone by NASDAQ and Communications Services (XLC). We see 5 of the Mag 7 in the red on the week joined by Broadcom on the bottom and Taiwan Semi three spots off the bottom. The challenge in finding firm cause and effect of returns week-to-week in the tech bellwethers is not always identifiable. Debating multiples and valuation excess has a mixed history.
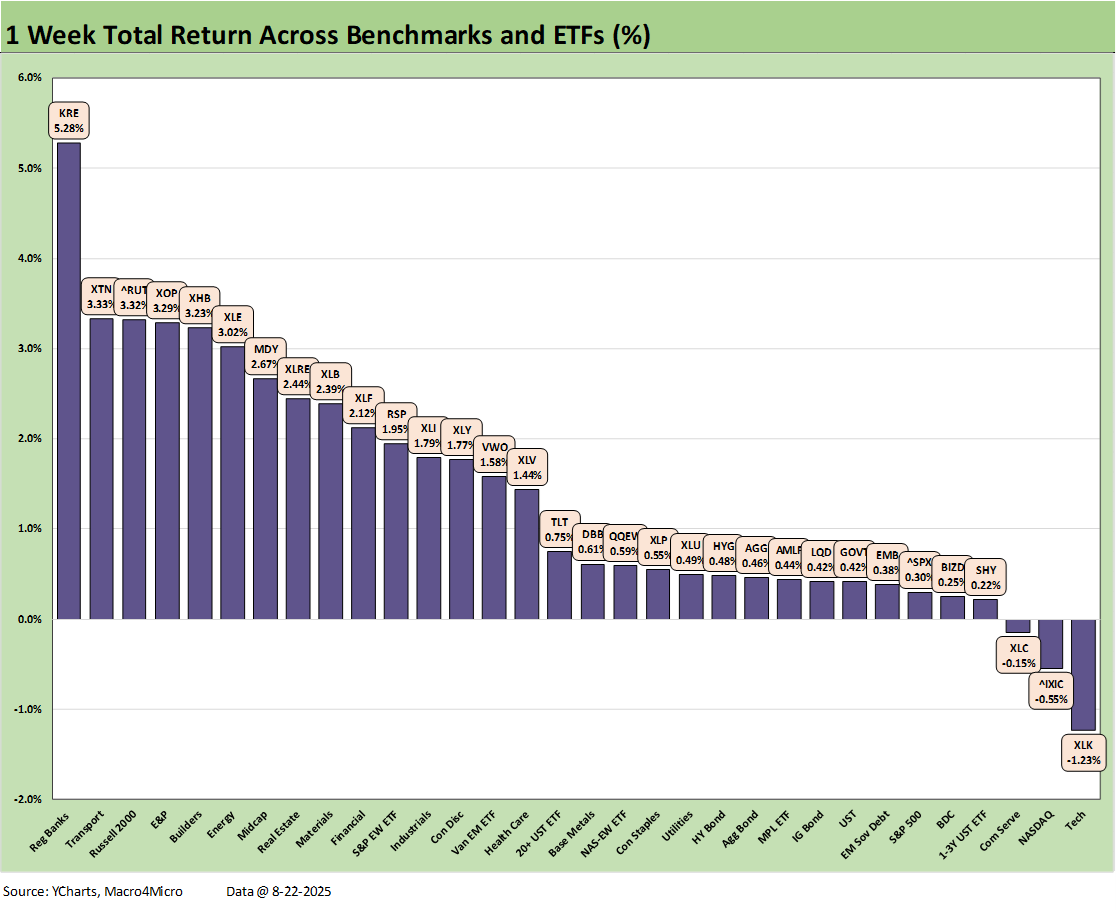
The weekly performance for the 32 benchmarks and ETFs was already looked at in our Mini Market Lookback: The Popeye Powell Effect (8-23-25). The S&P 500 was in the bottom quartile on the Mag 7 weakness but posted positive returns in 9 of 11 S&P 500 sectors as the two in the red (Information Technology and Telecom) held back the overall index.
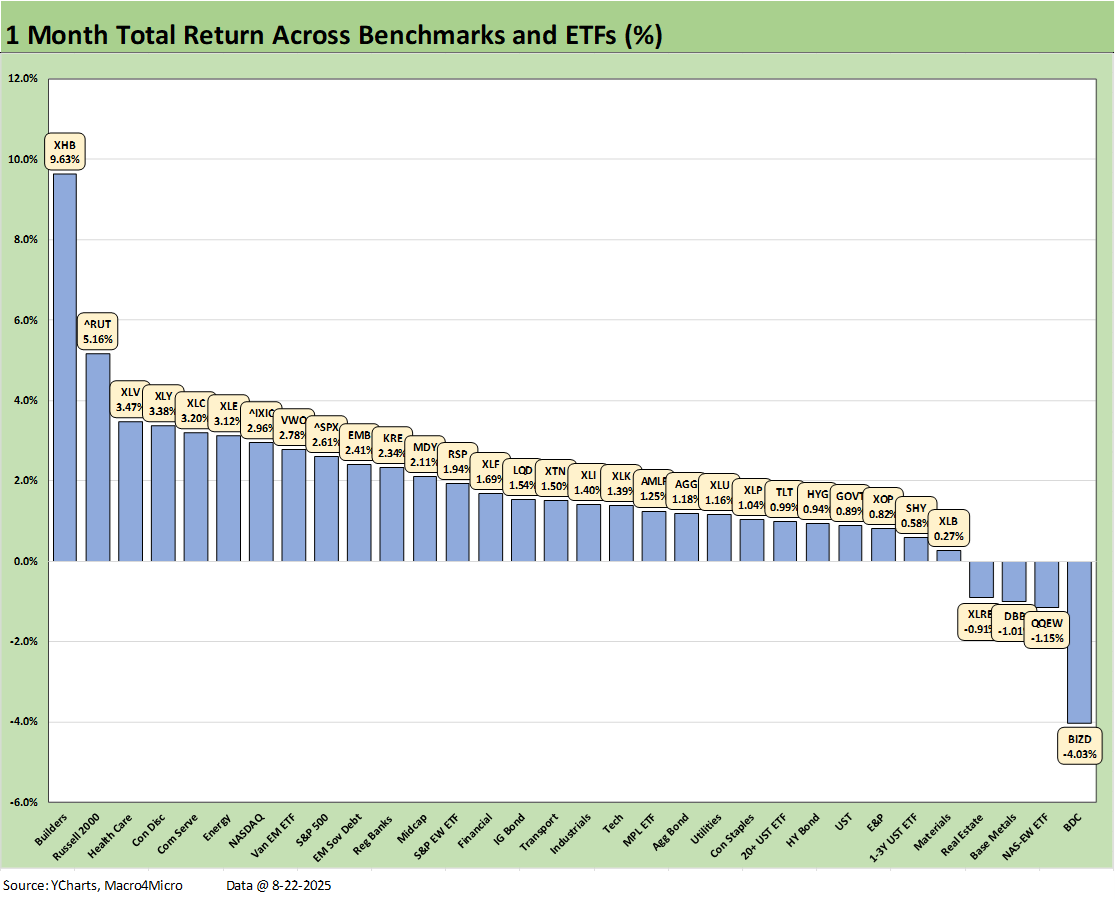
The 1-month time horizon posted a 28-4 score with BDCs (BIZD) on the bottom joined in the “red zone” by the Equal Weight NASDAQ 100 (QQEW), Base Metals (DBB) and Real Estate (XLRE). We see the Homebuilders ETF (XHB) way out in front at #1 as we discuss in the 3-month chart also. The same is true for the Rusell 2000 comeback for 1-month and 3-months.
The BDCs could get choppy from here given lower short rates and floating rate assets reducing cash income returns over time. On the other hand, lower rates could be a cyclical cushion at a critical juncture in the credit cycle for private credit. The inevitable downturn is getting handicapped as is the mechanism for how tariff impacts could flow into the small and mid-sized business subsectors. That in turn can also hit payrolls in tariff cost mitigation strategies.
For the recent 30-day horizon, the BIZD also went ex-dividend and that is a modest short-term distortion. There is no hiding from the natural concerns around credit quality erosion whether from the cyclical side or worries around origination quality in such a booming market in recent years.
BIZD was at the top of the bottom quartile for the rolling 3 months and only one slot off the bottom YTD, so that group is lagging even if a compelling source of cash dividends. As we detail further below, looking back 1 year sees BIZD sitting slightly above the median at a +9.8% return which was just below the cash dividend rate. BDC returns have lived off the dividend payout.
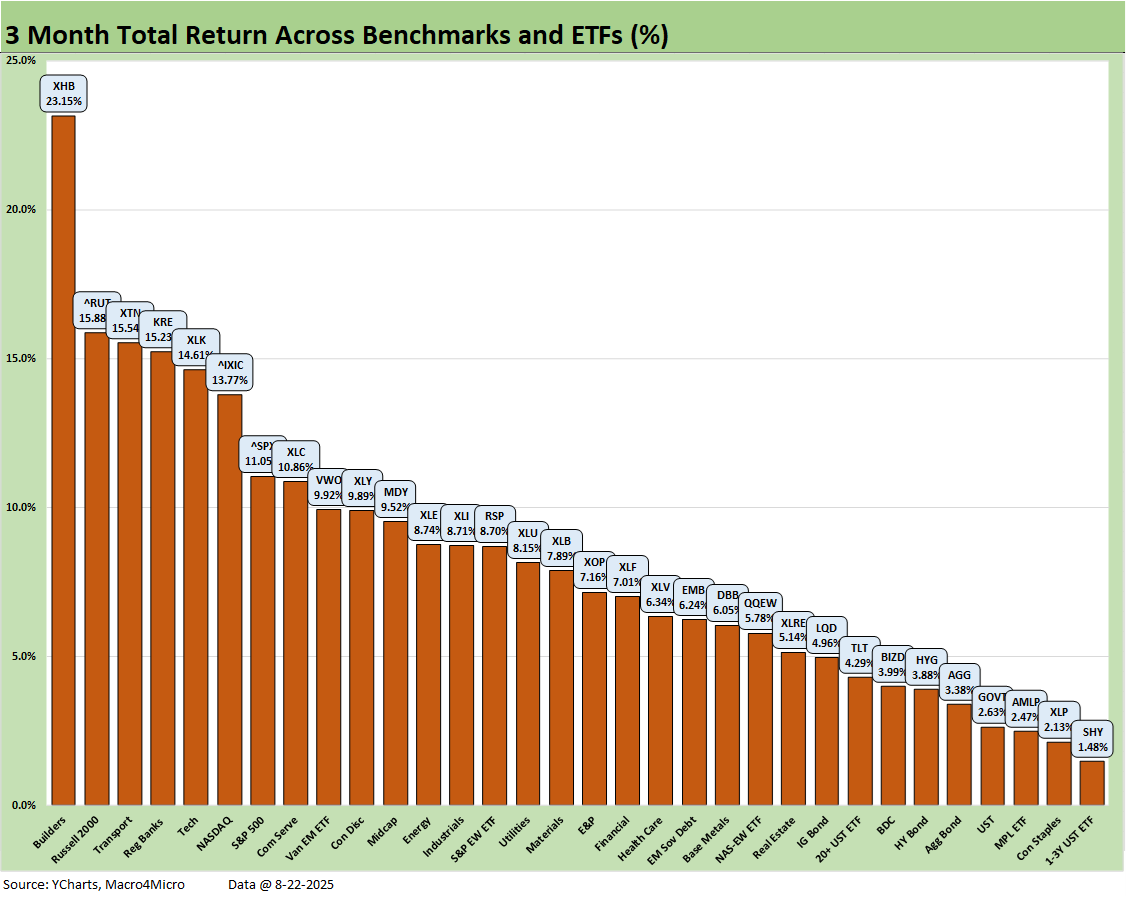
The 3-month returns weigh in at 32-0 with the post Liberation Day bounce in evidence plus now some optimism around FOMC action ahead. The cyclical signals from GDP, the consumer, inflation, and tariff worries have not derailed equity market appetites. Credit markets are sound, and banks are healthy while easing hopes clearly are giving a lift to the Regional Bank ETF (KRE).
The top quartile shows Homebuilders (XHB) at #1 as equity investors rotate back into the mortgage rate story and the pent-up demand fundamentals in housing if mortgage rates (with or without builder incentives) get back into a more comfortable zone. We see small caps at #2 in another positive signal from investors with the Russell 2000 a laggard for most of 2025 but now climbing into the YTD second quartile. Midcaps are still in the middle of the third quartile.
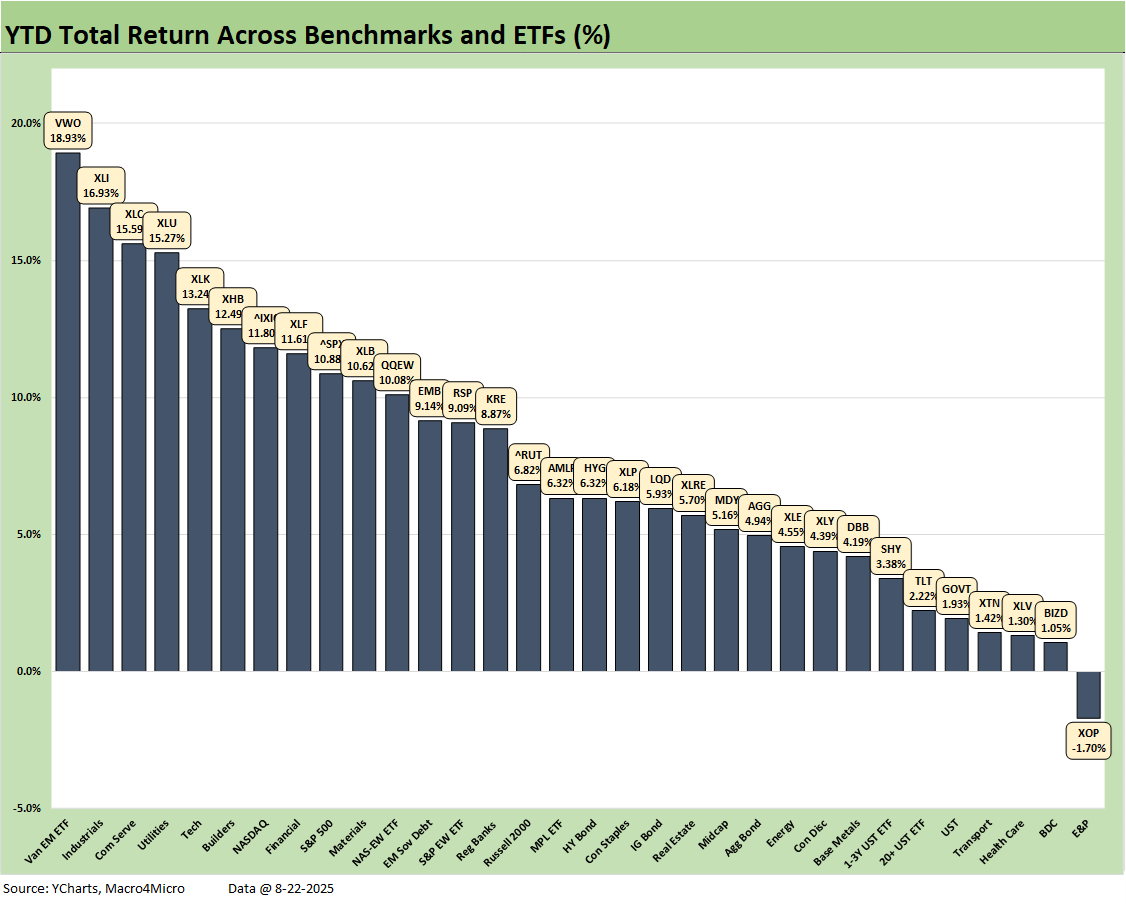
The YTD period posted a score of 31-1 with only E&P (XOP) in the red and EM Equities (VWO) on top. The Hi-Lo return differential is over 20 points, so stock picking had its rewards. The bottom of the top quartile saw Financials (XLF) at +11.6% while the top of the bottom quartile saw Base Metals at +4.2% for a differential of 7.4 points.
The broad/broader market benchmarks show NASDAQ in the top quartile at +11.8%, the S&P 500 at +10.9% just across the line in the upper end of the second quartile. The S&P 500 is still heavily wagged by the Mag 7.
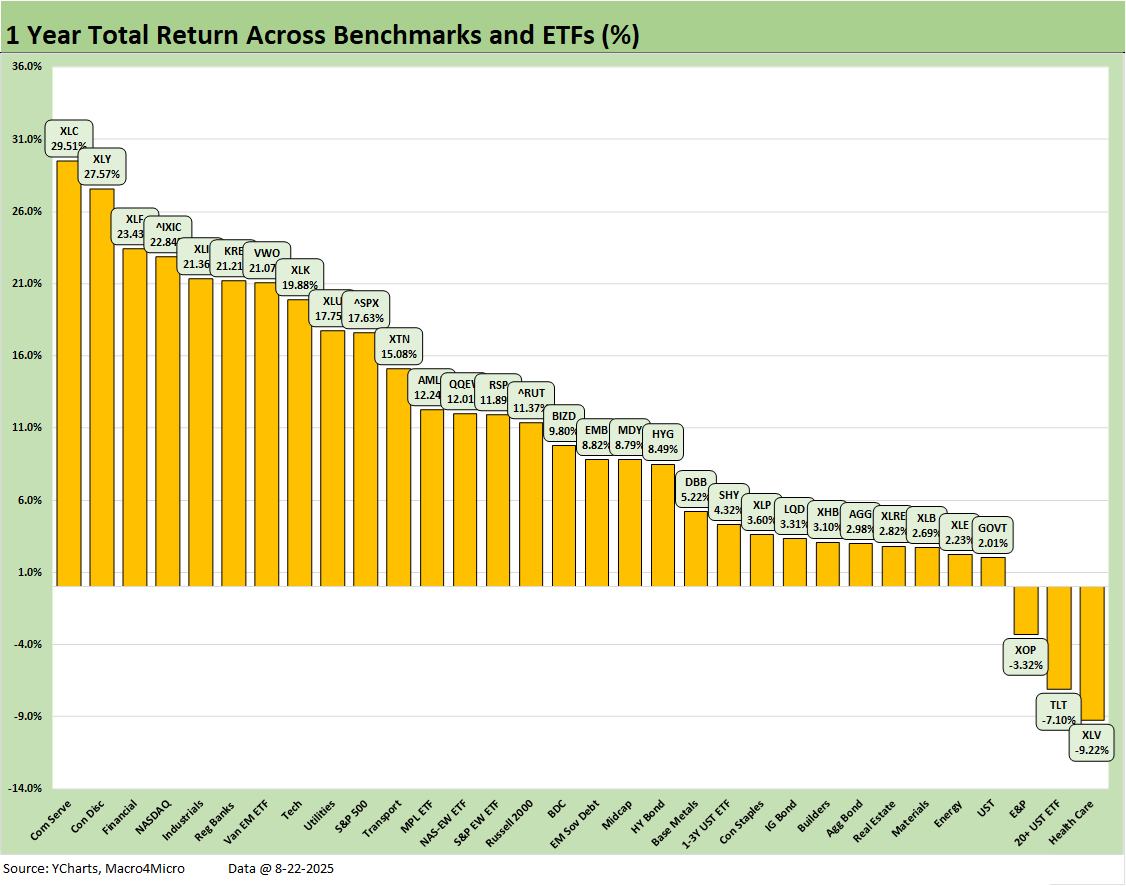
The 1-year returns stand at 29-3 with the Health Care ETF (XLV) on the bottom, the long duration UST ETF (TLT) still in the red zone, and oil prices still not working for E&P (XOP). Communications Services (XLC) holds down #1, Consumer Discretionary (XLY) is #2, Financials (XLF) #3, NASDAQ (IXIC) #4, and Industrials (XLI) #5 in what is a reasonably diverse mix even if the overall profile of the top quartile is tech biased. It is good to see broad Financials (XLF), Regional Banks (KRE), and Industrials (XLI) in the top tier.
The S&P 500 at a run rate of 17.6% over 1 year (10.9% YTD 2025) will need to finish 2025 strong to match the 2024 and 2023 S&P 500 returns. The year 2024 was Part 2 of the best 2-year run in the S&P 500 since the late 1990s, so that sets a high bar (see Footnotes & Flashbacks: Asset Returns for 2024 1-2-25). The S&P 500 return of +25% for 2024 (26% 2023) and more than double that for the cumulative 2 years (2023 through 2024) will be very hard to match in 2025-2026. That undermines Trump’s theme music of “the country was dead a year ago and 7 months ago.”
The reality is the world’s largest and most diverse economy continues to perform well enough despite the materially slower GDP growth. That performance since the COVID setbacks and ensuing inflation cycle keeps equity market confidence intact as the tariffs are slow to unfold in inflation or earnings setbacks – so far.
The period since early 2020 has not come even close to recession after a 2-month recession in early 2020 came after the longest recovery in history. As covered in earlier commentaries, it takes a lot to drive a recession (see Macro Menu: There is More Than “Recession” to Consider 8-5-25). Only two Presidents in the last 50 years have served out their term/s without a recession period – Clinton (2 terms) and Biden. The wild economic, capital markets, banking system issues, and geopolitical events that drove those recessions were also extraordinary.
See also:
Mini Market Lookback: The Popeye Powell Effect 8-23-25
Existing Home Sales July 2025: Rays of Hope Brighter on Rates? 8-21-25
Home Starts July 2025: Favorable Growth YoY Driven by South 8-19-25
Footnotes & Flashbacks: Credit Markets 8-18-25
Herc Holdings Update: Playing Catchup 8-17-25
Footnotes & Flashbacks: State of Yields 8-17-25
Footnotes and Flashbacks: Asset Returns 8-16-25
Mini Market Lookback: Rising Inflation, Steady Low Growth? 8-16-25
Industrial Production July 2025: Capacity Utilization 8-15-25
Retail Sales Jul25: Cautious Optimism in the Aisles 8-15-25
PPI: A Snapshot of the Moving Parts 8-14-25
CPI July 2025: Slow Erosion of Purchasing Power 8-12-25
Iron Mountain Update: Records ‘R’ Us 8-11-25
Mini Market Lookback: Ghosts of Economics Past 8-9-25
Macro Menu: There is More Than “Recession” to Consider 8-5-25
Mini Market Lookback: Welcome To the New World of Data 8-2-25
Happiness is Doing Your Own Report Card 8-1-25
Payrolls July 2025: Into the Occupation Weeds 8-1-25
Employment July 2025: Negative Revisions Make a Statement 8-1-25
Employment Cost Index 2Q25: Labor in Quiet Mode 7-31-25
PCE June 2025: Prices, Income, and Outlays 7-31-25
2Q25 GDP: Into the Investment Weeds 7-30-25
2Q25 GDP: First Cut of Another Distorted Quarter 7-30-25
United Rentals: Cyclical Bellwether Votes for a Steady Cycle 7-29-25