
Credit Snapshot: Toll Brothers
We summarize the credit fundamentals of Toll Brothers.

Credit Trend: Positive
Summary credit profile:
Toll Brothers (TOL) credit ratings should have a high BBB tier composite rating instead of low BBB based on the balance of financial metrics, high margins, below average business risk, and an exceptionally strong and unrivaled position in the luxury segment. Toll has been a superior performer in terms of profit margins, cut total debt by almost $1.2 bn since 2019 while shaving 12 points off total debt % cap, boasts cash + inventory of 4.1x total debt, and has an incremental inventory level of $3 bn running alongside lower total debt.
TOL has navigated the tightening cycle in impressive fashion with unadjusted gross margins from home sales averaging above 26% from FY 2023 through 1Q25 (over 28% adjusted in FY 2023/FY 2024). TOL remains confident and affirmed FY 2025 guidance with 1Q25 results (same as issued at 4Q24), which has not been the case with some other major builders. TOL expects adjusted gross margins above 27% for FY 2025.
Relative value:
As of 1Q25, Toll has 4 short bonds with maturities in 11/25, 3/27, 2/28, and 11/29. A short cluster of bonds at coupons below current markets at tight spreads is common with the major builders. These are coupon clipping bonds to see what refinancing and extension plans TOL might unveil in 2025. We expect a refinancing and extension of its $350 mn 4.875% Nov 2025 bond. Toll has an unsecured term loan of $650 mn due 2030 that recently went through a maturity schedule extension.
TOL offers defensive credit risk exposure with its distinctive competitive position and ample resilience to withstand most logical cyclical outcomes. Toll’s distinctive position in luxury and its flexibility to manage working capital and home inventory leave TOL better positioned to react to cyclical conditions than most BBB tier issuers.
Business risk:
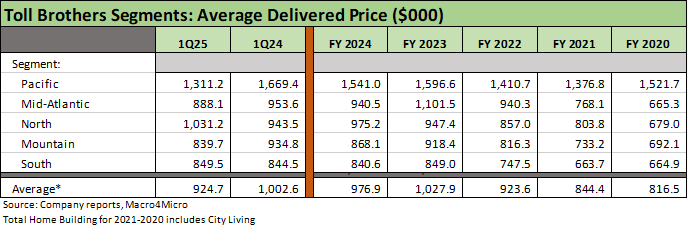
High average selling prices at an average of just under $925K in 1Q25 after $950K during FY 2024 tell a story about Toll’s clientele. TOL’s luxury ASPs swing notably by region with the highest prices in the Pacific segment ($1.4 mn in FY 2024) and North segment ($1.0 mn in FY 2024). The 1Q25 backlog ASP of $1.1 mn underscores the financial strength of the customer base. There is some seasonality for some segments with a higher ASP mix expected in the peak selling season.
High down payments and low cancellation rates (2.4% in 1Q25 vs. beginning of quarter backlog), a high mix of cash buyers (26%), and lower LTVs for those who use a mortgage (68%) supports the view of TOL’s lower business risk. The customer base quality stands out in the builder issuer mix. Toll has 70% of its business in “luxury move-up and empty nester” customer segments and 25% to 30% first time buyers (often older).
The ability to manage working capital and discretionary cash flow when demand is rising or declining while adjusting land spend as needed adds a level of financial flexibility that makes homebuilders lower risk as a business. Within the homebuilder group, we believe Toll evidences lower business risk vs. peers based on its unique franchise.
Tariffs:
Toll downplays the tariff threat like most major builders, but the NAHB has made it clear that cost pressures will flow from the tariff policies currently underway. The NAHB has offered ample details on their tariff complaints, and material cost increases will come with tariffs even just considering Canada (lumber, aluminum, steel) and Mexico (gypsum, steel). Tariffs on countries, materials used in appliances, and a wide range of components/supplies from Asia also factor in.
The builders can work with their trade partners to share the burden and can partly factor in the costs into their design and pricing decisions. Major builders are critical downstream customers for suppliers and can offer long-term reliable, recurring annual revenues. The largest homebuilders are more likely to come out on top in a combination of cost sharing with trade partners and passing on more costs in home prices.
Profitability:
Record revenue, record gross profits, and record net income make a clear statement while Toll was a rare homebuilder to post higher dollar gross margins in FY 2024 (10-31 fiscal year) and 2023 than in 2022 and 2021 with 26% handle gross margins the past two fiscal years. 4Q24 ended on a very strong note with contracts up over 30% and an adjusted gross margin of 28.4%. The 4Q24 incentive costs ran around $68K and those declined to $62K in 1Q25 with 2Q25 starting off lower near $55K and expected to be lower in FY 2025.
For 1Q25, Toll posted strong numbers including higher unit sales but lower ASPs on a geographic mix shift (less Pacific and North over the $1 million ASP level and higher Mountain at ~$840K ASP). Contracts rose in units during 1Q25 by almost 13% with a consolidated contract ASP of $1.0 mn. Toll continued to guide investors to an increase in community count of 8% to 10% in FY 2025 with a goal of 440 to 450 from the 1Q25 count of 406. Some markets are seeing higher prices and some lower according to management.
Balance sheet:
The net debt to cap of 15% at 4Q24 has been cut in half since 2019/2020. At 1Q25, Toll drew down its cash balance more as it built up inventory for the spring selling season, so net debt leverage rose (21.1% net debt to cap) even as total debt declined. Stock buybacks continued at a high rate of $627 mn in FY 2024. Cash + inventory is over 4x debt. During 1Q25, stock buybacks picked up modestly YoY to $23 million, but the target buyback rate for 2025 was affirmed at $500 mn vs. $627 mn in FY 2024, $562 in FY 2023, and $543 mn in FY 2022. The planned buybacks in 2025 amount to less than 5% of current market cap of over $10 bn (5-5-25).
Toll has a $650 million unsecured term loan that now matures on 2-7-30 after an amended agreement in Feb 2025. In Feb 2025, Toll also increased its revolving credit facility to $2.35 bn from $1.96 bn and extended the maturity from 2-14-28 to 2-7-30.
SELECT CHARTS
Record revenues and income in FY 2024, mid-20% gross margins stand out.

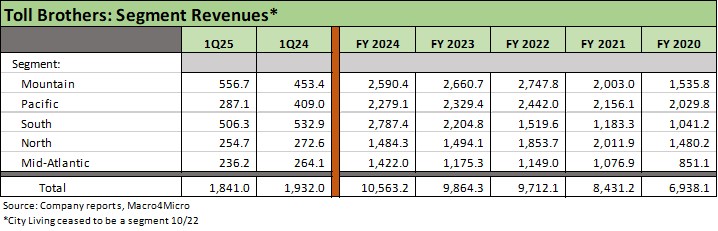
Segment income starting to feel pressure in 1Q25 after record 2024.

Toll ASPs highest among peers with the Pacific and North in the lead.
Well diversified by geographic segment with strong South growth this cycle.
Material decline in leverage this cycle. Rising in 1Q25. Strong asset coverage.

Free cash flow is healthy and share buybacks steady.
